
MULTIMETRIC NETWORK TOMOGRAPHY
Muhammad H. Raza, Bill Robertson, William J. Phillips
Department of Engineering Mathematics and Internetworking, Dalhousie University, Nova Scotia, Halifax, Canada
Jacek Ilow
Department of Electrical Engineering, Dalhousie University, Nova Scotia, Halifax, Canada
Keywords:
Network tomography, Link delays, Multimetric, NTF, NNMF.
Abstract:
We introduce a novel concept of multiple metric network tomography in this paper. The conventional network
tomography observes a single parameter directly and infers another parameter indirectly from the the directly
measured parameter. We consider observing two parameters (packet loss rate (PLR) and path delays) directly
and use both of these parameters to infer a single parameter indirectly. We applied a variation of NTF1 model
of non negative tensor factorization (NTF) for this purpose and estimated link delay. Simulation results should
show a better correlation between the estimated and measured link delays when duplex of metrics is used as
compared to using only the path level link delays for estimating the link delays on a test bed.
1 INTRODUCTION
Network tomography presents a good means to mea-
sure the statistics of interest that may not be measured
directly. Network tomography measures a parameter
actively or passively (that is not desired for network
management), and the desired parameter is indirectly
measured by applying statistical techniques over an
inverse model. Such parameters are essential for net-
work management.
Vardi (Vardi, 1996) was the first one to introduce
the term of network tomography for such kind of indi-
rect inference of interested statistics. The research on
network tomography has always concentrated on esti-
mating a single parameter indirectly from another pa-
rameter that is directly measured. Various categories
of network tomography have been mentioned in the
literature in this context (Castro et al., 2004) (Coates
and Nowak, 2001).
The simplest model of network tomography, that
represents the above two examples is shown by the
following equation,
Y = AX, (1)
linking the measured parameters matrix (Y) with the
matrix of unknown parameters (X) with dependence
on the routing matrix (A) of the network. If Y has I
rows and X has J rows, then the size of the routing
matrix (A) is I×J. The rows of A (A
i
) correspond to
paths from the sender to the receivers and the columns
(A
j
) correspond to individual links in those paths. An
element (A
ij
) of the routing matrix is 1 if the link j is
included in the path i and 0 otherwise.
In contrast to the conventional tomography model
as discussed above, we propose the idea of direct mea-
surements of multiple metrics to recover indirectly a
single parameter with expectation of getting a better
estimate as compared to using a single directly mea-
sured parameter to estimate a parameter indirectly.
The new model is represented by the equation below,
where Y
1
and Y
2
are directly observed in order to es-
timate X indirectly by solving the following inverse
equation.
Y
1
Y
2
= AX (2)
For example, instead of recovering link delays from
merely end to end path delays, we can estimated link
delays from a combination of path delays (Y
1
) and
PLR (Y
2
). The idea behind this innovation is that a
better input in terms of two interdependent metrics
should produce better estimation than using only one
parameter such as path level delay. This correlation
of two network parameters has been discussed in the
literature. For example, the authors of (Moon et al.,
1998) report on the correlation between delay and loss
observed by a continuous-media traffic source. This
study is to determine the extent to which one perfor-
mance measure could be used as a predictor of the
80
H. Raza M., Robertson B., J. Phillips W. and Ilow J. (2010).
MULTIMETRIC NETWORK TOMOGRAPHY.
In Proceedings of the International Conference on Data Communication Networking and Optical Communication Systems, pages 80-84
DOI: 10.5220/0002982000800084
Copyright
c
SciTePress

future behavior of the other (for example, whether ob-
served increasing delay is a good predictor of future
loss) so that an adaptive continuous media application
might take anticipatory action based on observed per-
formance.
For this purpose, we have applied one of the varia-
tions of NTF1 model of nonnegative tensor factoriza-
tion (NTF) (Cichocki et al., 2009).
The rest of the paper is organized as follows. Section
2 reviews the related work. Section 3 discusses NTF.
Section 4 details simulation arrangements. Section 5
presents and discusses results. Section 6 concludes
the paper.
2 RELATED WORK
This section investigates related work in the domains
of multiple metric network tomography concept and
the interdependence of link delays and PLR.
2.1 Multimetric versus Additive Metrics
Up to best of our knowledge, there has never been
an implicit consideration of directly measured multi-
ple metrics for indirect estimate of a network metric.
Though, we found an evidence (Bhamidi et al., 2006)
of considering multiple metrics in the form of addi-
tive metrics. A framework was proposed for analyz-
ing topology using ideas and tools from phylogenetic
inference in evolutionary biology. The phylogenetic
inference problem determines the evolutionary rela-
tionship among a set of species. The framework is
built upon additive metrics. Under an additive met-
ric the path metric (path length) is expressed as the
summation of the link metrics (link lengths) along the
path. The basic idea is to use (estimated) distances
between the terminal nodes (end hosts) to infer the
routing tree topology and link metrics. Based on the
framework some inference algorithms have been pre-
sented as an alternative to network tomography.
They (Bhamidi et al., 2006) consider that G = (V,
E) denotes the topology of the network, which is a
directed graph with node set V (end hosts, internal
switches and routers, etc.) and link set E (communi-
cation links that join the nodes). For any nodes i and
j in the network, if the underlying routing algorithm
returns a sequence of links that connect j to i, they say
j is reachable from i. They call this sequence of links
a path from i to j, denoted by P(i, j).
As per their terminology, d(e) can be viewed as
the length of link e, and d(i, j) can be viewed as the
distance between nodes i and j. Basically, an addi-
tive metric associates each link on the tree with a fi-
nite positive link length, and the distance between two
nodes on the tree is the summation of the link lengths
along the path that connects the two nodes. Suppose
T(s, D) = (V, E) is a routing tree with source node s
and destination nodes D. Let
d(E) = d(e) : eεE (3)
denotes the link lengths of T(s, D) under additive met-
ric d. Remember U = s
S
D is the set of terminal
nodes on the tree. Let
d(U
2
) = d(i, j) : i, jεU (4)
denote the distances between the terminal nodes.
The above review makes it clear that consider-
ing additive metric is different from multiple metric
based network tomography. Actually this phyloge-
netic based technique is claimed to be an alternative
of network tomography(Bhamidi et al., 2006). There-
fore, our idea of considering multiple metric stays
as a novel way of improving the conventional mono-
metric network tomography.
2.2 Correlation of Link Delays and PLR
The authors of (Moon et al., 1998) examine the cor-
relation between packet delay and packet loss experi-
enced by a continuousmedia traffic source. Their goal
is to study the extent to which one performance mea-
sure can be used to predict the future behavior of the
other (for example, whether observed increasing de-
lay is a good predictor of future loss) so that an adap-
tive continuous media application might take antici-
patory action based on observed performance. They
provide a quantitative study of the extent to which
such correlation exists. There are two examples in
this regard.
When the buffer reaches its capacity, packet losses
begin to occur. The receiver of the continuous-media
application thus sees increased delay, and eventually
losses.
When packets from a continuous-media applica-
tion arrive at a buffer that is already full, they are
dropped. As other sources (for example, TCP con-
nections) detect congestion and decrease their trans-
mission rate, the queue length at the buffer will de-
crease, and packets from the continuous-media appli-
cation will start to be queued, rather than dropped.
The receiver sees losses followed by high, but possi-
bly decreasing, packet delays.
They introduce a lag, loss-conditioned average de-
lay, in calculating the average delay conditioned on
loss. Specifically, the average packet delay, condi-
tioned on a loss occurring at a time lag j packets in
the past, is the average delay of all packets in the trace
MULTIMETRIC NETWORK TOMOGRAPHY
81
that have a loss j packets before them in the trace.
That is,
E[d
i
| l
i− j
= 1] =
∑
kεP
d
k
/ | P |, (5)
where P = k : l
k− j
= 1 and l
k
= 0.
If the loss-conditioned average delay at a positive
lag of j is higher than the unconditional average delay
(that is, the delay averaged over all received packets),
then the packets that arrive j packets after a loss have
a higher average delay than the unconditional average
delay. That is, a loss occurring j packets in the past
can be taken as a precursor to a higher delay later.
This discussion shows that delay and PLR
are interdependent and correlated based on loss-
conditioned average delay. This evidence motivated
us to consider multimetric network tomography. We
have applied NTF tool to carry out the multiple metric
network tomography and NTF is briefly described in
the next section.
3 NONNEGATIVE TENSOR
FACTORIZATION (NTF)
We researched for a mathematical technique that
could deal with multiple metrics and is capable of
matrix factorization. Matrix factorization is an im-
portant area in signal processing and linear algebra,
with applications in many other areas. Blind source
separation (BSS) and related methods, for exam-
ple, independent component analysis (ICA), employ
a wide range of unsupervised learning algorithms and
have found important applications from engineering
to neuroscience (Cichocki et al., 2009).
Tensors are generalizations of vectors and ma-
trixes, for example, a third-order tensor (or three-way
array) has three modes (or indices or dimensions).
A tensor is a multi-way array or multi-
dimensional matrix. The order of a tensor is the num-
ber of dimensions, also known as ways or modes.
Tensor can be formally defined as following. Let I
1
,
I
2
, . . . , I
N
ε N denote index upper bounds. A tensor
Y ε R
I
1
,I
2
,...,I
N
of order N is an N-way array where el-
ements y
i
1
,i
2
,...,i
N
are indexed by i
n
ε 1,2,...,I
n
for 1≤
n ≤ N.
Unfolding or matricization or flattening is a pro-
cess of reordering the elements of an N-th order ten-
sor into a matrix. Two of the most commonly used
decompositions are the Tucker decomposition and
PARAFAC, which are often considered as higher or-
der generalizations of the matrix singular value de-
composition (SVD) or principal component analysis
(PCA). A model which imposes nonnegativity on fac-
tor matrices is called the NTF (Nonnegative Tensor
Factorization) or Nonnegative PARAFAC (Cichocki
et al., 2009).
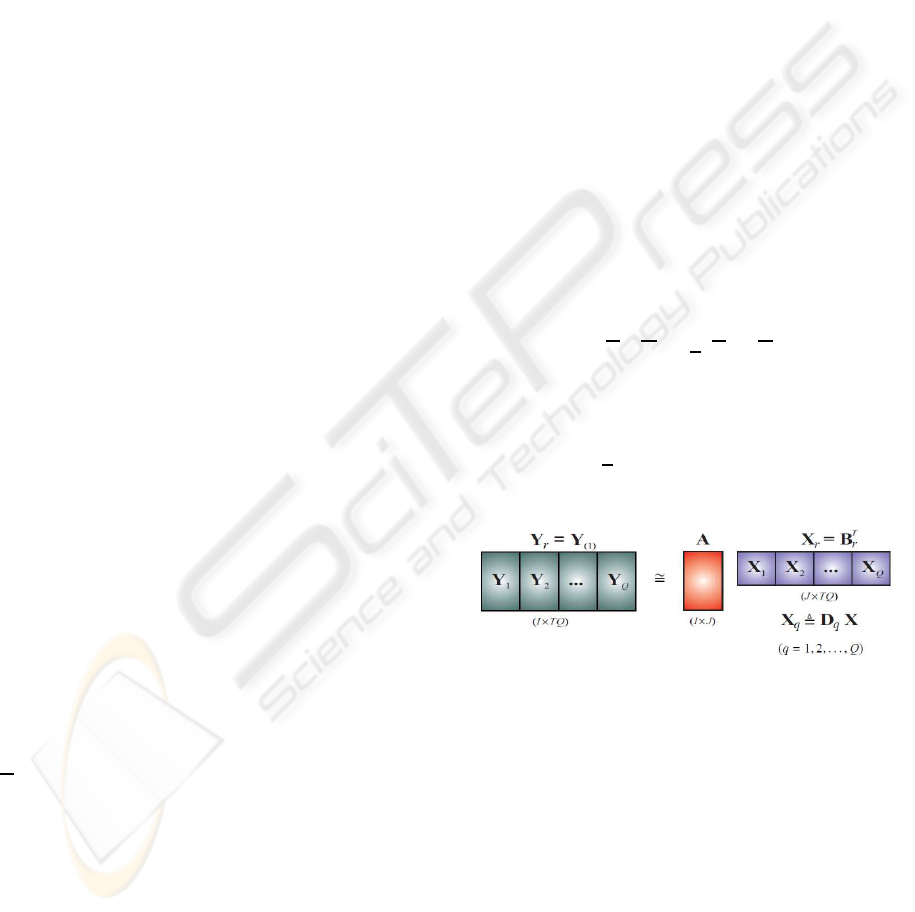
Figure 1 illustrates one of the three ways of the
basic 3D NTF1 model, which is an extension of the
NTF model. As per NTF1 model, given a three-
way (third-order) tensor formed by a set of matrices
Y
q
εR
I×T
q
+
(q = 1, 2, .,.,.Q), formulates a set of nonneg-
ative and sparse matrices A εR
I×J
+
, C εR
Q×J
+
, and A
X
q
εR
I×J
+
for q = 1,2,.,.,.Q with reduced dimensions
(J << I < T
q
).
Global matrix representation using row-wise un-
folding of the three-way array is shown in Figure 1
and is expressed (error free model) as Y
q
= AD
q
X
q
. In
this case the sub-matrices are defined as X
q
, D
q
X
q
.
Thus, only the mixing matrix A and the set of scaled
source matrices X
q
need to be found whereas due to
scaling ambiguity the matrix C does not need to be
calculated explicitly (Cichocki et al., 2009).
There are several possible approaches to find or
identify extended NTF1 model such as global strat-
egy, or local strategy, or a combination of both. A
global strategy based on alternating minimization of
cost function is shown in the following equation.
D
F
(YkAX) =
1
2
kY − AXk
2
F
(6)
A local strategy based on alternating minimization of
cost function is shown in the following equation.
D
F
(Y
q
kAX
q
) =
1
2
kY
q
− AX
q
k
2
F
(q = 1,2, .,.,.,., .,Q)
(7)
Figure 1: Decomposition into two matrices using row-wise
unfolding (Cichocki et al., 2009).
We plan to employ local strategy based on alter-
nating minimization of cost function in the simula-
tions. For solving the model, Y
1
Y
2
= AX, NTF will
be applied to recover link delays (X) from a duplex of
metrics (path delays (Y
1
) and PLR (Y
2
)). Two matri-
ces (Y
1
and Y
2
) will be input to NTF and a matrix,
X, will be determined as per row wise decomposition
shown in Figure 1. The parameters (Y
1
, Y
2
, and X
(for bench marking)) of the multimetric network to-
mography model will be determine from a laboratory
test bed. The setup of the test bed and simulations is
discussed in the next section.
DCNET 2010 - International Conference on Data Communication Networking
82

4 SIMULATION ARRANGEMENT
FOR MULTIMETRIC
NETWORK TOMOGRAPHY
We collected data from a test with two options.
Firstly, we determined link delay from path delays by
using non negative matrix factorization (NNMF) by
using Cisco Service Level Agreement (CSLA). Sec-
ondly, we determined link level delay from a com-
bination of path delay and PLR by using CSLA and
Real Time Transport Protocol (RTP) (RFC 1889) by
using row wise unfolding of NTF1 model. This sec-
tion discuses the test bed and simulation arrangement,
delay estimation by using path delay input to NNMF,
and link delay estimation from the combined data of
path delay by CSLA and RTP.
We set up a test bed in the Advanced Internet-
working Laboratory (AIL) at Dalhousie University
that consists of six 38 series Cisco routers, Agilent
Router Tester (N2X), and a Multi Router Traffic Gra-
pher (MRTG) capable workstation. OSPF routing has
been implemented on routers and N2X. The test bed
is of smaller size and has limited number of links, be-
cause we have to collect the actual values of the link
delays for bench marking the accuracy of estimated
link delays. We intent to prove that the estimated link
delays are close to the actual link delays. In contrast
to this test bed, the practical networks are larger in
scale, but scalability is not an issue as NNMF and
NTF can handle larger sizes of matrices (Cichocki
et al., 2009).
The Echopath option of the CSLA was imple-
mented to send four probes and collect the cumula-
tive round trip time (RTT) from source to each hop.
All probes were grouped together. All the probes in
the group start at the same time. The group of probes
was repeated 100 times with a time difference of 10
sec between two consecutive repetitions. The MRTG
enabled workstation verified the end to end RTT. The
selected links were stressed by two sources: extended
ping on selected links and traffic injected from the
N2X.
Figure 2 shows the test bed with the four probes
and two of the links (1 and 6) were stressed with an
extended ping of 200 Bytes. The other source of dis-
turbance was the traffic from the Agilent router tester
(N2X). The module 1 of N2X was generating a vari-
able packet size from 1000 Bytes to 1500 Bytes. The
size of the probes in CSLA was 10 Bytes for this sce-
nario. In this case also, the condition of the network
remains unchanged during the CSLA operation.
Figure 2: Testbed Setup with a mixture of extended pings
and N2X traffic.
4.1 Estimation of Link Delay from Path
Delays
In this first part of the simulations, we estimate link
delays from path level delays and then determine the
correlation between the estimated and measured link
delays. The data obtained from the CSLA is in the
form of accumulative hop-wise round trip time, the
following steps are followed to process the data for
obtaining two matrices; a matrix of end to end delays
and a matrix of link level delays:
1. A parsing software, written in java, extracts link
delays and end to end (path) delays in the form of
two matrices. From the accumulative round trip
time from source to each hop, hop to hop delays
are calculated to form the link delay matrix. From
the accumulative round trip time from the source
to the destination, end to end delay matrix is de-
termined.
2. Path level delays (V) are input to NNMF. The
Matlab tool NMFpack (Hoyer, 2004) has been
used for NNMF factorization. The NMFpck Mat-
lab package implements and tests various versions
of NNMF with the feature of sparsity. The spar-
sity for the routing matrix is kept fixed at 0.5 in all
the tests and the sparsity of the link delays varies
from 0.1 to 0.9.
3. The coefficient of correlation between the esti-
mated link delay (H) and actual link delay (X)
is determined by using a modified component of
EEGLAB. The EEGLAB is an interactive Mat-
lab toolbox for processing continuous and event-
related EEG, MEG and other electrophysiological
data.
For finding the correlation coefficient, matching
rows in two matrices (H and X) are found and
their correlation is determined. As a result a col-
umn vector of correlation coefficients between the
best-correlating rows of matrices H and X is ob-
tained along with other by-products.
Figure 3 shows a correlation between the esti-
mated and true link delays.
MULTIMETRIC NETWORK TOMOGRAPHY
83
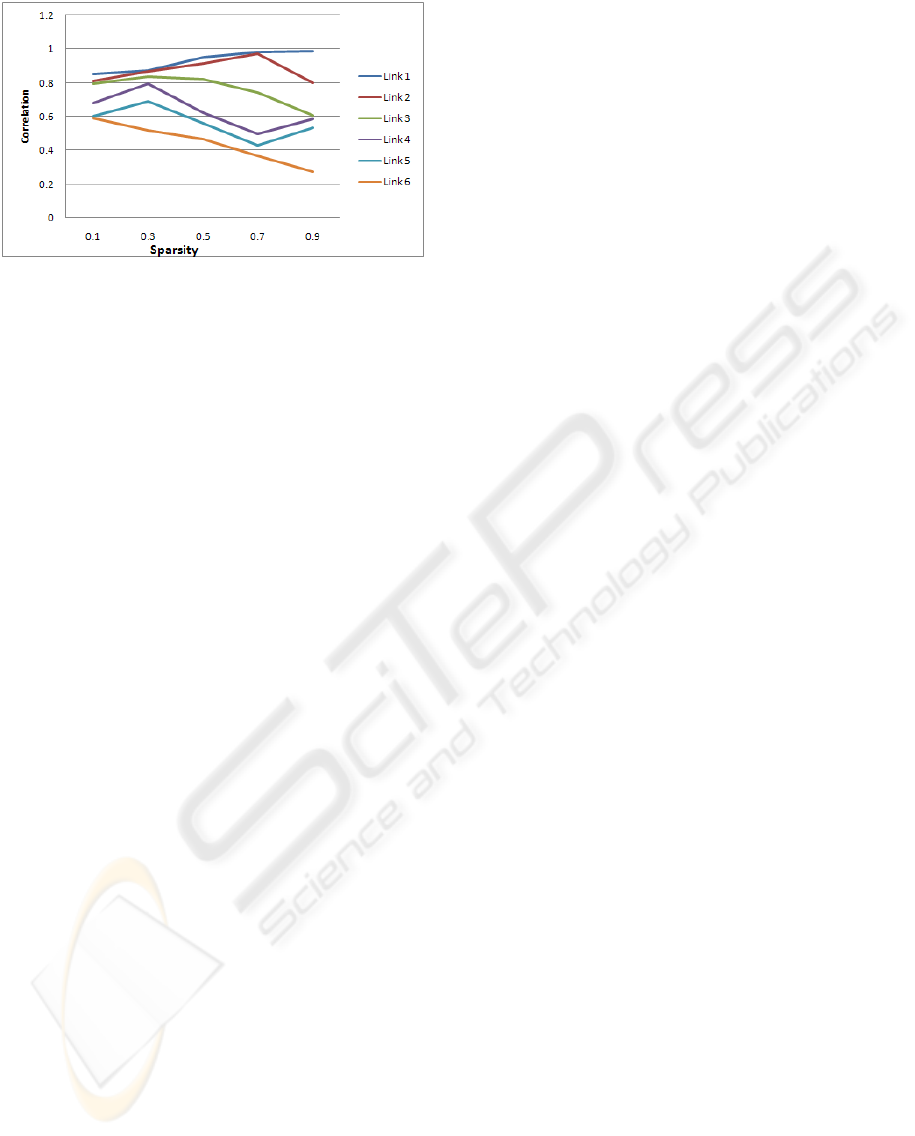
Figure 3: Correlation between H and X with a mixture of
extended pings and N2X traffic.
4.2 Estimation of Link Delay from a
Combination of Path Delays and
RTP Data
In the second part of the simulations, we intend to es-
timate link delays from a combination of path level
delays and PLR data. The correlation between es-
timated and measured link delays will be measured
again and we expect this correlation to be better than
the correlation shown in Figure 3. In the same test
bed, we will inject two types of traffic; CSLA and
RTP. We are in a process of getting a combination of
path level delay and PLR. This data will be used to
recover link level delays by inputting this data to row
wise unfolding of NTF1 model with local strategy
based on alternating minimization of the cost func-
tion.
5 CONCLUSIONS
We introduced a novel concept of multiple metric net-
work tomography in this paper. We estimated link
delays from path delay for the mono-metric network
tomography. The correlation between the estimated
and measured link delays was close to 1 depending on
the sparsity. We are in a process to estimate link de-
lays from two input parameters; path delays and RTP
data. We expect the correlation between the estimated
link delays (by using multimetric) and measured link
delay to be better than using a mono-metric (path de-
lays).
REFERENCES
Bhamidi, S., Rajagopal, R., and Roch, S. (2006). Net-
work delay inference from additive metrics. In Arxiv
preprint math/0604367.
Castro, R., Coates, M., Liang, G., Nowak, R., and Yu, B.
(2004). Network tomography: Recent developments.
In Statistical Science. Volume 9, 499–517.
Cichocki, A., Zdunek, R., Phan, A. H., , and ichi Amari,
S. (2009). Nonnegative Matrix and Tensor Factor-
izations: Applications to Exploratory Multi-way Data
Analysis and Blind Source Separation. Wiley.
Coates, M. and Nowak, R. (2001). Network tomography for
internal delay estimation. In 2001 IEEE International
Conference on Acoustics, Speech, and Signal Process-
ing, Proceedings (ICASSP’01). IEEE.
Hoyer, P. (2004). Non-negative matrix factorization with
sparseness constraints. In The Journal of Machine
Learning Research. MIT Press Cambridge, MA, USA,
Volume 5, 1457-1469.
Moon, S., Kurose, J., Skelly, P., and Towsley, D. (1998).
Correlation of packet delay and loss in the internet. In
Univ. Massachusetts, Amherst, MA, Tech. rep. CMP-
SCI.
Vardi, Y. (1996). Network tomography: Estimating source-
destination traffic intensities from link data. In Jour-
nal of the American Statistical Association. Volume
91, 365–377.
DCNET 2010 - International Conference on Data Communication Networking
84
