
SOFTWARE SUPPORT FOR RICH PICTURES
How to Help OOAD Students Accept Rich Pictures within their Projects Workflow
Andrea Valente and Emanuela Marchetti
Electronic Systems, Esbjerg Insitute of Technology, University of Aalborg, Esbjerg, Denmark
Keywords: Object-oriented Analysis, Rich Pictures, Authoring Tools, e-Learning Software, Information Engineering.
Abstract: Rich pictures (RP) are common in object-oriented analysis and design courses, but students seem to have
problems in integrating them in their projects' workflow. A new software tool is being developed, specific
for RP authoring. To better understand students' issues and working practice with RP, and gather
requirements for the tool, we followed a user-centered design approach and performed a usability test with
an early prototype. The findings suggest the presence of a gap between some of the modern object-oriented
development practices and engineering students' values: some techniques, like RP, presuppose design skills
that are alien to our students. To bridge this gap our tool aims at making design-specific skills optional,
enhancing the conceptual analytical skills that software analysis shares with design. Further studies will be
conducted to assess the impact of the tool on learning.
1 INTRODUCTION
During the past years rich pictures (RP) have
become part of object-oriented analysis and design
(OOAD) (Mathiassen et alt., 2000), and they are
commonly taught in OOAD courses. Their main
purpose is to help analysts understand the problem
situation. In some software engineering
methodologies RP suggest which objects, classes
and functionalities should be included in the initial
prototype of a system; RP also provide a good
opportunity to actively involve customers in the
development. However, we repeatedly noticed that
students in the late semesters of our software and
electronics engineering bachelor, seem to regard rich
pictures as a useless pedagogical exercise or at best
as compulsory project documentation.
Currently RP are drown on paper by hand during
analysis and are typically forgotten in later
development phases. Moreover, since there are no
specific software tools for RP, students often re-
draw them with generic diagram authoring
programs, to attach them in their final project
reports. Hence, all the knowledge that should be
visible in rich pictures about the model of the system
under development, seems to be flattened out and
lost
So we decided to implement a graphic editor that
could transpose the manual practice of rich picture
drawing into software. But since we realized that we
knew little of students' practice and issues with rich
pictures, we adopted a user-centered design
approach. We invited students of the OOAD course
to a usability test with an early prototype of our tool.
We were interested in finding out how they would
respond to a software to draw rich pictures,
individually and as groups. We also wanted to see if
our tool could help to better integrate RP in their
usual project workflow, making more evident the
relevance of rich pictures in pre-analysis (Mayr and
Kopet 1998).
In the following sections we present our tool and
related work (section 2), the usability test we
performed with volunteer students (section 3), and
their relation with rich pictures in general. In section
4 we discuss the results of the test, their implications
for our students and the development of our tool.
Conclusions are drawn in section 5.
2 THE TOOL
2.1 A Rich Pictures Software Tool
According to (Monk and Howard, 1998) a rich
picture provides "a broad, high-grained view of the
problem situation", and it shows structures,
125
Valente A. and Marchetti E. (2010).
SOFTWARE SUPPORT FOR RICH PICTURES - How to Help OOAD Students Accept Rich Pictures within their Projects Workflow.
In Proceedings of the Multi-Conference on Innovative Developments in ICT, pages 125-132
DOI: 10.5220/0002971401250132
Copyright
c
SciTePress
processes and concerns. It is also remarked that
there is no best way to construct a rich picture.
When rich pictures are used for OOA, structures
become visual representations of objects or grouping
of objects, while processes are understood as events,
changing the state of one or more objects
instantaneously (as explained in (Mathiassen et alt.,
2000)). As for concerns, they are often natural
language notes written close to the different objects
in the picture.
To support rich picture creation and maintenance
we decided to implement a software tool: Free
Sketch for Software Engineering (FSSE). FSSE is
based on the criteria defined in (Valente, 2009) for
visual knowledge management programs, but we re-
focused the goal of the tool from knowledge
acquisition in general, to rich pictures for OOA.
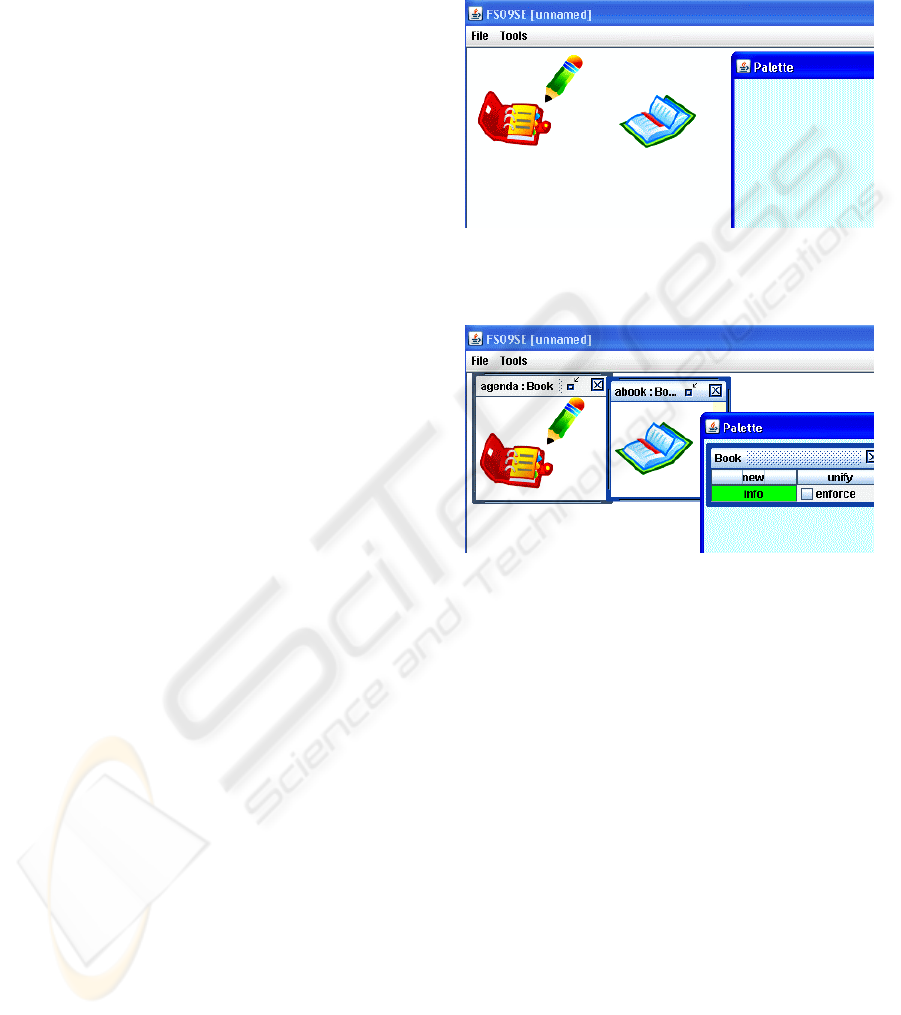
The GUI of our tool is visible in figure 1. It is
composed of 2 windows: the largest one is the main
drawing area, where users draw their rich pictures.
A smaller window, called palette, contains type-
level information about the elements drawn in the
main window.
The typical workflow of a user creating a rich
picture in FSSE would be to create a new FSSE
project, then draw an image in the background of the
main window (via an external painter), or
alternatively import a scanned hand-drawn image.
The image serves as initial draft of the rich picture
(see figure 1).
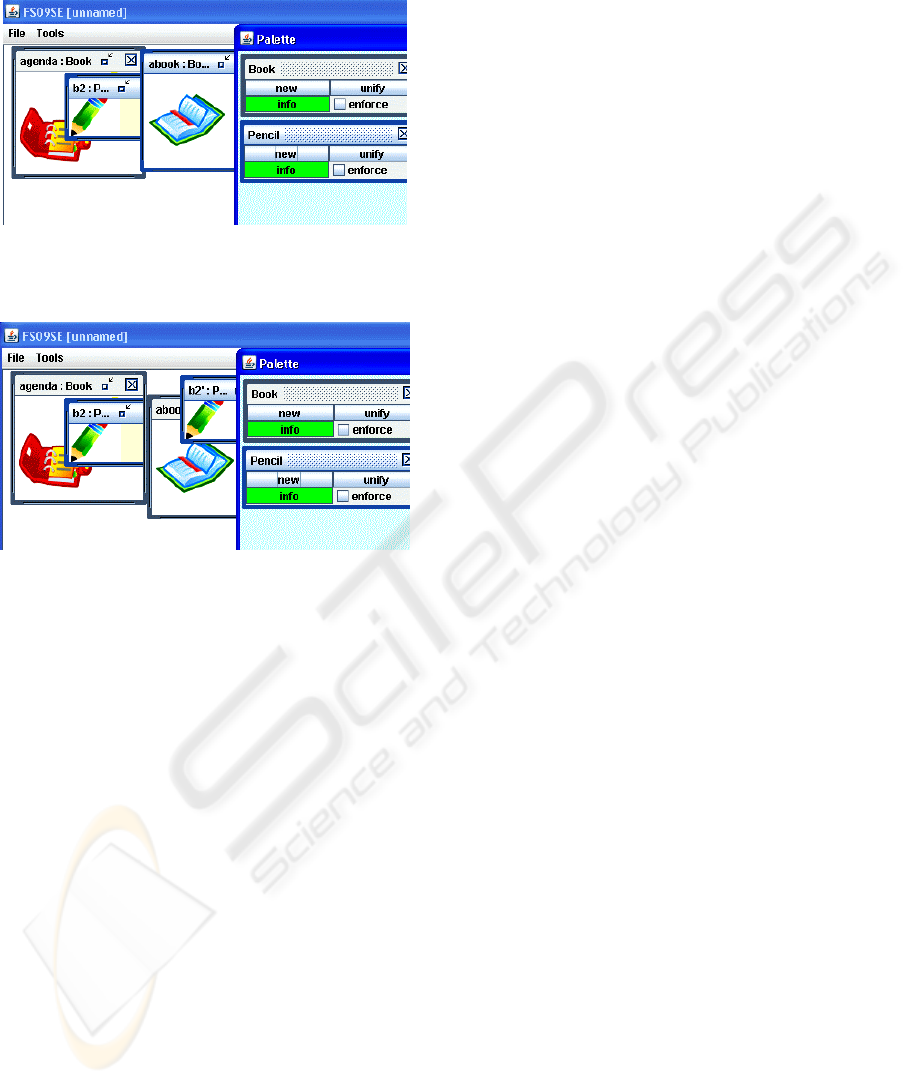
The user will then select rectangles out of the
background image. Each selection turns into a
frame, that the user can move around and clone, as
many times as she likes. Each frame can be assigned
a name and a set of tags. Names do not need to be
unique; tags in FSSE are for clustering, like tags in
blogs. More and more frames will be defined, so that
the initial background image will be reconstructed
by frames. In figure 2 “agenda” and “aBook” are
frames, and both are tagged “Book”. The tag “Book”
is also visible in the palette.
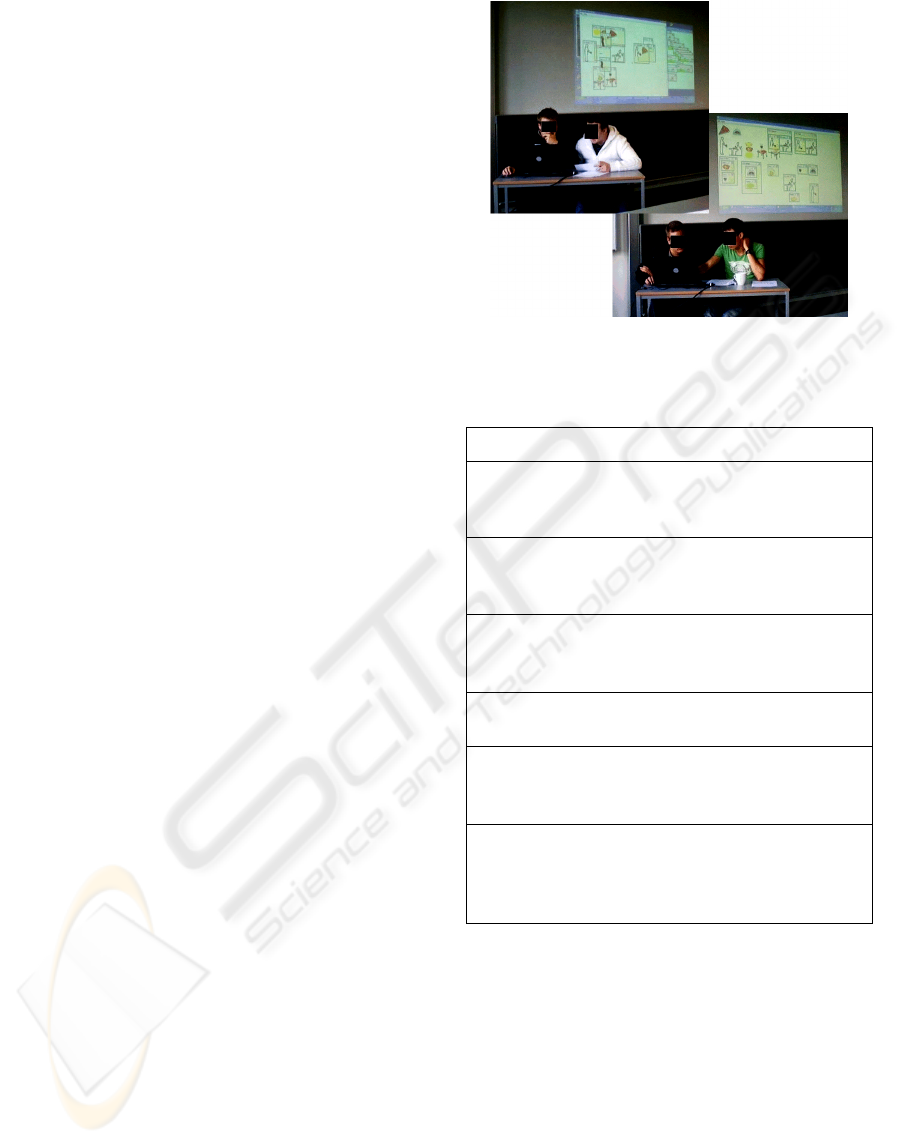
Frames can have internal details: to declare that a
user simply selects a rectangular area inside a frame,
and a new frame will appear, nested in the selected
one. In figure 3 the drawing of the pencil is
converted into an internal frame of the “agenda”.
The pencil-frame is named “b2” and tagged
“Pencil”, and this new tag is also visible in the
palette. In FSSE frames can also be nested via drag-
and-drop.
During the creation of the rich picture, the palette
window is automatically populated, and contains at
any given time a list of all tags used in every frame
of the main windows. Acting on a tag in the palette,
the user can generate new frames, instances of that
tag, or she can obtain information about the
relationships between that tag and others. In figure 4
the “Pencil” tag has been used to create a new
pencil-frame to place close to “aBook”.
Figure 1: The GUI of FSSE. The main window (left)
contains the elements of the rich picture, while the small
window (on the right) is a palette of tags.
Figure 2: Here “agenda” and “aBook” are frames, tagged
“Book”. The tag “Book” is also represented in the palette
(on the right).
Since FSSE keeps track of relationships between
tags, it can find out the typical structure of a “Book”
frame. According to what is depicted in figure 4,
“agenda” is a “Book” and contains a “pencil”, that is
tagged “Pencil”. However, the frame “aBook” is
also tagged “Book”, but it does not contain any
internal frame. Therefore, FSSE will describe the
“Book”-tag as having an association 0 to 1 with the
“Pencil”-tag.
FSSE does not impose a specific workflow to its
users: for example, the division of the initial
background image into frames can be mixed with
the declaration of the internal structure of the
frames, and with creation of new instances of tags.
Users can even decide not to assign names or
tags to their frames. A nameless and tagless frame
could be used to group other frames. In FSSE in
fact, frames do not correspond exactly to the objects
in an OOA. Frames are more un-structured, and
INNOV 2010 - International Multi-Conference on Innovative Developments in ICT
126
become representations of objects only when users
decide to assign names and tags to them.
Figure 3: The image of the pencil is converted into an
frame named “b2”, then nested into the “agenda” frame.
The tag “Pencil” is also represented in the palette.
Figure 4: The “Pencil” tag is used to create a new “Pencil”
frame, then placed close to “aBook”.
Events are a central feature of rich pictures, but it
was unclear to us how to best support them, before
running the usability test with our students. The
inclusion of support for events in the next version of
FSSE is discussed in section 5. Concerns are
currently not supported, but could be treated as text
bubbles freely placed in the FSSE main window.
FSSE also works as a CASE tool, offering
automatic generation of software prototypes (in
Java). Code generation is only one of the various
forms in which FSSE exports the knowledge
contained in a rich picture (and the type-level
information in its palette); others are for example a
natural language read-out of the rich picture and an
XML transcription.
2.2 Related Work and Requirements
We implemented our RP software in JAVA, and we
took inspiration from concept maps (Dietrich and
Steiner, 2005), text graphs (Nuutila and Torma,
2004) and problem spaces modeling (Valente,
2009).
Concept maps have a very established community, a
clear definition and many good software tools. They
have been used for many decades in fields like
knowledge acquisition, e-learning and knowledge
visualization. A concept map is typically a graph
structure, constructed from labels containing natural
language phrases, and arrows linking labels
together. The focus is on the definition of concepts,
type-like entities, while rich pictures show more
concrete, instantiated examples of a system's state
and dynamics.
Text graphs are an interesting attempt at making
concept maps meaning more precise. However, they
are text-oriented and they offer no clear way to
represent different steps in the evolution of a series
of concepts. While text graphs are not developed
with rich pictures in mind, they suggested a direction
of inquiry: what happens when text is replaced with
pictures, in a text graph?
Both concept maps and text graphs lack support
for explicit temporal information, so it is not
possible to draw inspiration from them when it
comes to events in rich pictures. In FSSE time is
present at two levels: instance- and tag-level.
Instances of tags (i.e. frames) can be directly
manipulated and exist in what can be considered the
run-time of an object-oriented system. Tags on the
other hand are abstractions of instances, and live at
compile time. Altering a tag deeply affects all its
instances, that are living at run-time. When
debugging an object-oriented program for instance,
changing a class and recompiling requires resetting
the instances completely, and starting a fresh run-
time. These 2 views of time are familiar to any
developer and having them both present in FSSE
supports students' intuition about the object-oriented
system they are analyzing with their rich pictures.
However, keeping tags and instances aligned is one
of the biggest challenges in the implementation of
FSSE.
3 TEST WITH AN EARLY
PROTOTYPE
During the past years we realized that students
usually underestimate the importance of rich
pictures and dislike to make them. This is
particularly true for an OOA&D course at the fifth
semester of our software and electronics engineering
bachelor. Rich pictures are part of the OOA
(Mathiassen et alt., 2000), and are required in project
reports. Students seem to regard rich pictures (and
SOFTWARE SUPPORT FOR RICH PICTURES - How to Help OOAD Students Accept Rich Pictures within their Projects
Workflow
127
requirements gathering more in general) as a
pedagogical exercise or as project documentation,
i.e. something that takes time from actual
development, their main concern.
Ironically, requirements gathering is actually the
most difficult task in our project, it slowed down
FSSE development and lead us to consider a user-
centered design approach (Preece, Rogers and
Sharp, 2007). Thus we decided to present an
incomplete prototype to volunteer students from our
course, and run a preliminary usability test. We were
interested in finding out how the students would
respond to a tool like FSSE, if they would have
found it useful, individually and as a group tool, if it
was hard or easy to use, and if it could help to better
integrate rich pictures in their usual project
workflow, clarifying also the relevance of rich
pictures and pre-analysis (Mayr and Kopet 1998).
3.1 Set Up
Organizing the test was quite a challenge, the
students were so little interested in the matter that
only 4 out of 12 students volunteered. Semester
projects are carried out in groups, according to the
problem-based project-oriented way of teaching we
adopt at our institution. The 4 participants were in
fact representative of 2 of the semester groups for
the course.
A professional programmer, who was in contact
with us, participated too, but for practical reason he
was not able to physically join us. Hence, we sent
him the tool, a tutorial with a task to be completed,
and we received his feedback by e-mail.
The test took place into a classroom, where a
laptop running FSSE was available on a desk. The
laptop was connected to a projector that showed the
students' interactions with the program on the wall
behind them, so that we could see and film both
them and their actions (figure 5). We were sitting at
a desk in front of them, taking notes and filming
with the video-camera.
The test was divided into four stages: first the
students were introduced to a 5 minutes video-
tutorial, showing the basic functionalities of FSSE.
Then they were left free for some time to try out the
interface.
Finally they received a task, similar to the one
shown in the tutorial: they had to create a rich
picture about a pizza restaurant, identifying objects,
classes and events. In the restaurant a customer can
order a pizza from the menu talking to the waiter.
Figure 5: Two groups of students modelling the pizza
menu; part of the pizza restaurant test.
Table 1: Test questions.
How did you like the tool? General impressions.
Given your experience with object-oriented modeling,
do you think the tool can facilitate OOAD or no?
What will you change and how?
Do you think that the tool makes OOAD more
understandable or not? What will you change and
how?
How do you think it will be possible to define events in
Free Sketch, within the current user’s interface, and
how could it work?
Do you think you would like in future to use a tool like
this in your work or not? Why?
How do you think the tool supported workflow within
your team? Did it facilitate team work or made it
more complex? How could the tool be improved?
Other comments? What other changes will you
suggest to make the tool more effective in supporting
OOAD in software development or its understanding
from a student’s perspective?
The pizzas are baked in the oven and can be served
with beverages. Customers pay their bills to the
waiter, and conflicts may emerge regarding the
orders.
The proposed task was a typical OOA problem, as
the ones they already faced in their semester project,
and was inspired by a use case in (Valente, 2009).
Part of the task was to define events within the rich
picture.
INNOV 2010 - International Multi-Conference on Innovative Developments in ICT
128
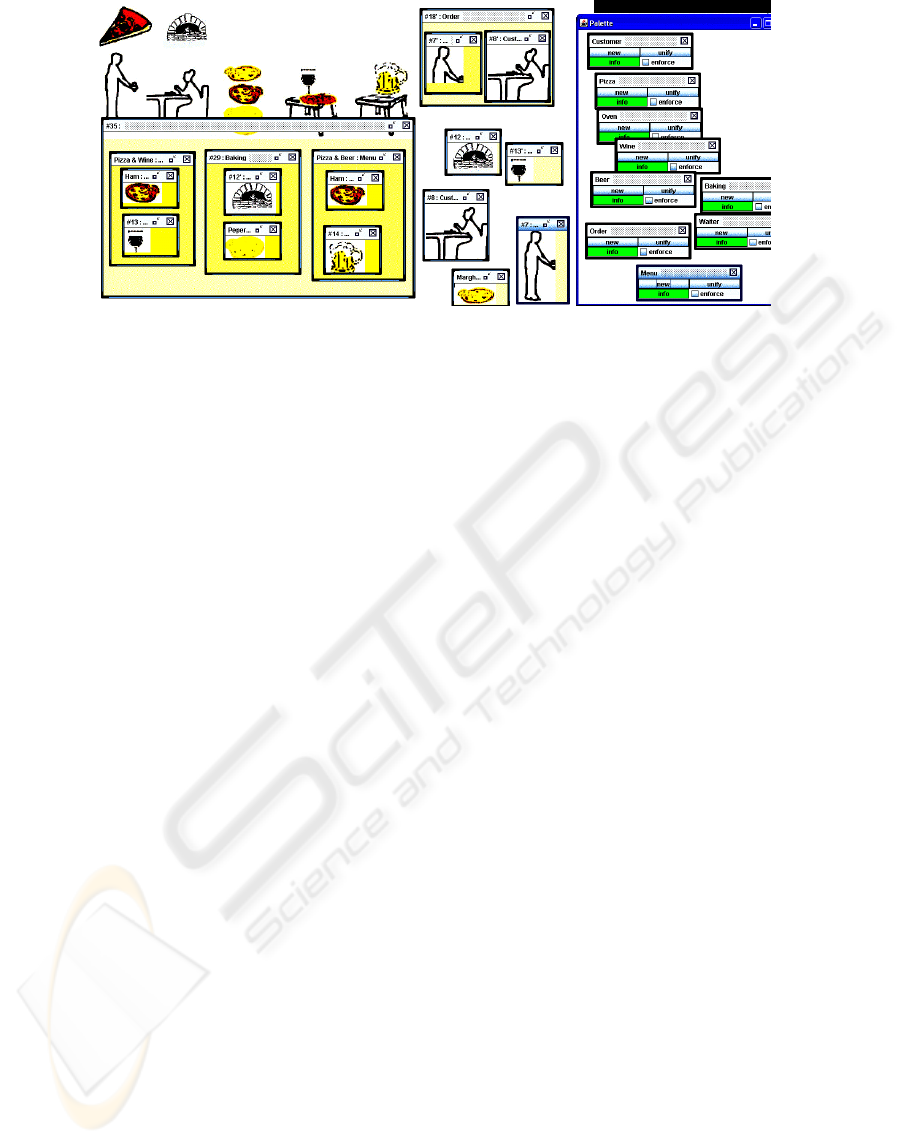
Figure 6: The rich picture for the pizza restaurant test, created by group 2.
However, support for events was not available in the
FSSE prototype; hence, we asked the students to
solve an impossible task, according to the
pedagogical pattern called Kobayashi Maru or
Mission Impossible (Sharp, Manns, and Eckstein,
2003). Our aim was to find out how students may
express events in FSSE and take inspiration to
develop further the tool.
After they finished with the task (see figure 6),
we asked the students a few open questions about
their impressions and possible suggestions for
improvement, referring to a pre-made list (table 1).
However, the list was used mostly as a remainder for
us. We usually started with the first question, asking
about general impressions, then we followed the
students, who often covered more questions at once
or raised new issues. We also asked about their
working habits, if they would like to be supported by
a software tool like FSSE, and what they would
expect from it. Finally we tried to evaluate how
FSSE affected workflow within each team.
Given the students' general indifference about
rich pictures, we preferred interviews than
questionnaires, as we wanted to engage them in an
open and critical discussion, showing that the test
was not just a formality, but that their opinion really
mattered to us.
4 DISCUSSION
The students seemed to respond positively to the
test, as they were precise and reflective in criticizing
the features and the limitations of the tool.
Interaction within the 2 members of each pair
worked smoothly: they discussed together what to
do, in relation to the task and the tool. In both pairs,
one interacted directly with the computer, while the
other checked the task description and pointed often
at the screen while talking.
FSSE was generally appreciated for its
flexibility, since it allows them to work as they like.
Our tool permits users to model from their preferred
level of abstraction, leave parts of the rich pictures
undefined, then come back to finish them. There is
no assumption on the workflow, activities can be
freely mixed. And this is what (Valente, 2009) calls
middle-out modeling.
4.1 Engineers and Hand-drawing
It was very interesting for us to discover that the
students, as well as the professional programmer,
considered hand-drawing as an undesirable activity.
The first two students were visibly uneasy and it
took them a few trials just to draw a menu and
arrows to link the pizzas to it (see figure 5). Since
the test version of FSSE did not support vectorial
arrows, they had to draw both menu and arrows in
the external painter.
A student from the second group said joking:
“Ok, we suck at drawing!”, then they created their
rich picture avoiding drawing. They just re-used the
icons, they initially selected from the given
background image, and nested them in a new frame
called menu (figure 6).
The feedback from the professional programmer
was very similar. He wrote that he was impressed by
the tool but remarked: “I don't want to play with
graphics when I am working, it sucks!”. Even if
FSSE alleviates the drawing burden, it was still too
much for him, so he suggested including support for
vectorial arrows and providing generic libraries of
pre-made icons.
The test opened a new insight about the modern
practice of OOA, which in fact assumes activities
SOFTWARE SUPPORT FOR RICH PICTURES - How to Help OOAD Students Accept Rich Pictures within their Projects
Workflow
129

and skills borrowed from the design domain, such as
drawing on paper, the use of (low-fidelity)
prototypes, or storyboarding. These skills, though
useful, are not taught to engineers nor computer
scientists; moreover, they do not belong to our
students' set of professional values (see discussion
about differences between design and engineering
way of thinking in (Stolterman, 2008)). According
to the students drawing on paper takes time,
breaking the workflow of the group and interfering
with the process of analysis. One of the students told
us that they often have to: "Draw, erase and draw
again" before an icon can be accepted by all the
group-mates and they can proceed with the analysis,
hence: "Just having a [software] tool would help!".
Furthermore, during the task completion, we
noticed that the students were precise in selecting
the icons from the background picture; they even
refined their icons with the external painter, which
was not required by our task. Thus, combining our
observations and their statements, it seems as they
do not like to make graphics but have high standards
about the visual rendering of their rich pictures.
To draw we currently rely on a free external
painter (Java Image Editor, by JH Labs). In future
releases we would like to have internal painting
capabilities. It would help when drawing arrows,
provide a smoother workflow and possibly result in
a more uniform environment to work on rich
pictures.
4.2 Events
The assigned task explicitly required the students to
represent events like “customer pays waiter”. Since
support for events was missing, our students seemed
a little lost at first, but managed to find a creative
way to use the tool for the given task. Interestingly
both groups independently represented an event as a
sequence of scenes in a storyboard, but did not
mentioned it explicitly, as it is not traditionally part
of developers' skills However, they interpreted
differently the connections and internal structures of
scenes, keeping the same approach they used in the
representation of complex objects, like the menu of
the restaurant. The first group clustered a few
frames in an empty area and connected them with
arrows (figure 5), the second group instead nested
the frames into a new one (figure 6).
A particular workflow emerged during the test: a
user would create some frames, give them names
and tags, and cluster them spatially in an empty area
of the rich picture. Later the user will proceed to
create new frames by cloning the ones in the cluster.
Effectively the cluster was used as an extension to
the FSSE palette: instead of just having tags in the
palette, the user wanted to add reusable frames in it.
Each of these reusable frames can be referred to as
prototype of its own tag, i.e. a typical representative
of the tag. Interestingly all the students
independently adopted this prototype clustering
approach, especially when trying to cope with
events. In the next version of FSSE the prototype
clustering will be promoted to a full-fledged feature,
in the form of an extended palette. This new palette
will have an area to store prototypes for each tag.
Furthermore, our testers asked to have vectorial
labeled arrows in FSSE, to connect frames (e.g. the
menus and the pizzas). While implementing arrows
between frames, we realized that it made sense also
to draw arrows between prototypes (inside the
palette). An arrow connecting two prototypes will
simply represent an event changing the first
prototype into the second. For example, the tag
“Pizza” could contain 2 prototypes: “rawPizza” and
“cookedPizza”, with different icons and possibly
different nested frames. An arrow with label “bake”
could link the first and the second prototype. A
FSSE user could then instantiate a Pizza, and get a
new frame, cloned from the “rawPizza” prototype;
applying the “bake” event, that new frame would
change into a clone of “cookedPizza”.
The use of labeled arrows to define events is also
consistent with previous knowledge that our students
typically have about UML state chart diagrams.
4.3 Use of Names and Tags
The distinction between names and tags, and how to
assign them to a new frame, did not seem clear to
students and was criticized. Their perplexity was
visible through the discussions they had, to decide
how to use coherently the two labels. After a while
they all understood that tags correspond more or less
to types and names are just identifiers, that help in
reading aloud a rich picture, in once natural
language. One of the students was eager to solve this
ambiguity and said: “If it is a type, why do not just
call it type?!”. However, tags are not exactly types,
since they are less structured to better support
incomplete and incremental modeling (also called
middle-out modeling in (Valente, 2009)).
Finally, another student suggested showing more
clearly the relationship between a tag and its
instances: when a user selects a tag of a frame, all
frames with the same tag could be highlighted,
throughout the rich picture. We are considering to
INNOV 2010 - International Multi-Conference on Innovative Developments in ICT
130

implement this feature already in the next release of
FSSE.
4.4 Cooperative Work
The possibility to introduce collaborative user
interfaces was discussed after the test, in order to
better support team work. In this way our tool's main
window could be turned into a kind of shared
remote desktop, so that a virtual group can work
coherently on a common rich picture. This would
move FSSE one step closer to an e-learning
environment for OOA.
4.5 Integration in Projects Workflow
Rich pictures originate in the design domain and
represent an attempt to include customers in
software analysis practice (Monk and Howard,
1998). This is in line with the growing influence of
soft-systems methods in software engineering.
Rich pictures have a designerly nature
(Stolterman, 2008), therefore there cannot be a step-
by-step procedure to construct one: they are
explorations into problem framing (Stolterman,
2008). In fact when presenting them as a tool for
OOA to the class, we often show examples and
high-level principles.
The lack of a right way to draw rich pictures
typically frustrates engineering students and
programmers. During project supervision, we
provide feedback and sometimes suggest our
students to make their pictures more detailed or to
try and clarify them better. Students seem to argue:
how can a rich picture be wrong, if there are no
precise rules to make it right?
In our experience, UML class diagrams had
similar problems at the time of their initial adoption.
A class diagram was something to draw in order to
document the software architecture of an object-
oriented system. But in the past 10 years (ever since
UML class diagrams are fully integrated in
development environments) students see the point in
using and maintaining them: their role became self-
evident.
Rich pictures are possibly at the stage that UML
class diagrams were 10 years ago: students perceive
them as required but not needed. In most of the
cases they are drawn quickly, with pen and paper,
then used to identify classes and objects of a system,
only to be forgotten during design and
implementation. Rich pictures are then dusted off
and re-drawn with some diagram editor, to be
attached to the report. Since FSSE can generate code
as well as UML diagrams directly from a rich
picture, it should be able to help students re-consider
them, and see rich pictures as a light notation to use
when tinkering with concepts and behaviors in
OOA.
To encourage tinkering, it is important not to
guide the students too much, avoid imposing a
specific way of doing things. This is a challenge for
FSSE, that has to keep as open as possible to
multiple workflows, while still retaining the
possibility of performing automatic consistency
checks or validation needed for instance to generate
meaningful code, in analogy to concept maps
validation (Dietrich and Steiner, 2005). The balance
between automatic support and user freedom is a
common problem for CASE tools as well as for e-
learning environments. This has been remarked
during our tests by one of the students, who told us
that he liked FSSE because “It does not assume that
I'm stupid”.
Tinkering itself is present in both modeling-
programming and in design, and this is why we want
to use it to ease the tension among design,
engineering and programming practices (see
(Stolterman, 2008)).
5 CONCLUSIONS
Students have problems accepting rich pictures in
their working practice. Our test suggest the main
reason is that rich pictures are a designerly activity,
assuming skills that do not belong to engineers and
programmers. More in general there is a gap
between some of the modern object-oriented
development practice and engineering students'
values. For instance, the need for sketching and
tinkering, and the lack of software support relegate
rich pictures to a futile pedagogical exercise, that
merely diverts energies from the actual system
development.
Changing engineering education to turn our
students into designers is not our goal, and it would
not be correct; instead we propose a designerly
software tool to help integrate rich pictures in the
students' project workflow. In our tool we attempt to
make design-specific skills optional, enhancing the
conceptual analytical skills that software analysis
and development share with design.
The preliminary usability test we conducted with
volunteer students also provided us with great
feedback, helped defining requirements and
discovering problems with our tool. We will adopt a
more complete version of the tool in the next
SOFTWARE SUPPORT FOR RICH PICTURES - How to Help OOAD Students Accept Rich Pictures within their Projects
Workflow
131

iteration of the OOAD course, in order to study
further its impact on learning.
REFERENCES
Dietrich, A., Steiner C. M., 2005. Representing Domain
Knowledge by Concept Maps: How to Validate
Them? In proceedings of the 2nd Joint Workshop of
Cognition and Learning Through Media-
Communication for Advanced e-Learning (JWCL),
Tokyo, Japan.
Mathiassen, L., Munk-Madsen, A., Nielsen, P. A., Stage,
J., 2000. Object-Oriented Analysis & Design. Marko
Publishing, ISBN: 87-7751-150-6, 1st edition.
Mayr, H. C., Kop, C., 1998. Conceptual Predesign -
Bridging the Gap between Requirements and
Conceptual Design. In proceedings of the 3rd
international Conference on Requirements
Engineering: Putting Requirements Engineering To
Practice. ICRE. IEEE Computer Society, Washington
DC.
Monk, A., Howard, S., 1998. Methods & tools: the rich
picture: a tool for reasoning about work context.
Interactions, vol. 5, num. 2, pp 21-30.
Nuutila, E., Torma, S., 2004. Text Graphs: Accurate
Concept Mapping with Well-Defined Meaning. In
proceedings of the First International Conference on
Concept Mapping, CMC 2004.
Preece, J., Rogers, Y., Sharp, H., 2007. Interaction
Design. Beyond Human-Computer Interaction. John
Wiley and Sons, New York USA.
Sharp, H., Manns, M. L., Eckstein, J., 2003. Evolving
Pedagogical Patterns: The Work of the Pedagogical
Patterns Project. Computer Science Education, vol. 13,
issue 4, pp. 315-330, 12/2003.
Stolterman, E., 2008. The Nature of Design Practice and
Implications for Interaction Design Research.
International Journal of Design, vol.2, issue 1, pp. 55-
65.
Valente, A., 2009. Visual Middle-Out Modeling of
Problem Spaces, International Conference on
Information, Process, and Knowledge Management,
pp. 43-48.
Yliriksu, S., Buur, J., 2007. Designing with video.
Springer.
INNOV 2010 - International Multi-Conference on Innovative Developments in ICT
132
