
An Algorithmic Scheme for Construction and
Investigation of Parkinson’s Disease Model
?
I. Gurevich
1
, E. Kozina
2
, A. Myagkov
1
, H. Niemann
3
, M. Ugrumov
2
and V. Yashina
1
1
Dorodnicyn Computing Centre of the Russian Academy of Sciences
Vavilov st. 40, 119333 Moscow, Russian Federation
2
Koltzov Institute of Developmental Biology of the Russian Academy of Sciences
Vavilov st. 26, 119334 Moscow, Russian Federation
3
Friedrich-Alexander-University of Erlangen-Nurnberg
Martensstr. 3, Erlangen, 91058, Germany
Abstract. This work continues the development of mathematical tools and infor-
mation technology elements for automated extraction and characterization of ob-
jects in striatum section images. The latter are used to construct a Parkinson dis-
ease model at a preclinical stage. Previously an automatic segmentation method
for extracting of objects from striatum section image was developed. Now it is en-
hanced and extended to a form of an algorithmic scheme. It allows reducing brain
section images to a form appropriate for recognition. Experimental applications
of the developed technique have confirmed its high efficiency and suitability for
automated processing and analysis of brain section images (a 200 times increase
in productivity and a 10 times decrease in the amount of animals and expend-
ables).
1 Introduction
This work is aimed at the development of mathematical tools and information tech-
nology elements for automated extraction and characterization of objects in striatum
section images. The latter are used to construct a Parkinson disease (PD) model at a
preclinical stage. The developed technique can be used to quantitatively estimate (a)
the degeneration of dopaminergic (DA-ergic) axons in the striatum after specific DA-
ergic neurotoxin administration; and (b) the functional condition of DA-ergic axons
remaining after neurotoxin administration. For this task we adapted the standard algo-
rithmic scheme developed previously for automated morphological image analysis of
lymphoid cell nuclei of diseased hemoblasts [3, 4].
?
This work was partially supported by the Russian Foundation for Basic Research Grant No. 09-
07-13595, by the Program of Fundamental Research of the Presidium of the Russian Academy
of Sciences (2010) and by the program ”Participant of Young Scientific-Innovate Tender”
(”U.M.N.I.K.”) of the Foundation for Assistance to Small Innovative Enterprises (state con-
tract Nos. 6956/9009, 6957/9010).
Gurevich I., Kozina E., Myagkov A., Niemann H., Ugrumov M. and Yashina V. (2010).
An Algorithmic Scheme for Construction and Investigation of Parkinson’s Disease Model.
In Proceedings of the Third International Workshop on Image Mining Theory and Applications, pages 105-114
DOI: 10.5220/0002963601050114
Copyright
c
SciTePress

The study and modeling of PD [1] are an extremely topical problem in modern
medicine. It is crucially important to detect the disease as early as possible and to auto-
mate its detection as much as possible. Thus, it is important to provide physicians and
medical researchers with an automated computer system for early disease diagnostics
at a preclinical stage. The creation and investigation of PD models is also important for
the study of brain compensatory mechanisms with the aim of controlling them in the
future.
The development of PD models requires a screening analysis of motor behavior
regulation and dopamine (DA) metabolism in the nigrostriatal system with the use of
various schemes for neurotoxin administration [7, 5]. DA-ergic neurons, which project
axons to the striatum, are a key element in the regulation of motor behavior. Progressive
degeneration of these neurons leads to the development of PD.
Morphological research underlying the construction of preclinical stage PD models
is associated with the processing and analysis of a great amount of experimental data,
such as images of serial brain sections in experimental animals. The study of each
image includes the detection and calculation of quantitative and qualitative features
for hundreds of neurons and thousands of their axons. Consequently, to construct and
study adequate preclinical stage PD models efficiently, it is necessary to automate the
processing and estimating of experimental data. In turn, this requires the development
and study of suitable mathematical techniques and their implementation in the form of
efficient algorithmic schemes and software systems.
Automated medical image-mining is based on the joint use of image processing
techniques and the mathematical theory of image analysis and pattern recognition. The
designed technique is represented as a specialized algorithmic scheme consisting of the
following principal stages, which implement automated extraction of information from
images: (1) preprocessing (image quality enhancement, elimination of irrelevant details
and artifacts, statistical and logical filtering); (2) image analysis (detection of objects,
extraction of their edges; segmentation; the choice and estimation of features describing
the structure and content of images, etc.); (3) construction of object representations; (4)
classification of objects presented in images.
In Section 2, we describe the initial data and the characteristics of a PD model. The
method developed for the automated extraction and analysis of terminals of DA-ergic
axons presented in striatum section images is briefly outlined in Section 3. An analysis
of the method is given in Section 4. The steps in the algorithmic scheme and the results
of its application to the initial data are described in detail in Section 5. The conclusions
and the directions of further research are given in Section 6.
2 Initial Data and PD Model
The initial data were digital images of immunostained sections of various brain areas.
DA-ergic neurons were labeled in serial sections (with a thickness of 20µm) of the sub-
stantia nigra and their fibers (axons) were labeled in striatum sections with a thickness
of 12µm). The initial image resolution is 0.0117µm
2
/pixel
2
.
106
Terminals are small rounded objects with an area varying from 0.6 to 3µm
2
. Ter-
minals can have an oval, round, prolate or irregular shape. In the presented gray-scale
images, the brightness of terminals is lower than the background brightness.
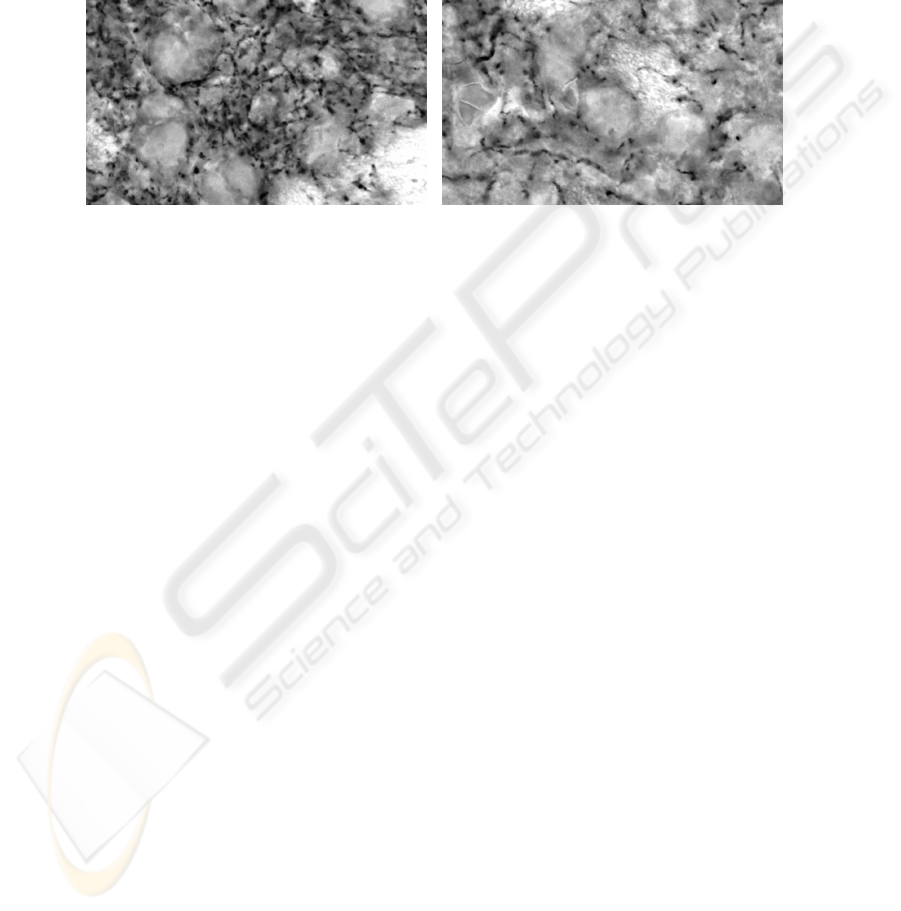
The PD model represents the differences between experimental and control groups.
The former is a group of animals injected with a toxin, while the latter is a group of
animals not affected by the toxin. Typical initial images for the control and experimental
groups are presented in Figs. 1 and 2, respectively.
Fig. 1. Control initial image — a striatum sec-
tion image of an animal not affected by the
toxin.
Fig. 2. Experimental initial image — a stria-
tum section image of an animal injected with
a toxin.
A major characteristic of the PD model is the number of DA-ergic axons innervating
the striatum in the case of using various schemes for neurotoxin administration (dose,
the number of injections, intervals between injections). The extent of degeneration is
defined as the difference between the number of terminals of DA-ergic axons in the
control and experimental groups. DA-ergic neurons and axons remaining after neuro-
toxin administration are supposed to demonstrate increased functional activity in order
to compensate for the DA deficiency. An indicator of the increased functional activity
of neurons and their fibers can be an increase in their sizes. An increase in the concen-
tration of tyrosinehydroxylase (key enzyme in DA synthesis) is supposed to be another
specific indicator of the functional activity of DA-ergic axons and neurons.
The data were presented by the Koltzov Institute of Developmental Biology of the
Russian Academy of Sciences, Moscow, RF.
3 The Algorithmic Scheme
The authors have proposed new original methods for reducing medical images to a form
suitable for recognition [3, 4]. The methods were used as a basis for developing standard
algorithmic schemes for automated images.
The mathematical methods and algorithmic schemes developed were designed for
() automated quantitative estimation of the degree of degeneration of DA-ergic axons
(terminals) in the striatum as based on the difference between the numbers of termi-
nals in the experimental and control groups; and for (b) automated estimation of the
functional condition of distal segments of DA-ergic axons (terminals) in the striatum.
The developed algorithmic scheme consists of the following stages:
107

1. preprocessing:
(a) opening by reconstruction;
(b) the bot-hat transformation by dual reconstruction;
(c) closing by dual reconstruction;
(d) h-dome elimination transformation;
2. image analysis:
(a) object and background markers extraction;
(b) morphological gradient image modification;
(c) watershed segmentation;
3. construction of object representations:
(a) construction of feature descriptions (25 morphometric, densitometric, and tex-
tural features are used);
(b) feature selection;
4. classification:
(a) objects clustering;
(b) results interpretation.
The preprocessing and image analysis stages of the scheme are based on the fol-
lowing mathematical morphology operations: opening [6, 2], grayscale reconstruction
[9], closing [6, 2], the bot-hat transformation [6, 2], morphological gradient [6, 2], and
the watershed transformation [8]. The application of these steps to initial images en-
ables one to smooth heterogeneous complex background, select small objects in images
depending on given sizes and gray values, eliminate out-of-focus objects, and separate
close objects.
A set of informative features is selected at the third stage of the algorithmic scheme.
Interpretation of these features by PD experts can reveal some new patterns in the PD
development.
At the fourth stage, the objects are clustered into several groups. The characteristics
of the clusters are also offered to PD experts for detailed analysis.
4 Accuracy Estimation
The accuracy of the results was evaluated by testing the hypothesis of feature proba-
bility distributions equality. Table 1 presents the feature statistics for manual and au-
tomated object extraction and the results of the two-sample Kolmogorov-Smirnov test.
Inspection of the table suggests that the accuracy of the scheme is comparable with that
of manual features estimation. In addition, the accuracy of terminals selection was esti-
mated by counting the objects correctly found by PD experts. It turned out that 93% of
the terminals were selected correctly.
The initial image with white marked object boundaries extracted by applying the
proposed scheme is presented in Fig. 3. Figure 4 depicts the manually extracted objects
for the same image.
According to PD experts, the proposed technique as applied to automated process-
ing and analysis of brain sections provides a 200 times increase in productivity and a
10 times decrease in the amount of experimental animals and expendables.
108
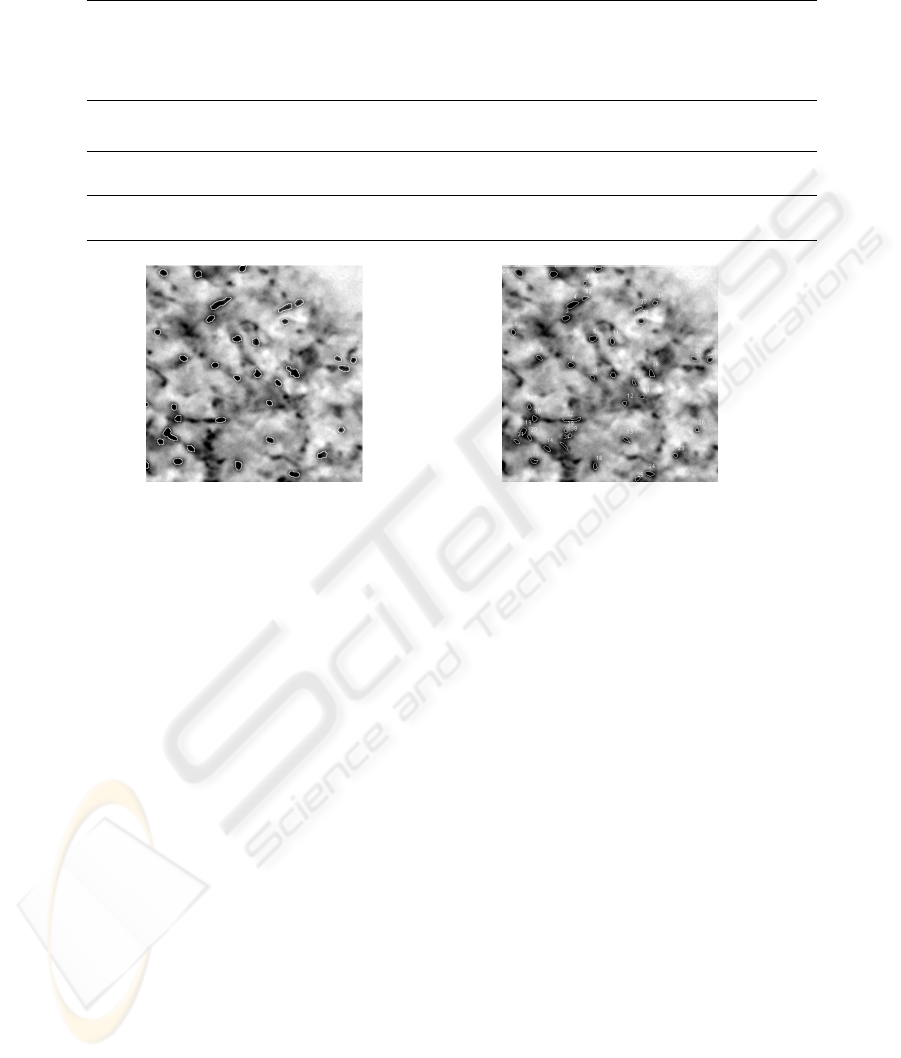
Table 1. Comparison of manual and automated object extraction.
Statistics Object extrac-
tion method
Area (µm
2
) Mean intensity Number of Terminals
Experi-
ment
Control Experi-
ment
Control Experi-
ment
Control
Mean Automated 1.37 1.30 96.23 82.93 15.2 36.4
Manual 1.56 1.52 95.79 83.60 13.6 34.6
Standard Automated 0.69 0.52 9.93 10.77 3.1 3.8
deviation Manual 0.57 0.70 10.99 11.57 3.8 4.0
Null Hypothe-
sis
rejected rejected accepted accepted accepted accepted
Fig. 3. Automated terminal extraction. Fig. 4. Manual terminal extraction.
5 Stage-by-Stage Description of the Algorithmic Scheme
This section describes the results produced by applying the algorithmic scheme to initial
data. Each scheme substep is provided with a brief description.
The steps concerning preprocessing and image analysis are described as follows: (1)
the general characterization of the transformation or algorithm used; (2) mathematical
content; and (3) the role of the given transformation in the solution to the problem under
study.
The following conventional notation is used in the formulas for the transformations:
is the erosion, ⊕ is the dilatation, ρ
I
(J) is the reconstruction of the image I from the
image J , and
∗
is a dual operator.
5.1 Preprocessing
All the substeps at stage 1 are intended to avoid oversegmentation when watershed
transformation is applied to the morphological gradient image.
Substep 1.1 in the scheme is intended to eliminate narrow background peaks from
the initial image. This step is essential for the reduction of background regions con-
taining many local intensity minima, which are used as markers of objects at the next
stage.
109

The transformation at stage 1.1 is as follows: erosion [6] with a flat structuring
element B is applied to the initial image I ; t hen the resulting image is used as a
marker in the reconstruction of the initial image:
I ◦
ρ
B = ρ
I
(I B) . (1)
The structuring element for the erosion is a flat disk with a radius that is larger than
the radius of a disk inscribed in any terminal and is smaller than the radius of a disk
containing any terminal.
The main goal of substep 1.2 is to correct the complex heterogeneous background
of the initial image. The inner structure of terminals remains the same under this trans-
formation.
In the bot-hat transformation by dual reconstruction [6, 2] (stage 1.2), the initial im-
age is subtracted from that obtained by closing the initial image by dual reconstruction:
BotHat
B
ρ
(I) = ρ
∗
I
(I ⊕ B) − I . (2)
This transformation is used to eliminate the complex heterogeneous background
from images of objects whose brightness values are less than the background bright-
ness. The essence of the transformation is that, with a proper choice of the structuring
element (such that each object is contained entirely in the structuring element), nar-
row areas of higher brightness can be marked without marking wide areas of higher
brightness, which gives a good approximation of the background. The subtraction of
the initial image from the ”closed” one yields a more homogeneous background. The
dual reconstruction is used to preserve the brightness values inside objects that are not
completely smoothed by dilatation.
Substep 1.3 is used to smooth nonuniform regions in the interior of the terminals.
This substep is essential for providing robust marking of the terminals. The transforma-
tion used at this stage is as follows: dilatation [6] with a flat structuring element B is
applied to the initial image I ; then the resulting image is used as a marker in the dual
reconstruction of the initial image:
I •
ρ
B = ρ
∗
I
(I ⊕ B) . (3)
In the general case, closing by dual reconstruction [6, 2] is used to eliminate narrow
areas of higher brightness while preserving the average grayscale background and wide
areas of changing brightness. The concepts of narrowness and wideness depend on B.
In contrast to the usual closing procedure, the erosion of the dilated image with the
same structuring element only partially reconstructs the brightness values of areas that
were not completely smoothed by dilatation.
The aim of substep 1.4 is to eliminate out-of-focus objects. H-dome elimination
corresponds to the removal of out-of-focus objects.
Reconstruction [9, 6, 2] is a highly effective method for extracting regional maxima
and minima [9] from grayscale images. Moreover, this technique can be extended to
structures known as h-maxima and h-minima.
According to [9], the binary image (mask) (mask) M(I) of the regional maxima of
I is given by the formula
M(I) = I − ρ
I
(I − 1) . (4)
110

The h-maximum transformation D
h
(I) is defined as:
D
h
(I) = I − ρ
I
(I − h) . (5)
In contrast to the top-hat transformation, the h-maximum transformation extracts
light structures without taking into account their shapes and sizes. The only parameter
h is related to the height of these structures.
A technique for h-parameter estimation was offered for automation of the segmen-
tation procedure. It proceeds on the idea of the selected regional minima clustering into
two groups and setting h to be equal to a threshold value.
5.2 Image Analysis
A substantial drawback of the watershed algorithm is oversegmentation, which is caused
by the noise or other local irregularities in the gradient image. A highly effective way of
reducing oversegmentation is based on the idea of markers [8]. We distinguish between
objects (inner markers) and background (outer) markers. Markers are used for the gra-
dient image transformation. When the watershed segmentation algorithm is applied to
the modified gradient, only marked objects are selected.
Object markers are extracted as regional minima of the image obtained at the pre-
vious stage. Background markers are estimated from the image obtained by applying
the distance transformation [2] to the binary image of object markers. In this trans-
formation, each image point is assigned a value equal to the distance to the nearest
non-background pixel. Next, the watershed segmentation procedure [2, 8] is applied to
the resulting image. As a result, the watershed lines are associated with pixels lying at
the maximum distance from the nearest inner markers.
The morphological gradient is the image subject to dilatation minus the same image
subject to erosion:
G(p, q) = (I ⊕ B)(p, q) − (I B)(p, q) . (6)
At stage 2.2, the gradient image G is transformed by grayscale reconstruction into
an image G
0
[9] such that the local minima of G
0
coincide with the markers, while the
line watershed lines separating the markers are fixed.
Let G be the gradient image, M — be the binary image of markers, and m be the
maximum brightness value of G then
G
0
= ρ
∗
min(G+1,(m+1)M)
((m + 1)M) . (7)
In this transformation, the pixels marked as markers are assigned a value of 0, while
the unmarked areas are filled.
5.3 Construction of Object Representations
The following features (Table 2) were used to describe terminals at stage 3.1 of the
scheme:
111

Table 2. Features.
Morphometric Densitometric Textural
geometric features:
– perimeter,
– area,
– elongation;
invariant-moments:
– first two moments;
intensity features of different
image zones:
– optical density,
– standard deviation,
– excess;
invariant-moments:
– first seven moments;
intensity features of different
image zones:
– homogeneity,
– smoothness,
– entropy;
Fourier energy spectrum fea-
tures:
– mean,
– peak,
– dispersion,
– difference between mean
and maximum values
along radius, depending
on angle;
At stage 3.2 a successive algorithm for feature selection was used to find the most
discriminate features when the terminals are classified into experiment and control
groups. Fisher discriminant analysis was used for classification. The following features
were selected as the most informative: the optical density, elongation, entropy, the first
and third intensity distribution invariant-moments, and the dispersion of the Fourier en-
ergy spectrum along the circle centered at the centre of gravity of a terminal. Due to the
feature selection algorithm, the accuracy of classification was increased from 67% to
74%.
5.4 Classification
At this stage of the algorithmic scheme, the terminals were clustered into 2 and 5 well-
separated groups by applying different modern clustering techniques. Each cluster was
provided with a statistical description including the probabilities of clustered objects
belonging to a specified group (according to the animal type, brain area, section depth).
5.5 Software Implementation
The method developed has been implemented in a software code and is used for auto-
mated feeding and study of PD models.
The software implementation of the algorithmic scheme has the following features:
(1) automated segmentation of brain section images of terminals; (2) the extraction of
morphometric features (perimeter, area, elongation); (3) the extraction of densitometric
features (statistics of the optical density distribution); (4) a database for storing the re-
sults; (5) processing of images separated into specified groups; (6) automated grouping
of initial images by different methods (all pairs of experimental animals, various brain
112

domains (dorsal and ventral), in the direction of sections); (7) the calculation of statis-
tics (expectation, standard deviation, standard error) and testing hypotheses concerning
the distribution differences between the experimental and control groups for a given set
of images (Student’s t-test: statistics, significance level, accepted hypothesis).
The experimental results have shown that (1) the number of terminals of DA-ergic
axons in the experimental group decreases considerably as compared with that in the
control group; (2) the functional activity of DA-ergic terminals changes after neurotoxin
administration. The results are an important step in the estimation of the nigrostriatal
system in the PD brain. They can be used in the study of brain compensatory mecha-
nisms with the aim of controlling them in the future.
In addition to the problem under study, the method was used to analyze arcuate
nucleus sections with DA-ergic terminals in mice after neurotoxin administration. The
number of processed images was about 2000. As a result, data were obtained concerning
the effect of neurotoxin administration on the tuberinfundibular system in mice, which
is the first attempt to estimate the functional condition of this system.
6 Conclusions
We proposed a new method and a standardized algorithmic scheme for reducing brain
section images to a form appropriate for recognition. The scheme was used as a basis
for a software implementation of the method developed. It is currently being employed
to estimate the degeneration and changes in the functional condition of DA-ergic axons
in the striatum at different early stages of PD. The results are an important step in the
estimation of the condition of the dopaminergic nigrostriatal system research at devel-
oping PD. The same methods can also be applied to similar task. In particular, they can
be used to estimate the degeneration of DA-ergic neurons in the substantia nigra after
neurotoxin administration and to estimate the functional conditions of dopaminergic
neurons remaining after neurotoxin administration.
Experimental applications of the developed technique confirmed its high efficiency
and suitability for the automated processing and analysis of brain section images (a 200
times increase in productivity and a 10 times decrease in the amount of animals and
expendables).
References
1. Albin, R.L., Young, A.B., Penney, J.B.: The functional anatomy of basal ganglia disorders.
Trends Neurosci 12, 366–75 (1989)
2. Gonsales, R.C., Woods, R.E.: Digital Image Processing. Pearson Education, Inc, 2 edn.
(2002), publishing as Prentice Hall
3. Gurevich, I., Harazishvili, D., Jernova, I., et al.: Information technology for the morpholog-
ical analysis of the lymphoid cell nuclei. In: The 13th Scandinavian Conference on Image
Analysis. LNCS, vol. 2749, pp. 541–548 (2003)
4. Gurevich, I.B., Yashina, V.V., Koryabkina, I.V., Niemann, H., Salvetti, O.: Descriptive ap-
proach to medical image mining: An algorithmic scheme for analysis of cytological speci-
mens. Pattern Recognition and Image Analysis: Advances in Mathematical Theory and Ap-
plications 18(4), 542–562 (2008)
113

5. Ogawa, N., Mizukawa, K., Hirose, Y., Kajita, S., Ohara, S., Watanabe, Y.: Mptp-induced
parkinsonian model in mice: biochemistry, pharmacology and behavior. Eur Neurol 26 Suppl
1, 16–23 (1987)
6. Soille, P.: Morphological Image Analysis: Principles and Applications. Springer, Berlin
(2004)
7. Tipton, K.F., Singer, T.P.: Advances in our understanding of the mechanisms of the neurotox-
icity of mptp and related compounds. J Neurochem 61, 1191–1206 (1993)
8. Vincent, L., Soille, P.: Watersheds in digital spaces: an efficient algorithm based on immersion
simulations. IEEE Trans. Pattern Anal. Machine Intell. 6(12), 583–598 (June 1991)
9. Vincent, L.: Morphological grayscale reconstruction in image analysis: Applications and effi-
cient algorithms. IEEE Transactions on Image Processing 2, 176–201 (1993)
114
