
GRAPHICAL AUTHENTICATION BASED
ON USER BEHAVIOUR
Ahmed Al-Khazzar and Nick Savage
Electronic and Computer Engineering Dept., University of Portsmouth, Winston Churchill Av., Portsmouth, U.K.
Keywords: Behavioural Authentication, Biometric Authentication, Identification, Access Control,
Graphical Authentication.
Abstract: In this paper the feasibility of having an authentication system based on user’s behaviour is studied. The
approach used is based on psychological mechanisms of authentication which are a subset of a broader class
of biometric mechanisms. This project implemented a 3D graphical maze that a user has to navigate
through. The user is authenticated based on information collected from their behaviour in reaction to the
maze. Results obtained from the experiments revealed that this authentication system has a mean accuracy
of 88.33% in identifying different users from each other.
1 INTRODUCTION
There has been a significant surge in the use of the
biometric systems for user authentication in recent
years. However they have not been a perfect solution
and there are a large number of known attacks
against these systems, (Buthan & Hartel, 2005;
Ratha, Connell, & Bolle, 2001).
Studying possible attacks against current
biometric systems reveals a common characteristic
of such systems that makes spoofing attacks
possible. This common characteristic is the trait
physical accessibility. This is where behavioural
biometrics has an advantage over physiological
biometrics. The behavioural traits of a user are not
physically accessible. Examples of behavioural
biometrics are keystroke dynamics (Bergadano,
Gunetti, & Picardi, 2002), pointing device
interaction (Gamboa & Fred, 2004) and game based
authentication (Yampolskiy & Govindaraju, 2009).
These techniques use user behaviour directly related
to the physical abilities of the human and ignore
higher level intentional behaviours, which may
describe the identity of the person more successfully
(Yampolskiy, 2008).
This paper describes a feasibility study for an
authentication system that authenticates based on
higher level intentional behaviours.
2 BACKGROUND
Behavioural authentication is a subset of biometric
authentication which uses measurable properties of a
person’s actions to identify that person. All
behavioural biometric systems work in a similar
manner: by analysing the current user’s actions, a
model of the individual user behaviour is created
and then this model is used to predict the future user
behaviour.
Although behavioural biometrics are generally
less accurate than physiological biometrics, they
have some advantages: they are more resistive
against the spoofing attacks, and the data gathering
process can be unnoticeable by the user.
2.1 Behavioural Authentication
Behavioural authentication systems based on
keystroke dynamics utilize mechanisms to
authenticate users based on their typing specific
behaviours. Unlike other biometric authentication
mechanisms, keystroke analysis does not provide
acceptable levels of accuracy for authentication
(Bergadano, Gunetti, & Picardi, 2002).
Jin et al. (2008) proposed the application of
fuzzy logic to authentication using typing dynamics.
The manner and rhythm with which a person types
characters on a keyboard have been used to identify
that person. The work reports that an Equal Error
86
Al-Khazzar A. and Savage N. (2010).
GRAPHICAL AUTHENTICATION BASED ON USER BEHAVIOUR.
In Proceedings of the International Conference on Security and Cryptography, pages 86-89
DOI: 10.5220/0002961700860089
Copyright
c
SciTePress
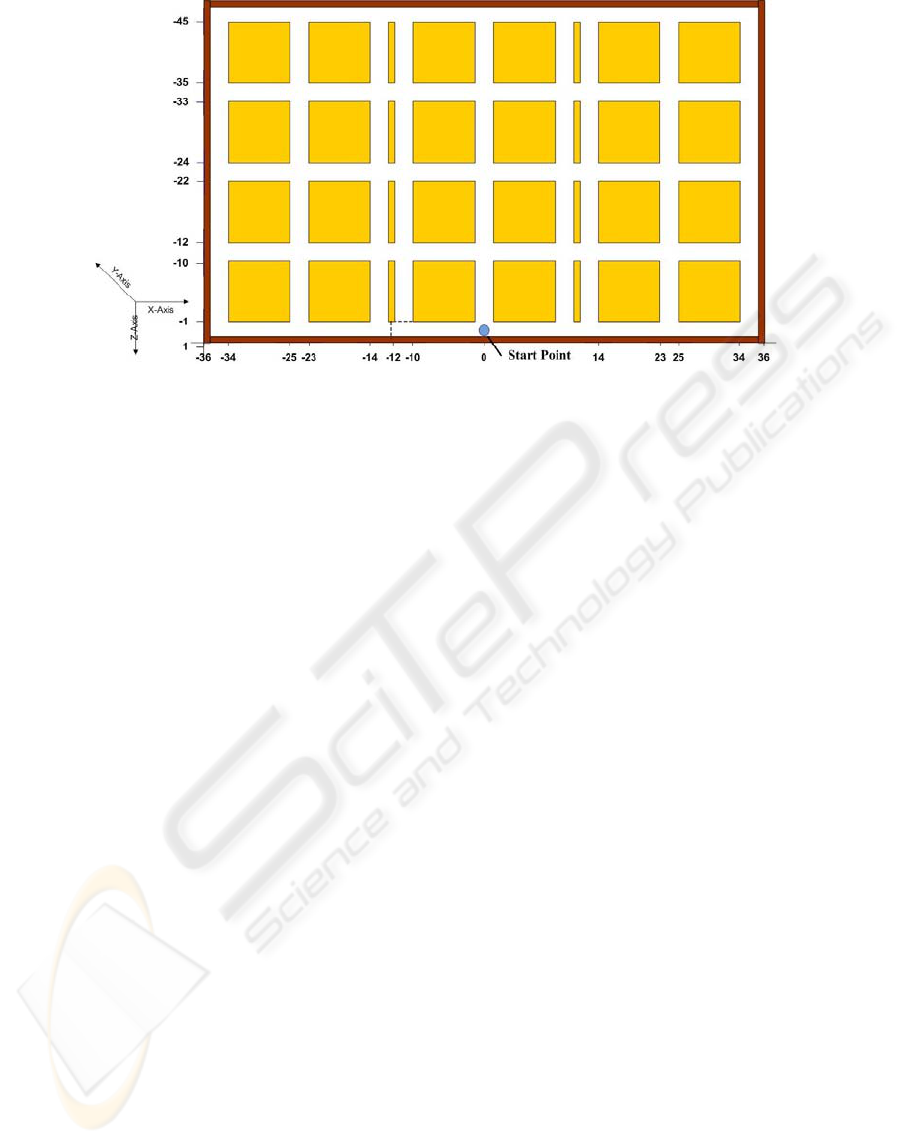
Figure 1: Map of the maze and different sections.
Rate (EER) of 20% could be achieved using this
mechanism. The paper suggested that using this
method can overcome the unavoidable weakness of
extreme data influence in statistical methods.
Gamboa & Fred (2004) proposed a new
behavioural biometric technique based on human
computer interaction. They developed a system that
captures data via a pointing device, and uses this
data to authenticate an individual. An EER of at
least 2% is reported.
3 PROPOSED METHODOLOGY
The first step of this study is to create the 3D
graphical environment. The graphical maze has to be
simple to steer through and large enough to allow
the user to choose different paths. The initial idea is
a simple pattern of vertical and horizontal corridors
as shown in Figure 1.
The user always starts observing the world from
the same starting point (the small circle in the
figure). There is no specified goal for the user to
achieve inside the maze. The requirement is only to
steer through the maze for a specified period of time
visiting any corridor the user prefers.
The user interaction can be extracted in the form
of keystrokes or the turn behaviour of the user. Turn
behaviour refers to decision of the user at the
junctions of vertical and horizontal corridors. The
decision could be a right turn, left turn, continue in
the forward direction (front turn) or turn back and
continue in the opposite direction (back turn).
3.1 Data Acquisition and Analysis
The data acquisition module retrieves the raw data
from the user interface of the 3D maze and converts
it into useful information about the user behaviour.
The input to the data acquisition module is the x and
z coordinates of the current place of the user. The
turn direction parameter is extracted from these
coordinates.
3.2 Behavioural Variables
In this study, three levels of variables are calculated
from the captured data. For each user, the number of
right, left, front, and back turns is calculated. These
four variables are the first level variables. At the
second level consecutive pairs of turn directions are
considered. Examples are the number of turns to the
left then left, left then front, and front then right,
which results in 16 variables. At the third level three
consecutive turn directions are considered for a total
of 64. These three levels of calculations provide the
analyser with 84 behavioural variables that can be
used in the authentication process.
3.3 System Test
After implementing all parts of the 3D
authentication system, it is tested by a group of 5
users. Each user navigates through the 3D maze for
6 periods of 5 minutes. The first three tests are
performed in one session and then the remaining
three tests are done in a second session after 24
hours.
During the test stage some problems were raised.
One problem was that, although much effort was
GRAPHICAL AUTHENTICATION BASED ON USER BEHAVIOUR
87
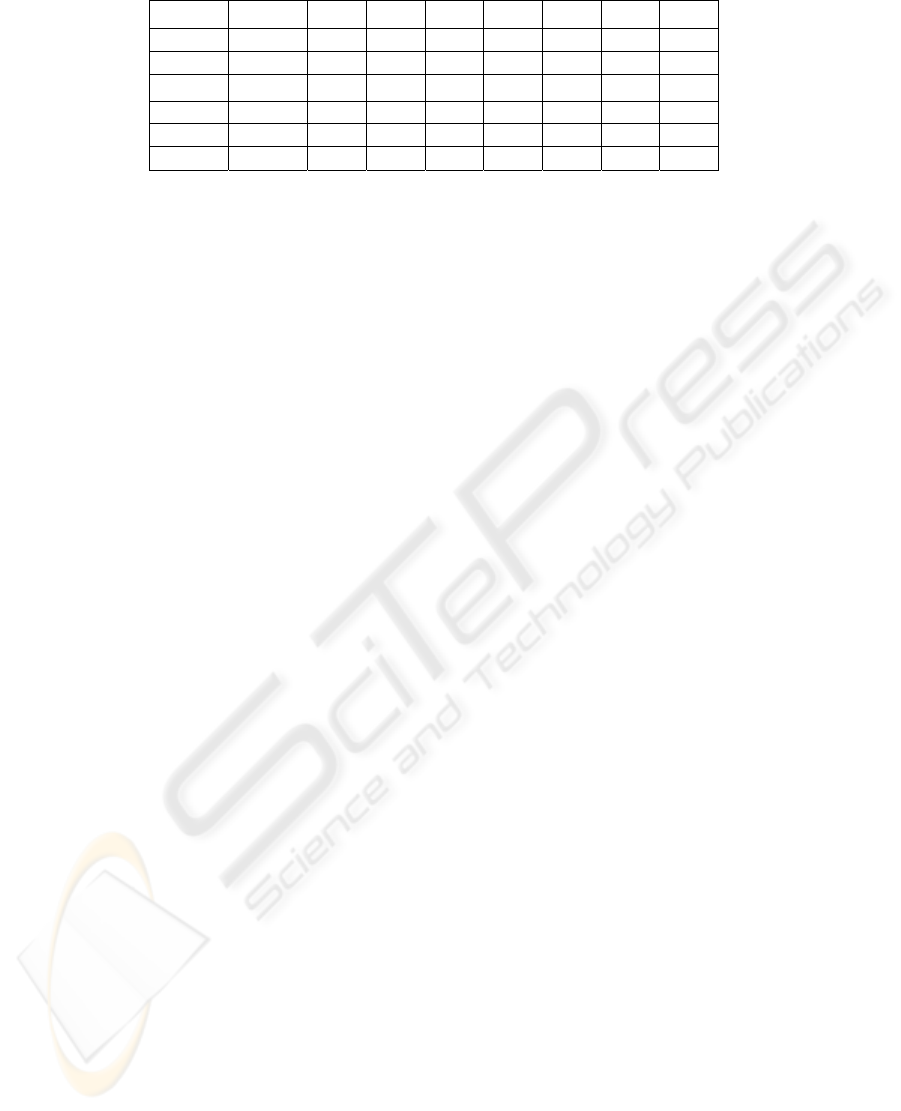
Table 1: True rejection rates for different cases.
Case 1 Case 2 Case 3 Case 4 Case 5 Case 6 Case 7 Case 8
User 1 87.5 95.83 100 100 100 100 100 91.67
User 2 37.5 16.67 66.67 95.83 62.5 91.67 87.5 87.5
User 3 95.83 95.83 66.67 87.5 66.67 95.83 83.33 87.5
User 4 70.83 54.17 75 66.67 79.17 79.17 50 37.5
User 5 25 29.17 79.17 91.67 66.67 70.83 83.33 87.5
Average 63.33 58.33 77.5 88.33 75 87.5 80.83 78.33
made in making the 3D maze visually attractive,
some users did not like the graphical interface and
found it boring. The other disadvantage was the long
time of the test that made the users feel tired.
4 ANALYSIS
As each of the 5 users navigates through the system
6 times, the analysis module is provided with 6 sets
of data from which behavioural variables can be
extracted for each user. This yields 30 sets of
behavioural variables. In the following paragraphs
the word ‘set’ refers to a set of behavioural
variables. Each set contains 84 variables as
described in section 3.2.
For the purpose of analysis, corresponding
variables from different sets can be compared. For a
successful authentication it is expected that the sets
of one user will have more similarities than the sets
of different users. These similarities are in terms of
corresponding behavioural variables. To prove this
similarity, 3 sets are chosen for each user to train the
system. These sets are compared with the remaining
three sets of the same user and all the sets of other 4
users.
To be able to compare the three chosen sets, the
minimum and maximum values of corresponding
variables of these sets are calculated. Then the
variables of the remaining sets are examined to
check whether these variables are in the range of the
calculated maximum and minimum. If a relationship
exists between different sets of the same user, more
variables of these sets will be in the range of
minimum and maximum than the sets of the other
users.
The minimum and maximum values can be
slightly modified to enhance the results of the
comparison. This modification can be an adjusted
increase or decrease of the maximum and minimum
values. As stated in section 3.2 behavioural variables
are classified in to three different levels. These
different levels may carry more or less information
about the user behaviour. To reflect this difference,
the scores can be calculated separately for each level
and added with different weights to form a total
score for the set.
Based on the idea above several parameters of
the analysis can be changed:
1. The three chosen sets that were used to train the
system.
2. The amount of modification made for minimum
and maximum values.
3. Assigning different weights to calculate scores.
These parameters are changed until the best
results are achieved. In this study the data are
analysed 8 times with different parameters. For each
case the maximum score of the three chosen sets is
found and compared with other users’ scores to find
the number of other users’ scores that are smaller
than this maximum. This number is then calculated
as percentage and represents the True Rejection
Rate. As this number increases, the results of this
feasibility study are improved. For each case the
True Rejection Rates (TRR) for users is shown in
Table 1.
Since this work is a feasibility study, the False
Rejection Rate (FRR) is of less interest and is set to
zero (ideal value) by the newly calculated maximum
and minimum value. Another reason to force FRR to
zero is that small number of attempts for each user
(6 times) makes the FRR rates inaccurate. It is well
known that FRR and False Acceptance Rates (FAR)
are dependent measures and increasing one will
decrease the other measure. As a result setting FRR
to zero will increase the FAR which can be
calculated using following formula:
FAR=1-TRR (1)
5 RESULTS
Table 1 shows that the best results are achieved
using case 4. By applying case 4’s method of
analysis to the data an average of 88.33 % of the
attempts to enter as a false user are prevented. All
SECRYPT 2010 - International Conference on Security and Cryptography
88

genuine attempts to enter the system were successful
(FRR=0).
The results of this simple system reveal that the
idea of using a 3D authentication system is feasible
with a False Acceptance Rate of 0.1167 (1-0.8833).
This value is calculated at a zero value for False
Rejection Rate.
It seems that the data recorded in one session was
more related to each other than the data recorded in
the other session. Therefore, the data should be
gathered at different times, as might be expected in a
practical system.
6 RECOMMENDATIONS FOR
FUTURE WORK
Behavioural authentication has the potential to be
introduced as a powerful authentication tool where
variables can be extracted easily. However extensive
research is needed to improve it. This section
provides several recommendations to improve the
system that was studied in this paper.
One of the drawbacks of the system implemented
in this project was the small amount of data
available for the analysis. Gathering more data from
the user behaviour in the 3D environment could
improve the results. Several ways to increase the
amount of data are:
1. Adding more directions (up and down) in y
axis. An example could be adding floors to the
environment.
2. Increasing the test time. This may decrease the
level of system acceptability among users.
Although, ideally, these behavioural metrics
should be extracted without the user’s
knowledge.
3. Defining additional levels of behavioural
analysis.
4. Using keystroke dynamics analysis similar to
one was used in (Bergadano, Gunetti, &
Picardi, 2002).
Another suggestion is to improve the analytical
methods of data analysis. As was shown in the
results section, the analysis method has a great effect
on the results achieved.
7 CONCLUSIONS
The aim of this study was to investigate the
feasibility of having an authentication system based
on user's behaviour. A 3D authentication system was
implemented for the feasibility study. The results of
conducting the tests show an average True Rejection
Rate of 88.33% with an average False Acceptance
Rate of 11.67%. These rates are not perfect but it
shows the possibility of implementing this system.
The findings show that although more studies are
needed, the concept of having a 3D authentication
system is feasible.
ACKNOWLEDGEMENTS
We would like to express our gratitude to the
University of Portsmouth and the Iraqi Ministry of
Communication for allowing this research to be
undertaken.
REFERENCES
Bergadano, F., Gunetti, D., & Picardi, C. (2002). User
authentication through keystroke dynamics. ACM
Trans. Inf. Syst. Secur. , 5 (4), 367-397.
Buthan, I., & Hartel, P. (2005). The state of the art in
abuse of biometrics. Technical Report, Centre for
Telematics and Information Technology, Enschede.
Gamboa, H., & Fred, A. (2004). A Behavioural Biometric
System Based on Human Computer Interaction. Proc.
SPIE - Int. Soc. Opt. Eng. (pp. 381-92). Orlando,
USA: SPIE-Int. Soc. Opt. Eng.
Jin, Z., Teoh, A. B., Thian, S. O., & Tee, C. (2008).
Typing dynamics biometric authentication through
fuzzy logic. Proc. - Int. Symp. Inf. Technol., ITSim
(pp. 1 - 6). Kuala Lumpur, Malaysia: IEEE.
Ratha, N. K., Connell, J. H., & Bolle, R. M. (2001).
Enhancing security and privacy in biometrics-based
authentication systems. IBM Systems Journal , 40 (3),
614-34.
Yampolskiy, R. (2008). Behavioral modeling: an
overview. American Journal of Applied Sciences , 5
(5), 496--503.
Yampolskiy, R., & Govindaraju, V. (2009). Strategy-
based behavioural biometrics: a novel approach to
automated identification. International Journal of
Computer Applications in Technology , 35 (1), 29-41.
GRAPHICAL AUTHENTICATION BASED ON USER BEHAVIOUR
89
