
HAND PROSTHESIS CONTROL
Software Tool for EMG Signal Analysis
Tomasz Suchodolski and Andrzej Wolczowski
Institute of Informatics, Automation and Robotics, Wroclaw University of Technology
Wybrzeze Wyspianskiego 27, 50-370 Wroclaw, Poland
Keywords: Hand Prosthesis, EMG Signals, Decision Tree, Pattern Recognition.
Abstract: The paper discusses the problem of the decision process of controlling the bio-prosthesis of the hand that is
treated as the human intention recognition by means of the analysis of the electromyography (EMG) signals
from the hand muscles. The number of movements, which is indispensable for the dexterity of the
prosthesis, makes the recognition not entirely reliable. The approach presented herein includes three
methods: the decision tree, neuron networks, and genetic algorithms in order to enhance the reliability of the
EMG signal recognition. Simultaneously, the paper presents the software designed for the needs of the
research and adapted to processing the EMG signals in compliance with these methods.
1 INTRODUCTION
The dexterity of the human hand is the result of both
its kinematic structure and the control of it by the
central nervous system. The construction of multi-
joint anthropomorphic mechanic structure that can
copy even very complicated movements of the
human hand poses at present no problem. However,
the question of the reliable bio-control of such a
dexterous prosthesis remains unsolved.
The usual practice is to make use of myopoten-
tials – which are electrical signals that accompany
the activity of the muscles (Wolczowski, 2001). This
is feasible since, after the amputation of the hand,
there remain in the stamp a significant number of the
muscles that earlier controlled the movement of the
fingers (Su Y, et al., 2007; Mohammadreza, 2007).
Through the tensing of these muscles, the person
with a disability may express their intentions to
control their prosthesis as they do with their healthy
hand. The intention recognition calls for efficient
analysis of EMG signals. Taking into account a large
number of possible movements that characterize a
dexterous hand, the chances of error occurrence are
high. The minimization of this error occurrence
constitutes the current challenge in devising the
person-prosthesis interface. The experiments on the
recognition of the movement intended by a person
with an amputated hand can be replaced with the
analysis of the relationship that holds between the
movements of the healthy hand and the myopoten-
tials that occur then, taking into consideration the
limitations that arise due to the lack of some of the
muscles in the amputated hand.
The solution presented here consists in the
decomposition of the recognition, which leads to the
multi-stage process that can be presented as the
decision tree (DT).
In order to reduce the occurrence of recognition
errors irrespective of the number of the processed
data we have opted for replacing the usual decision
nodes with Neural Networks of the multilayer
perceptron (MLP) type (enodes). In order to create
an MLP population, we have made use of the
Genetic Algorithm (GA), which enhanced the
synthesis of optimal MLPs.
For the needs of the research “EMG Analysis”
application has been developed, which allows for the
program transformation of the registered signals. Its
operation is described in detail in subsequent
chapters. Initially the EMG signal in the form of
numerical data is transmitted to the SQL database.
Signal acquisition and the manner in which the
accumulated data are being refined are described in
Chapter two. Chapter three describes methods of
EMG signal analysis; extraction of characteristic
features and concept for signal classification.
Chapter four describes the experiment that has been
carried out and sums up the results.
321
Suchodolski T. and Wolczowski A. (2010).
HAND PROSTHESIS CONTROL - Software Tool for EMG Signal Analysis.
In Proceedings of the 7th International Conference on Informatics in Control, Automation and Robotics, pages 321-326
DOI: 10.5220/0002957403210326
Copyright
c
SciTePress
2 EMG SIGNALS ACQUISITION
In order to classify the EMG signal (or to determine
the class of the intended movement) one has to make
a number of transformations of the obtained signal,
which boils down to its multistage analysis. Each of
the said stages affects the quality of the whole
process that is the reliability of movement
recognition. That is why it is so important for each
of the stages to be optimised as to their reliability
and calculability. Main stages of the process that are
being carried out by "EMG Analysis" application are
presented below.
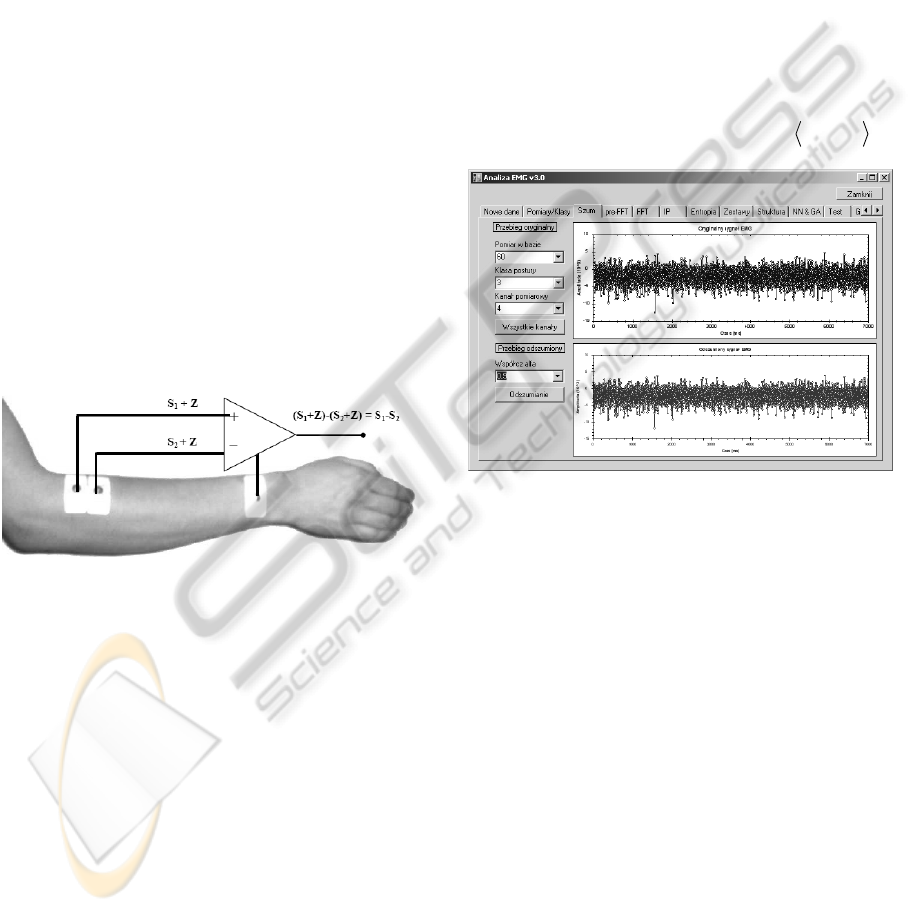
2.1 Signal Acquisition
In order to obtain the data the EMG signal was
measured by means of 8-channel measuring system
(Krysztoforski and Wolczowski, 2005). The system
is made up of: (a) – computer that register the results
of the measurements; it is fitted with (b) - A/D
converters card (Ni 4477); and (c) - 8 active
differential electrodes. The electrodes are fitted with
two metal contacts (De Luca, 2006) that are directly
integrated with the circuit amplifying the measured
signals (potentials difference).
Figure 1: The differential measurement method. The EMG
signal is represented by 's' and the noise signals by 'z'.
That kind of construction makes it possible to
eliminate most of the disturbances that occur during
the measurement. The value of the reduction is
determined by coefficient CMRR of the amplifier. In
this system the coefficient amounts to 84dB.
The signals from the electrodes are transformed
into a digital form that is convenient for further
analysis on the A/D converters card and they are
stored in the SQL database of the measuring
computer. These data are labelled for their further
identification (measurement number, class of
problem – i.e. posture). Data acquisition carried out
in this way enables further program transformations
of the obtained EMG signal by means of consecutive
application modules of “EMG Analysis”.
2.2 Preparing the Data for the Analysis
In order to reduce the level of noise in the obtained
EMG signal, the signal undergoes an initial
processing that consists in averaging of the signal
course in the domain of time, independently of each
channel (1), according to the rule:
]1[)1(][*][
nynxny
(1)
y[n] - current output sample from averaging system;
x[n] - current EMG sample.
The selection window placed in the form shown
in Figure 2 marked as “alpha coefficient” enables
the operator to select a proper degree of the signal
averaging depending on its quality (
0.1,5.0
).
Figure 2: Actual signal (upper part of the figure), the
filtered signal. The alpha parameter equals 0,9.
The signal that has been processed as described
above may be used for identifying characteristic
features i.e. such features that differentiate the
analysed signals one from another (in consequence
the type of the hand movement).
3 EMG SIGNAL ANALYSIS
The process of EMG signal recognition is made up
of two main stages: that of determining the features
of the measured signal and that of signal
classification on the basis of the determined features
(Wolczowski and Suchodolski, 2007).
3.1 Features Extraction
In order to determine characteristic features of the
signal two methods have been applied: Fast Fourier
Transform and Wavelet Transform.
ICINCO 2010 - 7th International Conference on Informatics in Control, Automation and Robotics
322
To carry the task out, the signal amplitude had to
be analysed (Wojtczak, et al., 2008). A low-ampli-
tude signal is difficult to classify due to the partici-
pation of the constant constituent (in the form of
noise) and also due to the fact that the low value of
the signal amplitude may imply both that the muscle
(the hand) is at rest or its insignificant participation
in a given class of movement. The analysis has been
carried out according to the following scheme:
Division of the input data vector that consists of
7.000 samples/channel (7s measurement) into 40
element windows (40 ms), and calculation of the
sum of the contents each window (E
sum
). In this way
the information of the energy of the recorded
movement is obtained; the minimum E
min
and the
maximum E
max
energy values in the set;
Finding out the energy threshold E
edg
(activate-
ing energy) in accordance with rule (2). In this way a
group of windows is singled out that may contain
important information in relation to the signal for the
calculations that are being carried out (level of the
signal amplitude);
The Windows that fulfil the energy condition
E
egd
> E
sum
are then used to single out 256 element-
windows (necessary for the spectrum analysis of the
signal). This is done through the enlargement of the
space of the selected 40-element windows by a
further 216 elements (216 ms).
minmaxmin
* EEkEE
egd
(2)
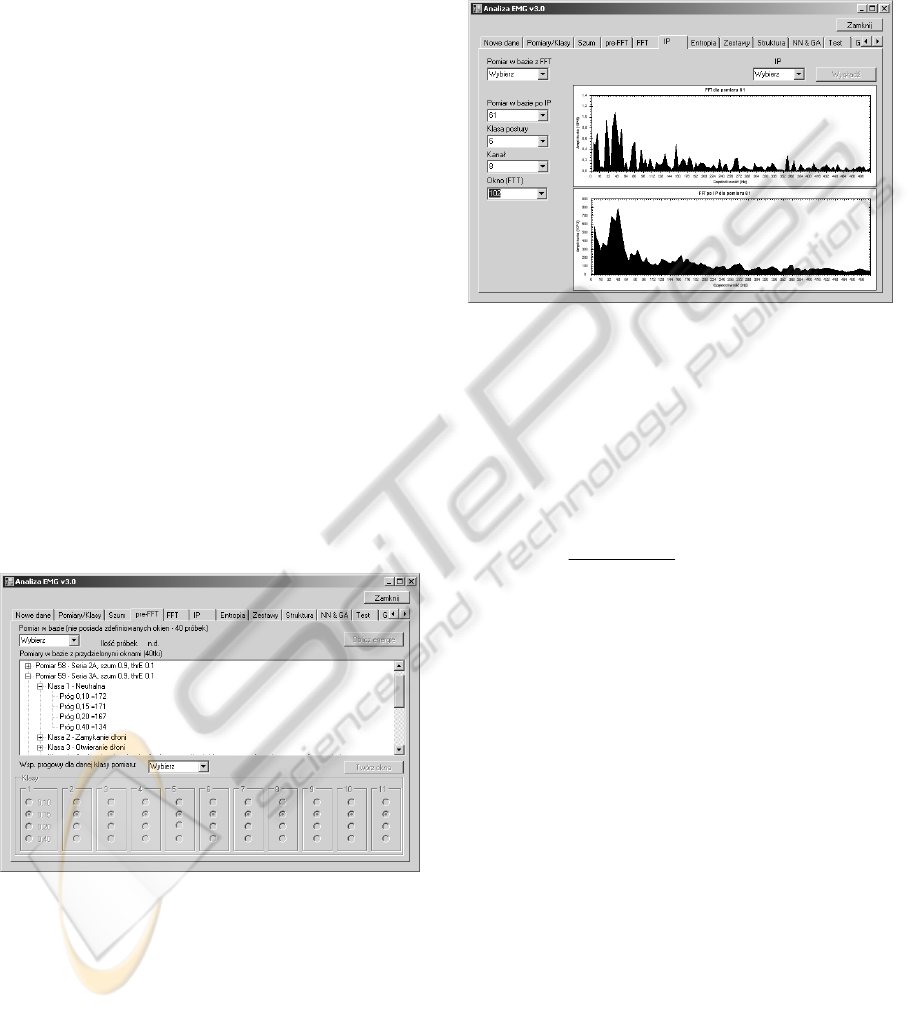
Figure 3: Signal usefulness analysis.
This stage is represented in Figure 3. In order to
optimize this process, the application carries out a
simulation of calculations simultaneously for a few
values of the coefficient k (k(0.1,…0.4)). The
operator can for each movement class select by
means of the checkbox different values of his
coefficient, which affects the number of the newly
created 256-element windows.
The Windows determined in such a manner
become the input vector for the feature extractor. As
a result of the transformations for Fourier Transform
we obtain the representation of the signal in the
frequency domain (Figure 4).
Figure 4: Exemplary FFT course (before and after
averaging).
The spectrum pictures of the signal thus obtained
are further subjected to the process of averaging of
harmonics for the purpose of enhancing the degree
of resemblance (data generalization) according to
(3). The averaged values thus become the vector of
signal features.
,
1
][
][
IPE
IPSi
IPSIPE
iY
kS
1,...,1,0 Nk
(3)
In order to determine the features by means of
Wavelet Transform, Mallat algorithm has been used
(Mallat, 1989), which is used to obtain, among
others, the vector of signal details which, after
transformation is treated as the feature vector. The
signal is filtered in accordance with:
k
mknm
clnc )()(
1
*
2
(4)
k
mknm
chnd )()(
1
*
2
(5)
According to the size of the windows (256
elements) that constitute the input vector that
undergoes transformations, 6 levels of signal
filtration had to be applied; each of the Mallat levels
reduces by half the size of the input vector. Each of
the Mallat levels is represented by number values
that are the sum of absolute magnitudes of the detail
vectors that arose earlier. The number of the features
that thus arose (6 features) is smaller than the
HAND PROSTHESIS CONTROL - Software Tool for EMG Signal Analysis
323
number of the assumed movement classes to be
recognised. Thus a further 6 features had to be
created in order for them to represent the dynamics
of the changes in the recorded movement. This was
done by summing up the real values respectively for
each of the Mallat vectors that arose. In this way it
was possible to obtain 12 values that represent the
information contained in the signal as well as their
approximations at each of the obtained levels of
filtration.
c
m
(n)
l
*
h
*
d
m +1
(n)
2
2
l
*
h
*
d
m +k
(n)
2
2
c
m+1
(n)
c
m+k
(n)
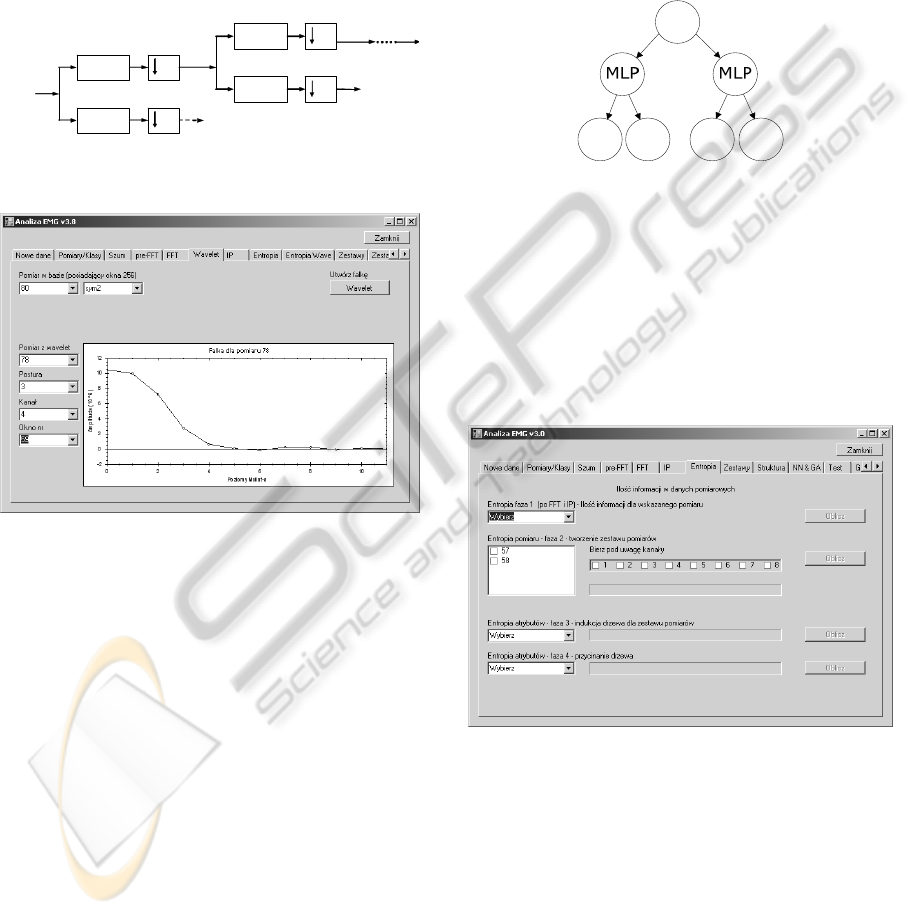
Figure 5: Signal filtration in compliance with Mallat
algorithm.
Figure 6: Exemplary Wavelet form.
3.2 Data Classification
The classification of the feature vector is of great
importance in the presented approach. Due to a large
number of movement classes and high recognition
reliability (which is indispensable for the dexterity
of the prosthesis) the classification process is a
difficult problem. That is why, for convenience’s
sake, the classification process should be performed
in an extensive manner – through many stages. In
the presented research the method of multi-stage
problem solution has been proposed, which is
performed through the decision tree (DT). The
structure of DT calls for: (a) the determination of its
decision logic (structures and the assignment of
classes to the terminal nodes); (b) determination of
the subsets of features for indirect nodes; (c)
determination of the decision making rules
(algorithms of recognition in each indirect node). To
build the DT based on Neural Network Tree
(NNTree) solution (Zhao, 2001) the C4.5 algorithm
was used, the one worked out by Quinlan (1993); it
makes use of the entropy of information in the
learning subset. Entropy in information theory is
defined as the average amount of information that
corresponds to a sign that symbolises an occurrence
out of a certain set. The selection of the attribute is
determined on the basis of the increase of the
information.
Figure 7: Exemplary NNTree.
The input vector that enables tree induction is the
constituents: Fourier Transform (128 size vectors) or
Wavelet Transform (12 size vectors) previously
determined by information entropy of the set.
At this stage (Figure 8) it is possible to determine
the data size that is to be transformed (single
measurement, measurement grouping; specification
of relevant signals).
Figure 8: Entropy tab page.
Quinlan’s method divides a given node into as
many descending nodes, as many values there are in
the most informative feature (constituent of the
selected transform). The tree structure is made by
recurring computation of the information increase
coefficient for all available attributes at each
recurring selection of the algorithm and the selection
of the attribute for which this value is maximal
(constituent of the selected transform). The recurring
selection of the algorithm that makes up the tree
ICINCO 2010 - 7th International Conference on Informatics in Control, Automation and Robotics
324
structure ends the searching process of the input
vector (FFT or DWT feature vector) provided that in
a given sub-tree created by means of the recurring
procedure a set of attributes represents one decision
class. In this case a terminal mode is created that is
marked with class label. The structure thus created
has an input node, a root, and descendant nodes
some of which (terminals) determine the decision
class.
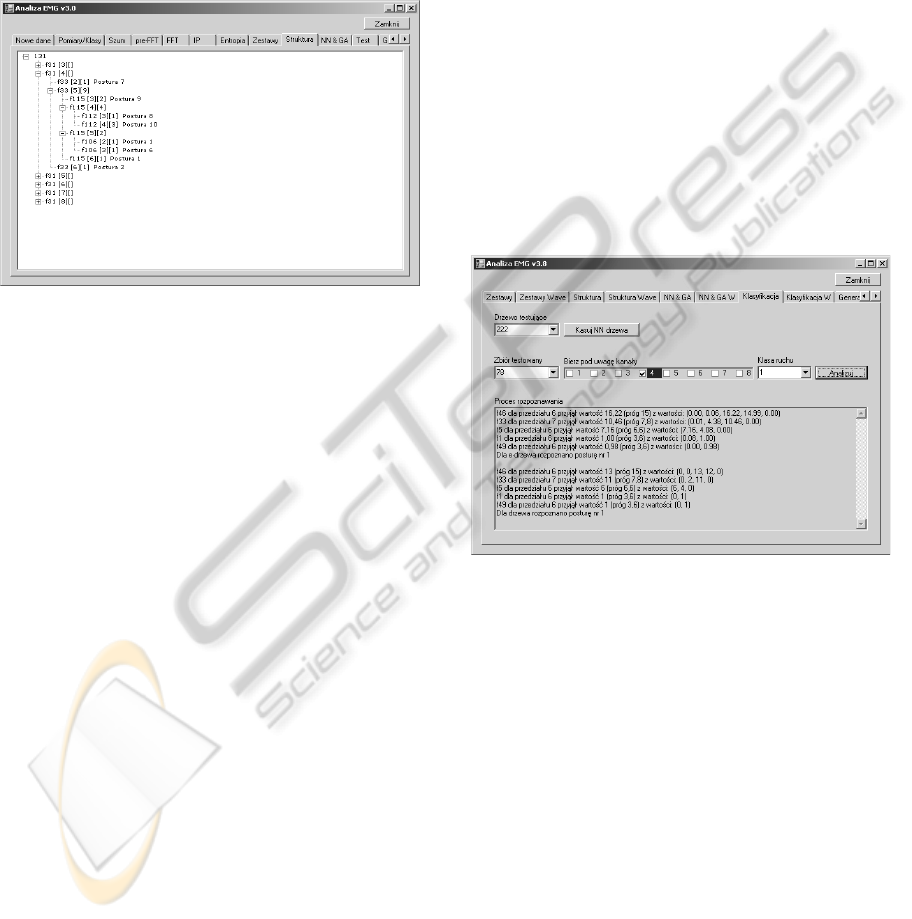
Figure 9: Exemplary decision tree.
To avoid too large a tree (and excessive
matching), the pruning was used on the basis of the
estimation of the significance of the difference of the
classify-cation error for a given node and its sub-
nodes. The algorithm estimates the probability of the
decrease of the error occurrence and cuts off the
divisions for which this probability does not exceed
a given threshold value or provides identical results
(similar results for the sub-nodes). The boundaries
of the ranges that divide the space of the input vector
(FFT or DWT) into the scopes of values that can be
obtained were selected as a result of experiments so
that their distribution was even for the whole span of
the input. However, this method has a drawback;
namely, new feature vectors that are to be classified
can have values that cross the boundaries of two
neighbouring scopes and represent different classes
of hand movement. Therefore, the simple decision
rules that consisted in comparing the new value with
existing scopes were replaced with the decision
making module i.e. MLP. On the basis of actual
values from the database, n networks were trained (n
– number of scopes in the MLP database {m
1
...m
n
}).
Each of them (MLP
1
..MLP
n
) is responsible for the
classification of the value from a given range
(m
1
...m
n
)
.
This solution introduces the genetic
algorithm to create the MLP population that will
allow for solving the problem of range classification.
The process is running until the intended
classification error is obtained (the value falls within
the range) or until the maximum iteration number is
obtained (then the best configuration is returned –
the least obtained error).
After the training process, the configuration and
the weights of best MLP modules are directed to
SQL database where they are assigned to given
value ranges to be further used for classification
process. The process consists in computing the
attributes taken earlier from the input vector (EMG
spectrum) in compliance with the decision scheme
i.e. the tree structure. The decision rules are taken
from the truth table. Additionally, the taken value is
computed by means of relevant MLP
n
module that
simulates a given tree node (Figure 10). Thus we
obtain the classic and neuron tree response. The
activation of one of the descendant nodes brings
about the recurring selection of another rule. The
process is running until the final node (terminal) is
reached. This node determines the decision class i.e.
the type of identified posture.
Figure 10: Classification process of the recorded signal.
4 EXPERIMENT AND OBTAINED
RESULTS
The experiments were carried out on healthy persons
by placing each time 6 electrodes on the skin of the
forearm over relevant muscles.
Eleven movement classes were tested: 1. neutral;
2(3). flexion /extension of the hand digits; 4(5)
pronation and supination of the forearm; 6(7)
flexion / extension of the wrist; 8(9). flexion/
extension of the thumb; 10(11). flexion / extension
of the fingers II-V.
For each class of movement the measurement
lasted 7s and was preceded with a 5s break. In that
way the discreet signals were obtained of the size
7.000 samples * 6 channels) per class (sampling
HAND PROSTHESIS CONTROL - Software Tool for EMG Signal Analysis
325
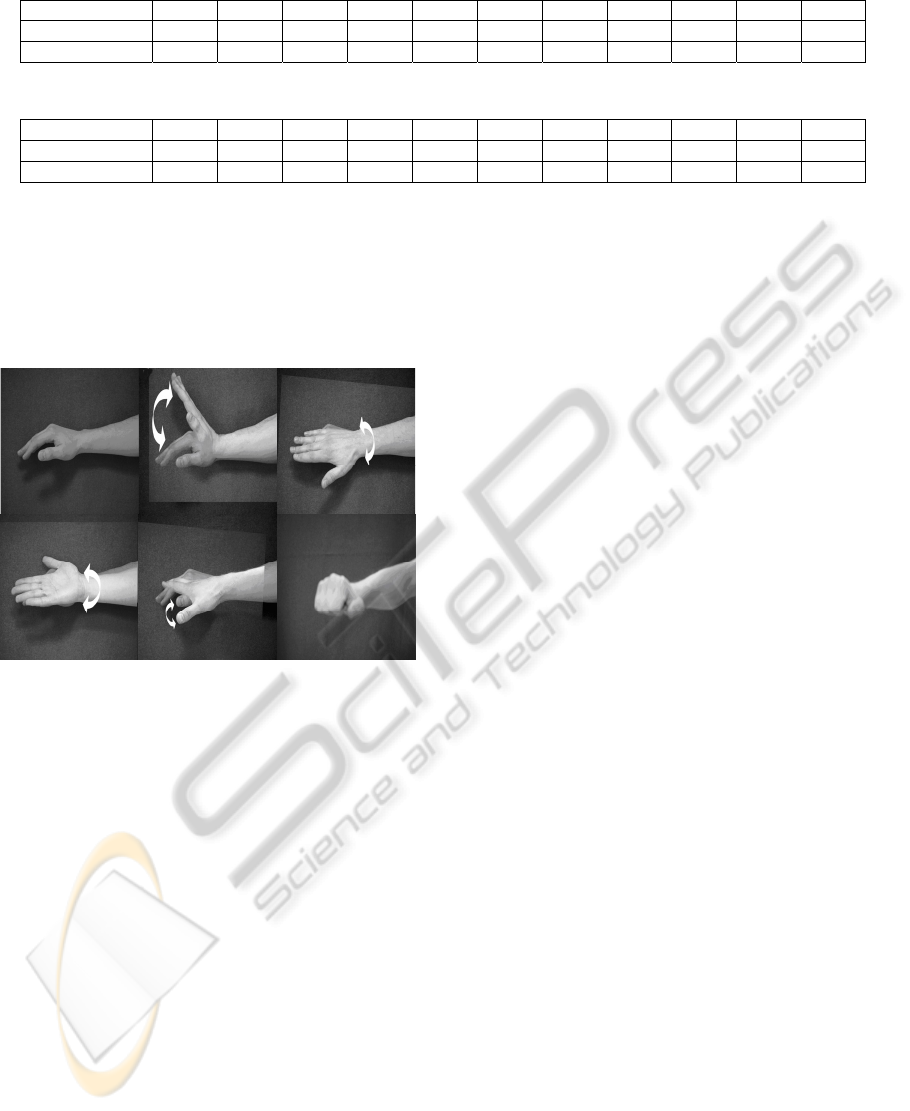
Table 1: Averaged classification errors of the tested movements for FFT input vector (Err
1
-DT, Err
2
-NNTree).
Class 1 2 3 4 5 6 7 8 9 10 11
Err
1
[%] 13 16 14 19 17 12 18 23 19 17 19
Err
2
[%] 9 14 14 17 9 10 13 21 12 11 14
Table 2: Averaged classification errors of the tested movements for DWT input vector (Err
1
-DT, Err
2
-NNTree).
Class 1 2 3 4 5 6 7 8 9 10 11
Err1 [%] 12 14 19 17 12 13 15 18 17 18 15
Err2 [%] 6 11 11 13 13 7 14 16 10 8 8
frequency 1 kHz). The data were located in the SQL
database. The measurement data (1/3 of the signals
selected at random) were used to generate the
decision tree and MLPs. The remaining part of the
set (2/3 of the signals selected at random) was
assigned as a testing set.
Figure 11: Tested movement classes.
The NNTree generated in this way gave an
average recognition value equal to 87% (FFT) when
the DT with classical nodes in turn gave a value
equal to 83% (FFT). The detail results for tested
movements are presented in Table1; were Err1 and
Err2 represent the errors obtained respectively by
DT and by NNTree methods for the FFT feature
vectors. As we can see the best results were for
classes 1, 5, 6 and 10.
In the case of DWT feature vectors an average
recognition values were equal to 89% for NNTree
and 85% for DT method. I this case the best results
were for classes 1, 6, 10 and 11 (see: Table 2).
5 CONCLUSIONS
The tests with the presented “EMG Analysis”
software are in the incipient stage. The conducted
experiments aimed on principle at comparing the
features extraction methods for EMG signals and
their further classification. They prove the
usefulness of the presented multistage analysis
methods for the recognition of the decisions that
control the manipulation and grasping movements of
the artificial hand.
REFERENCES
Wolczowski A., 2001. Smart hand: the concept of sensor
based control. In MMAR’01, 7th IEEE International
Conference on Methods and Models in Automation
and Robotics. Szczecin Univ. of Technol. Publishing.
Su Y., Fisher M. H., Wolczowski A., Bell D. G., Burn D.
J., Gao R. X., 2007. Towards and EMG-controlled
prosthetic hand using a 3-D electromagnetic
positioning system. IEEE Transactions on
Instrumentation and Measurement, (56/1).
Mohammadreza A. O., 2007. Myoelectric control system
– A survey. Biomedical Signal Processing and
Control, vol. 2, issue 4, pp 275-294.
Krysztoforski, K., Wolczowski, A., 2005. Progress of
Robotics - Industrial and medical robotic systems,
A laboratory stand for EMG signal measurements.
WKL. Warszawa.
De Luca, C. J., 2006. Electromyography. Encyclopedia of
Medical Devices and Instrumentation. (John G.
Webster, Ed.) John Wiley Publisher.
Wolczowski, A., Suchodolski T., 2007. Bioprosthesis
Control: Human-Machine Interaction Problem. In
Challenges for Assistive Technology - AAATE 07. IOS
Press.
Wojtczak P., Amaral T. G., Dias O. P., Wolczowski A.,
Kurzynski M., 2008. Hand movement recognition
based on biosignal analysis. Engineering Applications
of Artificial Intelligence, (22/(4/5)).
Mallat, S., 1989. A Theory for Multiresolution Signal
Decomposition, IEEE Trans. Pattern Analysis and
Machine Intelligence, (11).
Zhao, Q. F., 2001. Evolutionary design of neural network
tree – integration of decision tree, neural network and
GA. In IEEE Congress on Evolutionary Computation.
Quinlan, J. R., 1993. C4.5: Programs for Machine
Learning, Morgan Kaufmann. San Mateo, California.
ICINCO 2010 - 7th International Conference on Informatics in Control, Automation and Robotics
326
