
MARKER TRACKS POST-PROCESSING FOR ACCURATE
FIDUCIAL MARKER POSITION ESTIMATION IN CONE BEAM
CT PROJECTION IMAGES
Bogdan Matuszewski
School of Computing Engineering and Physical Sciences, University of Central Lancashire, Preston, U.K.
Tom Marchant
North Western Medical Physics, The Christie NHS Foundation Trust, Manchester, U.K.
Andrzej Skalski
Department of Measurment and Instrumentation, AGH University of Science and Technology, Kraków, Poland
Keywords: Fiducial marker tracking, Cone beam CT, Combinatorial optimisation.
Abstract: This paper describes details of a method for robust and accurate marker position estimation in projection CB
images. The method is based on previously proposed tracking algorithms which can cope with multiple
proximate markers and image clutter. The algorithm described in this paper can be seen as a post processing
algorithm which uses all the calculated hypothetical marker positions, from the tracking algorithm, for all
the markers and all projection images in a single combinatorial optimisation process. The algorithm has
been design to estimate intra fraction motion during image guided radiation therapy. The results from the
algorithm can be used in treatment planning, subsequent treatment monitoring and correction of motion
artefacts in cone beam CT. The proposed post processing algorithm reduced the maximum marker position
error from 5.6 pixels, using tracker alone, to 2.6 pixels after post processing. This should be compared to
estimated 2.5 pixels maximum error present in the ground truth data. For the total number of 3,840 tracked
markers after post processing 1.61% and 0.02% of their positional errors were respectively above three and
six standard deviation of the ground truth, estimated separately for each marker and each projection image,
whereas corresponding results after using tracker alone were 2.86% and 0.23%.
1 INTRODUCTION
Radiation therapy exploits the extra susceptibility of
many cancers to repeated insult by radiation
compared to healthy tissues. The radiation beams are
applied sequentially to a target volume from
different directions in a manner pre-determined by
computerised dosimetric planning. The treatments
are commonly divided into daily fractions delivered
over several weeks. Because of uncertainties,
including tumour motion, a safety margin is added
around the clinical target volume (CTV) leading to a
bigger planning target volume (PTV).
Tumour tracking is an important tool in modern
radiotherapy, as it is instrumental in measurement of
tumour intra fraction motions enabling a variety of
strategies for management of motion in
radiotherapy. More specifically it is important in
solving such tasks as treatment planning, patient
position monitoring, gating, and CBCT volume
reconstruction with motion corrections.
There are a number of techniques being
developed for tumour tracking which avoid
additional ionising radiation delivered to the patient,
including: MV portal image tracking (Keall et al
2004), electromagnetic markers (Willoughby et al
2006), optical surface sensing (Moore and Graham
2000, Hoisak et al 2004). However, the technique
becoming most widely available in clinical practice
is using one or more pairs of kV x-ray tubes and
imagers integrated with the MV x-ray treatment
522
Matuszewski B., Marchant T. and Skalski A. (2010).
MARKER TRACKS POST-PROCESSING FOR ACCURATE FIDUCIAL MARKER POSITION ESTIMATION IN CONE BEAM CT PROJECTION
IMAGES.
In Proceedings of the International Conference on Computer Vision Theor y and Applications, pages 522-529
DOI: 10.5220/0002920005220529
Copyright
c
SciTePress

machine (Balter and Cao 2007). Such devices
provide information about local anatomy in the form
of fluoroscopic images and/or cone beam CT
(CBCT), enabling tracking and measurement of
tumour motion (Shirato et al 1999, Marchant et al
2008, Poulsen et al 2008).
There are essentially two methodologies for
tracking tumours in the kV images. The first is using
directly the image intensity patterns to estimate
tumour mass position without any implanted
markers (Cui et al 2007) but this approach however
is still considered to be under development. The
second methodology tracks one or more implanted
radio-opaque fiducial markers which are treated as a
reliable tumour surrogate. The RTRT (Shirato et al
1999) and IRIS (Berbeco et al 2004) are examples of
the hardware platforms proposed to solve this
problem. Both these systems use multiple pairs of
diagnostic x-ray tubes and imagers to determine the
3D marker position. The RTRT system uses a simple
template matching tracking algorithm to track a
single spherical marker. Tang et al (2007) proposed
a tracking algorithm capable of tracking multiple
cylindrical markers in fluoroscopic images acquired
from a monoscopic system. Their method uses
template matching in conjunction with a prediction
stage and multiple hypotheses to improve robustness
of the tracker in a presence of image clutter. More
recently Matuszewski et al (2010) proposed tracking
algorithm with multi-component score functions to
select the most likely position of the marker from a
set of generated marker position hypotheses. In
comparison to the algorithm proposed in (Tang et al
2007) the method uses: (i) the mean shift algorithm
instead of template matching, which provides higher
accuracy due to explicit sub-pixel accuracy of
marker position estimation and dynamic implicit
estimation of markers appearance (ii) use of random
sampling for hypothesis generation instead of
deterministic evaluation of all possible marker
locations in the predefined size window, enabling
efficient marker search in a much bigger region, and
maintaining track of possibly widely spatially
separated positional hypotheses. Additionally
contrary to the method described in (Tang et al
2007) the method proposed in (Matuszewski et al
2010) can operate even when: (i) average intensity
of the markers changes significantly; (ii) apparent
marker shape changes significantly; (iii) the
breathing pattern changes. The method does not
assume posterior distribution to be Gaussian, indeed
due to image clutter and presence of other proximate
markers the likelihood function could be highly non-
Gaussian – with multiple significant modes.
The method described in this paper can be seen
as an extension of the method proposed in
(Matuszewski et al 2010) where all the marker
position hypothesis are used in a batch processing
mode in a single combinatorial optimisation process.
The batch processing rather than real-time
tracking can be justified for some applications, for
example in CBCT motion correction. The tracking
of fiducial markers in such data is a challenging
problem. There are a number of reasons for this
including: a high level of noise due to scatter and a
low radiation dose delivered during a single CB
projection image acquisition; markers changing
shape and size for different projection angles;
occlusions and clutter caused by possible presence
of the foreign objects; markers overlapping with
each other or being masked by anatomical
structures; significant variations of the marker and
background intensities with projection angle.
Additionally apparent marker displacement in two
consecutive images could be quite significant as it is
a superposition of an intrinsic motion caused, for
example, by respiration and an extrinsic motion
induced by the sensor rotation.
The rest of the paper is organised as follows: in
section 2 the cone beam CT projection images are
introduced, section 3 briefly summarises the
algorithm proposed in (Matuszewski et al 2010),
whereas section 4 describes in details proposed
extensions of the method. The experimental results
are presented in section 5 with conclusions drawn in
section 6.
2 CONE BEAM CT PROJECTION
IMAGES
CB projection images shown in this paper were
acquired using Electra Synergy (XVI 3.5, Elekta,
Crawley, UK). This system has a kV imager fixed to
the rotating gantry, mounted orthogonally to the MV
treatment beam. Projection images were captured
over 360
o
of rotation at a frame rate of 5.5Hz with
640 projections. Projection images were acquired
using a 512x512 matrix with square pixel of size s =
0.8 mm at the detector. The geometrical
configuration of the rotating gantry with kV and MV
sources and kV imager is shown in Figure 1.
Assuming that the position (x,y,z) of a marker in
3D space is fixed its apparent motion in the
projection images as a function of the gantry angle is
given by (Marchant 2008):
MARKER TRACKS POST-PROCESSING FOR ACCURATE FIDUCIAL MARKER POSITION ESTIMATION IN
CONE BEAM CT PROJECTION IMAGES
523
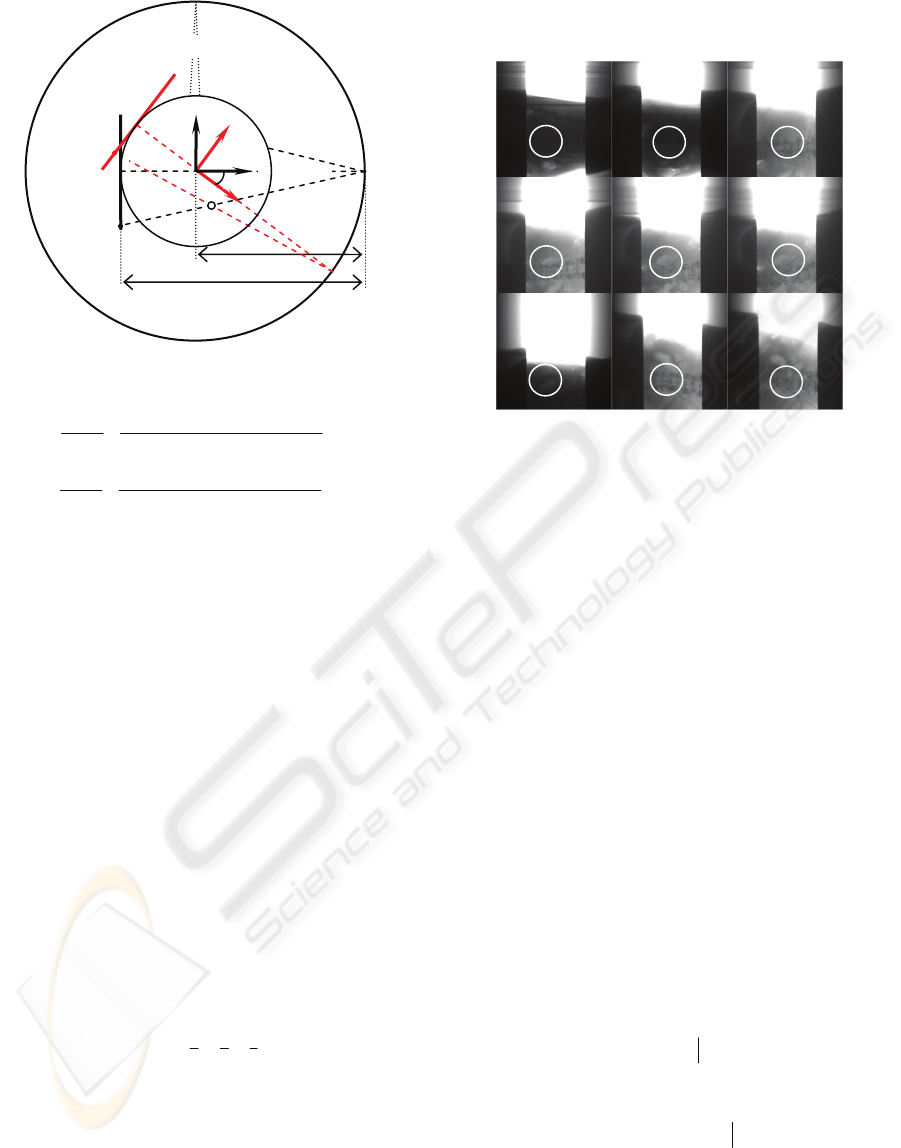
Figure 1: Geometry of the CB imaging system.
()
() ()
() ()()
()
() ()()
v
u
o
yθxθSAD
z
s
SDD
θv
o
yθxθSAD
yθxθ
s
SDD
θu
+
−−
×=
+
−−
+
×=
sincos
sincos
cossin
(1)
Where u(
θ
) and v(
θ
) are respectively row and
column coordinates of the marker in the projection
image acquired at
θ
gantry angle, o
u
and o
v
represent
the position of the principal point in the image
coordinates;
θ
is the known gantry rotation angle,
SDD and SAD are the known distances from the
source to the detector and gantry rotation axis
respectively. The apparent 2D motion of the marker
in the sequence of projection images is a
superposition of the motion induced by the rotating
gantry and the motion due to 3D marker movement.
The apparent marker motion in the projection
images due to the gantry rotation and the actual
marker displacement in 3D space can be separated
by fitting functions u(
θ
) and v(
θ
) given in (1) to the
observed marker positions
(
)
m
k
m
k
uv ,
in the
projection images, with k and m indexes identifying
projection image and marker respectively. This has
been implemented using the Levenberg-Marquardt
method to optimise a nonlinear least squares cost
function. As the result of this procedure for each
marker, m, vector
(
)
mmm
zyx ,,
is estimated
representing its mean position in the 3D space.
The method was tested using projections from
CBCT image of a pancreatic cancer patient. The
patient had six gold seeds (fiducial markers) each
size of 1mm × 10mm placed into the pancreas at
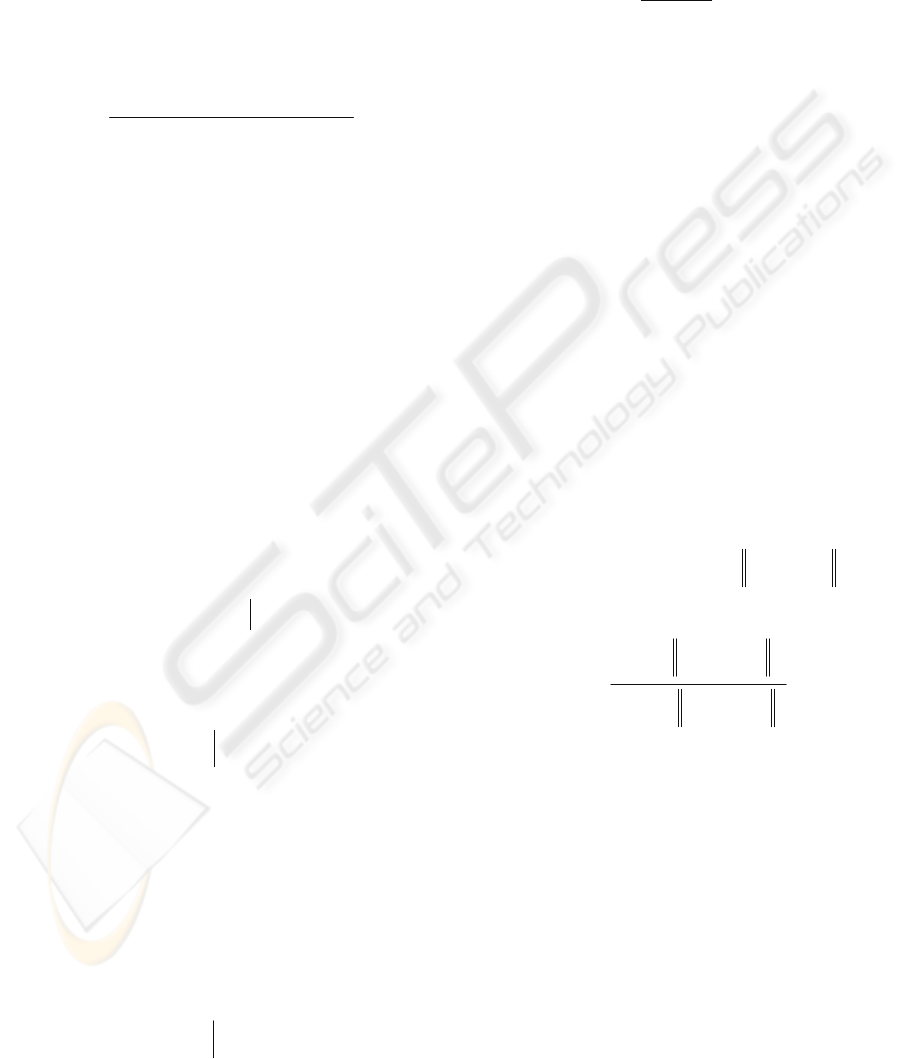
surgery prior to radiotherapy. Figure 2 shows sample
CB projection images acquired for different gantry
rotation angles, illustrating changes in signal level
and contrast, with location of the markers indicated
by white circles.
Figure 2: Sample of CB projection images acquired with
different gantry rotation angle.
3 MARKER TRACKING
As it was explained in the introduction tracking
fiducial markers in the CB projection images is a
challenging problem. To tackle this problems
effectively and robustly Matuszewski et al (2010)
proposed tracking algorithm which brings together
prior knowledge about the apparent motion of the
markers in the CB image sequence with a hybrid
tracking algorithm combining mean shift
(Comaniciu and Meer 2002) and particle filter
(Doucet et al 2001, Arulampalam et al 2002)
methodologies. At initialisation the position of all
the M markers
{
}
Mmx
m
…1;
0
=
are selected
manually in the first CB projection image. The
positions of the corresponding markers in the
subsequent projection images are estimated (tracked)
using probabilistic framework where the position
(
)
T
m
k
m
k
m
k
uvx ,=
of marker m at image k given all
observations
k
z
:1
till current image is given in terms
of posterior probability
(
)
k
m
k
zxp
:1
and the tracking
consist of two interleaving steps of prediction and
update. During the prediction step the position of the
marker in the next frame
(
)
k
m
k
zxp
:11+
is calculated
based on the estimated position in the current frame,
a dynamic model of motion consisting of a
deterministic propagation model and a stochastic
perturbation model. In the update state the new
SSD
SAD
(x,y,z)
X
kV beam
u(0
o
)
Y’
Y
X’
u(
θ
)
MV beam
VISAPP 2010 - International Conference on Computer Vision Theory and Applications
524

observations
1k
z
+
are used to refine the marker
position using measurements
(
)
11
m
kk
pz x
++
in the
Bayesian formula
() ()
k
m
k
m
kkk
m
k
zxpxzpzxp
:1111:11:11 +++++
⎟
⎠
⎞
⎜
⎝
⎛
∝
(2)
Due to the previously mentioned clutter and
occlusions in the projection images
()
1:
m
kk
p
xz
could
be highly non-Gaussian with multiple significant
modes. This prevents the use of standard Kalman
Filter or Extended Kalman Filter trackers. Instead a
particle filter tracker is used where the posterior is
approximated by a discrete set of particles
{
}
Nix
im
k
…1;
,
=
(samples from the posterior
distributions) and the corresponding weights
{
}
Niπ
im
k
…1;
,
=
corresponding to probabilities of
drawing corresponding particles:
() ( )
∑
=
−⋅∝
N
i
im
k
m
k
im
k
k
m
k
xxδπzxp
1
,,
(3)
The position of the marker is estimated based on
the posterior using maximum a posteriori probability
approach (MAP). The main modifications to the
particle filter proposed used for the tracking of
fiducial markers in the sequence of CB projection
images include use of equations of apparent motion
of the markers due to rotation of the gantry and
introduction of the mean shift in the prediction stage.
The use of the mean shift has a twofold effect.
Firstly it significantly reduces the number of
particles necessary for representing the posterior as
in this case all the particles would represent main
modes of the posterior. In fact the number of
particles can vary between different images. If there
are no occlusions or clutter there may be a single
particle propagating to the next frame, describing the
position of the mode of the uni-modal posterior
distribution. If there is significant clutter in the
image more particles will be used to describe the
multimodal posterior distribution. Secondly it
provides more accurate MAP estimates as the mean
shift algorithm guarantees convergence to, at least,
local maxima of the posterior, whereas the original
particle filter only randomly samples from the
posterior and as such the location of the maximum
of the posterior may not be represented in the drawn
particles. In most cases this scheme provides
accurate tracking results. In some cases where
markers come very closely together or indeed
overlap in the projection images the tracking
accuracy may drop and in some cases the identity of
the markers might be confused. By the tracker
design when markers move apart the tracker is able
to recover correct marker identity and resume
tracking with normal accuracy. For some
applications, for example CB volume reconstruction
(Marchant et al 2009), real-time tracking is not
necessary as the data may be processed after
acquisition of all projection images is complete. In
this case results can be improved further by batch
post-processing of the data. In the post processing
algorithm proposed in this paper all the particles
im
k
x
,
generated for all the markers m, and all images
k are fed to a function which assigns a cost to all
possible track configurations supported by the drawn
particles. The configuration of particles with the
lowest cost function defines final estimate of the
markers’ positions.
4 MARKER TRACKS POST
PROCESSING
The tracking method introduced in the previous
section generates particles (hypotheses) for the
estimated marker’s position. The number of these
particles depends on the local image complexity.
This may include image clutter, and/or presence of
other markers being close or indeed overlapping
with the marker for which position is estimated. For
complex configurations the tracker can generate tens
of hypothetical positions for each marker, or just a
single one if there is no image clutter or other
adjacent markers. To evaluate the quality of the
generated particles it is proposed to calculate for
each particle a score based on a number of criteria,
assessing how well the given prediction describes
the prior knowledge about the marker. This is
aiming at improving estimation accuracy and
helping to recover from possible track losses. The
score function adopted in this paper is defined as:
(
)
(
)
(
)
() ()
im
k
DsDs
im
k
MvMv
im
k
MuMu
im
k
MsMs
im
k
xsαxsα
xsαxsαxs
,,
,,,
+
++=
(4)
And the final estimate
m
k
x
ˆ
of the mth marker
position is given as:
()
max arg
ˆ
,
ˆ
,
ˆ
, im
k
i
im
k
m
k
xsixx ==
(5)
where:
(
)
im
k
im
k
im
k
uvx
,,,
,=
is i-th position prediction for
m-th marker in the k-th image;
(
)
im
k
Ms
xs
,
,
(
)
im
k
Mu
xs
,
,
MARKER TRACKS POST-PROCESSING FOR ACCURATE FIDUCIAL MARKER POSITION ESTIMATION IN
CONE BEAM CT PROJECTION IMAGES
525
(
)
im
k
Mv
xs
,
, and
(
)
im
k
Ds
xs
,
are respectively mode
similarity measure, u- and v-coordinate prediction
measures, and distance measure to the closest
marker, described below.
Mode similarity measure is directly obtained
from the mean shift algorithm. It indicates how
strongly the intensity pattern around the predicted
position (mode location) reflects the expected
marker shape and orientation. It is defined as:
()
()
()
()
(
)
∑
∑
=
Σ
=
Σ
−
−
=
n
l
l
jm
k
l
j
n
l
l
im
k
l
im
k
Ms
xxgxw
xxgxw
xs
m
m
1
,
1
,
,
max
(6)
where:
m
g
Σ
is Gaussian kernel with covariance
matrix
m
Σ
;
()
l
xw
represents the image intensities.
The estimated marker size and orientation in the
projection image, encoded by the kernel’s
covariance matrix
m
Σ
, is updated in each image as
long as there is no clutter in the proximity of marker
m.
u-coordinate prediction measure penalises
(assigns low score values to) predicted marker
positions for which the error between their u-
coordinates and the corresponding model prediction
()
k
m
θu
differs significantly from what is expected.
Based on experimental analysis
(
)
im
k
Mu
xs
,
is
modelled as having the Gaussian distribution with
mean value of
()
k
m
θu
ˆ
calculated from (1) using all
position estimates
{}
{
}
1
,
ˆ
:
=
=
i
im
n
m
n
uun with only one
particle (indicating uni-modal probability
distribution), and the dispersion
u
σ
set as one of the
method design parameters:
()
()
⎟
⎠
⎞
⎜
⎝
⎛
=
uk
mim
k
im
k
Mu
σθuuxs ,
ˆ
,,
N
(7)
v-coordinate prediction measure, weighs v-
coordinate of the predicted marker position
im
k
v
,
with respect to the corresponding coordinate
m
k
v
1
ˆ
−
estimated for the previous frame. This prediction
error is modelled using a Gaussian distribution with
a mean value of
{}
Nm
k
v
,−
Δ
and dispersions
{}
Ncardv
σ
,
defined as the method design parameters:
()
{}
{}
⎟
⎠
⎞
⎜
⎝
⎛
Δ−=
−
− Ncardv
Nm
k
m
k
im
k
im
k
Mv
σvvvxs
,
,
1
,,
,
ˆ
N
(8)
where:
{
}
Nm
k
v
,−
Δ
is an estimated displacement of
marker m, used to predict its v-position in the k
image, calculated as the mean from the displacement
calculated for all the other reliable markers (markers
described by a uni-modal distribution):
{}
{}
()
{}
{}
∑
∉
∈
+
−
−=Δ
Nm
Nj
j
k
j
k
Nm
k
vv
Ncard
v
ˆˆ
1
1
,
(9)
with {N} representing the set of indexes of markers
described by a uni-modal distribution in frame k-1;
model dispersion
{}
Ncardv
σ
,
is the method design
parameter, which depends on number card{N} of
reliable markers in frame k-1.
(
)
im
k
Mv
xs
,
is used in the score function only if there
is at least a single marker from which
{}
Nm
k
v
,−
Δ
can
be calculated.
Distance measure to the closest marker, is used
to “encourage” separation of the overlapping
markers. Without this component, on some
occasions when markers are crossing each other, the
estimated positions for two or more markers can be
assigned to the marker which is better defined in the
image. This component has only local influence as
the u-direction prediction quality measure would
dominate when the markers are becoming
significantly separated in u-direction, and therefore
this is only used when
min
,
,
;
⎟
⎠
⎞
⎜
⎝
⎛
−
≠
jn
k
im
k
jmn
xx
is
smaller than a predefined threshold value.
()
max
min
,
,
;;
,
,
;
,
⎟
⎠
⎞
⎜
⎝
⎛
−
⎟
⎠
⎞
⎜
⎝
⎛
−
=
≠
≠
jn
k
im
k
jimn
jn
k
im
k
jmn
im
k
Ds
xx
xx
xs
(10)
Corresponding weighting parameters
DsMvMuMs
αααα , , ,
are problem dependent and
are selected so
1=+
+
+
DsMvMuMs
αααα
.
Although the processing stages described so far
constitute a complete tracking algorithm, the
performance can be improved by batch post-
processing. The post-processing proposed in this
paper uses all the available
im
k
x
,
from the tracking
algorithm in the batch processing mode. The main
objective of this post- processing step is to correct
possible mistakes in the estimated marker positions
when markers appear very closely in the images as
the proposed tracking algorithm can “confuse” their
VISAPP 2010 - International Conference on Computer Vision Theory and Applications
526
identity. When markers move further apart, the
algorithm eventually recovers and tracks markers
correctly as the previously described score function
forces the tracker to reassign correct marker
identities. There are two basic ideas behind proposed
post processing. Firstly; to use motion models
()
θu
m
calculated for all markers m estimated using
all reliable marker positions and thereby enabling
higher accuracy of parameter estimation in the
()
θu
m
models. Secondly; to replace multiple
trackers using multiple score functions with a single
tracker using a single score function to assign the
best marker position configuration as a result of a
single optimisation process. Assuming that set
{
}
M
represents markers which are close in image k as
estimated from the models
()
k
m
θu
, for each
{}
Mm ∈
the proposed post-processing algorithm
uses all
im
k
x
,
, as defined in previous section.
Assuming that indexes of the M close markers are
denoted by i
1
,...,i
M
and for each of these markers
there are
1
i
K
,…,
M
i
K
predicted positions from the
mean shift mode seeking stage the cost function will
evaluate all
n
i
M
n
K
1=
∏ combinations of the form
{
}
,...,
,,
11 MM
ji
k
ji
k
xx
where
n
in
Kj ,...,1=
. In this new
score function
(
)
MM
ji
k
ji
k
xxS
,,
,...,
11
component
(
)
im
k
Ds
xs
,
from equation 9 is replaced with the score
component which penalises any disparity between
⎟
⎠
⎞
⎜
⎝
⎛
−
nn
mm
ji
k
ji
k
uu
,
,
and
() ()
(
)
k
i
k
i
θuθu
nm
−
calculated
pair wise, where
{}
{}
M
ii
Cnm
,...,
2
1
, ∈
(all 2 element
combinations from the set
{}
M
ii ,...,
1
of M
elements).
5 EXPERIMENTAL RESULTS
To help with the development of the algorithm as
well as to provide means for algorithm validation
ground truth data was gathered first. The ground
truth data describes the position, of the marker mid-
point, for each marker in each projection image. It
was calculated as an arithmetic mean from three
manual measurements taken by three different
observers. The quality of this data has been assessed
using the standard deviation calculated for each
marker and each image. The information about the
precision of the ground truth data is subsequently
used in quantitative evaluation of the proposed
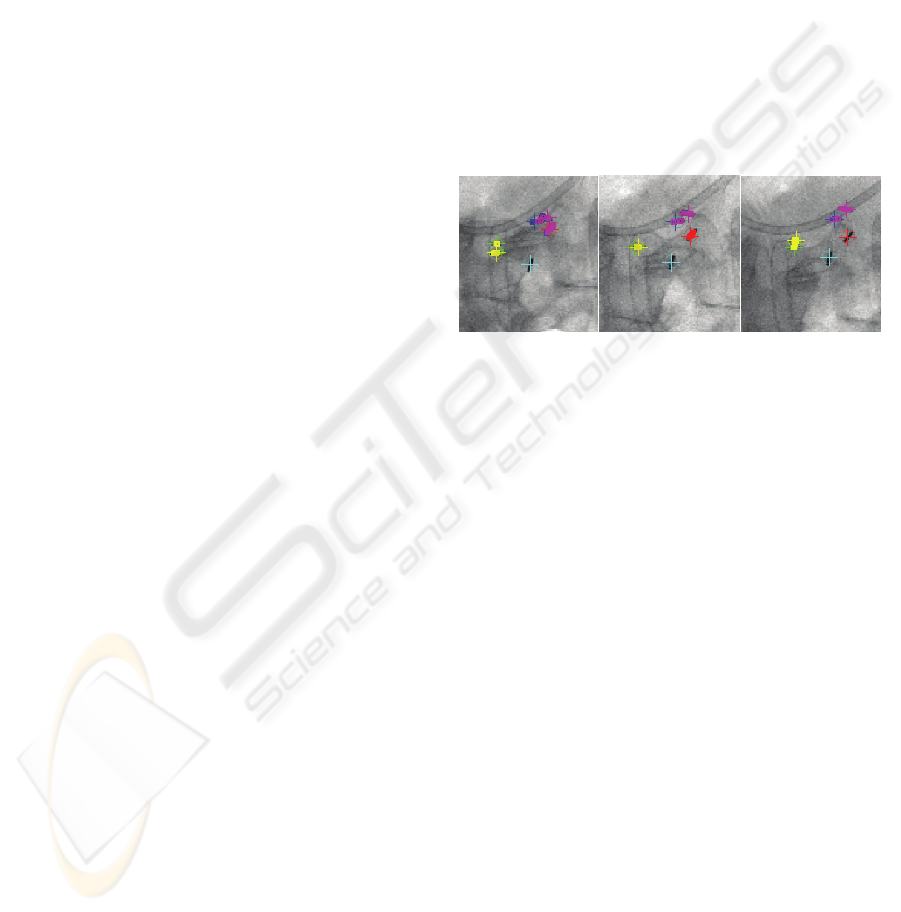
method. Figure 3 shows an example of three images
from the sequence of CB projection images. In these
images the ground truth markers’ positions are
shown by circles and the corresponding estimated
marker positions by crosses, with the corresponding
particles represented by squares. These images show
an example when two of the markers (on the left of
the image) are getting closer till they completely
overlap, subsequently markers separate but the
proposed algorithm is able to maintain correct
identity of the markers. The images also show that
for isolated markers only one particle is maintained
as the probability density function describing their
position is uni-modal.
(c)(a) (b)
Figure 3: Images showing tracking results for overlapping
markers.
Figure 4 shows the difference (red line) between
estimated, using the tracking method described in
section 3, and ground truth position as a function of
the gantry rotation angle for three randomly selected
markers. For reference standard deviation limits
σ
±
and
σ3
±
for the ground truth are also shown as blue
and green lines respectively. The ground truth
standard deviation changes significantly from one
image to another as it is estimated from only three
measurements per marker. To reduce this effect the
dispersion was filtered by a moving average filter
and used subsequently in the method evaluation. The
filtered version of the
σ3
±
is shown as magenta
coloured lines. As seen most of the error is within or
close to
σ3
±
of the ground truth apart from a few
spikes caused by temporal errors in marker identity
estimation. Figure 5 shows the same information as
in figure 4 but after post-processing as described in
section 4. It can be seen that the error spikes caused
by marker identity estimation error are eliminated
and indeed for most of the time the markers’
position is estimated within
σ± of the ground truth
marker position. After applying proposed post
processing the maximum marker position error was
estimated at 2.59 pixels compared to 2.51 pixels for
the ground truth and 5.6 pixels for tracking without
MARKER TRACKS POST-PROCESSING FOR ACCURATE FIDUCIAL MARKER POSITION ESTIMATION IN
CONE BEAM CT PROJECTION IMAGES
527
Figure 4. Error between estimated marker position and the corresponding ground truth position obtained for the tracking
algorithm described in section 3.
Figure 5. Error defined as in figure 4 obtained after applying proposed post-processing described in section 4.
post processing. The average standard deviation was
estimated at 0.42 pixels compared to 0.44 for the
ground truth and 0.47 pixels without post
processing. For the total number of 3,840 tracked
markers after post processing 1.61% and 0.02% of
their positional errors were respectively above three
and six standard deviation of the ground truth,
estimated separately for each marker and each
projection image, whereas corresponding results
without post processing where 2.86% and 0.23%.
6 CONCLUSIONS
The paper describes in detail a modification to
previously proposed automatic fiducial marker
tracking algorithm. The proposed modifications
require batch processing of all the available
measurement but as result improve the robustness
and accuracy of markers’ position estimates. The
proposed method uses a combination of the mean
shift algorithm, sequential random sampling, custom
designed constraints, and combinatorial
optimisation. The tests show that the accuracy and
robustness of the proposed method is superior to the
results obtained by human observers. The method
was specifically developed for CBCT projection
images for correction of motion artefacts in the
reconstructed 3D CBCT volume.
ACKNOWLEDGEMENTS
This work has been supported from: the Metrology
VISAPP 2010 - International Conference on Computer Vision Theory and Applications
528

Guided Radiation Therapy (MEGURATH) project
(EPSRC grant No. EP/D077540/1).
REFERENCES
Arulampalam S, Maskell S, Gordon N and Clapp T 2002
A tutorial on particle filters for on-line non-linear/non-
Gaussian Bayesian tracking, IEEE Transactions on
Signal Processing 50 174-188
Balter J M and Cao Y. 2007 Advanced technologies in
image-guided radiation therapy Semin. Radiat. Oncol.
17 293-297
Berbeco R I, Jiang S B, Sharp G C, Chen C T Y, Mostafi
H and Shirato H 2004 Integrated radiotherapy imaging
system (IRIS): design considerations of tumour
tracking with linac gantry-mounted diagnostic x-ray
system with flat-panel detectors Phys. Med. Biol. 49
243-55
Comaniciu D and Meer P 2002 Mean Shift: A robust
approach towards feature space analysis IEEE Trans.
Pattern Analysis and Machine Intelligence 24 603-19
Cui Y, Dy J G, Sharp G C, Alexander B and Jiang S B
2007 Robust fluoroscopic respiratory gating for lung
cancer radiotherapy without implanted fiducial
markers Phys. Med. Biol. 52 741-55
Doucet A, Freitas N, Gordon N 2001 Sequential Monte
Carlo Methods in Practice (New York: Springer)
Hoisak J D P, Sixel K E, Tirona R, Cheung P C F and
Pibnol J P 2004 Correlation of lung tumor motion with
external surrogate indicators of respiration Int. J.
Radiat. Oncol. Biol. Phys. 60 1298-306
Keall P J, Todor A D, Vedam S S, Bartee C L, Siebers J
V, Kini V R and Mohan R 2004 On the use of EPID-
based implanted marker tracking for 4D radiotherapy
Med. Phys. 31 3492-9
Marchant T E, Amer A M and Moore C J 2008
Measurement of inter and intra fraction organ motion
in radiotherapy using cone beam CT projection images
Phys. Med. Biol. 53 pp. 1-12
Marchant T, Price G, and Moore C, 2009, ‘Motion
Correction in Cone Beam CT (CBCT) by Projection
Image Warping’, UK Radiation Oncology Conference,
Cardiff, 6-8 April 2009 (abstracted in Clinical
Oncology 21 (3) p243). DOI:
10.1016/j.clon.2009.01.001
Matuszewski B J Skalski A, Marchant T E, 2010,
Automatic tracking of implanted fiducial markers in
cone beam CT projection images, submitted to Physics
in Medicine and Biology.
Moore C J and Graham P A 2000 3D dynamic body
surface sensing and CT-body matching a tool for
patient set-up and monitoring in radiotherapy, J.
Computer Aided Surgery, Special Edition on Planning
and Image-Guidance in Radiation Therapy 5 2000
234-45
Poulsen P R, Cho B and Keall P J 2008 A method to
estimate mean position, motion magnitude, motion
correlation, and trajectory of a tumor from cone-beam
CT projections for image-guided radiotherapy Int. J.
Radiation Oncology Biol. Phys. 72 1587-1596
Shirato H, Shimizu S, Shimizu T, Kitamura K, Nishioka
T, Kagei K, Hashimoto S, Aoyama H, Kunieda T,
Shinohara N, Dosaka-Akita H and Miyasaka K 1999
Four-dimensional treatment planning and fluoroscopic
real-time tumor tracking radiotherapy for moving
tumor Int. J. Radiat. Oncol. Biol. Phys.
48 435-42
Tang X, Sharp G C and Jiang S B 2007 Fluoroscopic
tracking of multiple implanted fiducial markers using
multiple object tracking Phys. Med. Bio 52 4081-98
Willoughby T R, Kupelian P A, Pouliot J, Shinohara K,
Aubin M, Roach M, Skrumeda L L, Balter J M,
Litzenberg D W Hadley S W, Wei J T and Sandler H
M 2006 Target localization and real-time tracking
using the Calypso 4D localization system in patients
with localized prostate cancer, Int J radiat Oncal Biol
Phys 65 528-34
MARKER TRACKS POST-PROCESSING FOR ACCURATE FIDUCIAL MARKER POSITION ESTIMATION IN
CONE BEAM CT PROJECTION IMAGES
529
