
VASCULAR NETWORK SEMI-AUTOMATIC SEGMENTATION
Using Computed Tomography Angiography
Petr Maule, Jiří Polívka and Jana Klečková
Department of Informatics, University of West Bohemia, Pilsen, Czech Republic
Keywords: Vascular Network Segmentation, Computed Tomography Segmentation, Portal Vein, Mesh Exporting.
Abstract: The article describes simple and straightforward method for vascular network segmentation of computed
tomography examinations. Proposed method is shown step by step with illustrations on liver's portal vein
segmentation. There is also described method of creating and exporting mesh and simple way of its
visualization which is possible also from a web-browser. The method was developed to provide satisfactory
results in a short time and is supposed to be used as geometry input for mathematical models.
1 INTRODUCTION
Medical diagnostic methods are quickly evolving
branch of research. Properties of current medical
instruments are improved year by year and larger
amount of data is being stored. Important part of
medical diganostic methods is to correctly process
imaging data which comes from different modalities.
A lot of mathematical models have been developed
to simulate functionality of different organs. Such
models require inputs where some of them (like
geometry) can be provided by processing computed
tomography (CT) images. This article describes our
experience with vascular tree segmentation process
in order to gain geometry information for liver's
model which is under development.
Geometry detection has been already solved but
finding any suitable non-commercial software is not
so easy. Therefore we are presenting here simple and
straightforward method for geometry detection
which can be implemented in a short time.
2 METHOD DESCRIPTION
We propose universal procedure for geometry
information detection. This procedure is based on
presumption that we know range of densities of the
desired object. In order to liver's vascular network
we want to find geometry of portal vein. We will
describe whole process on a computed tomography
dataset.
2.1 Input Examination
Input examination used in this article is CT
angiography examination stored in DICOM format
consisting of 1256 slices of 0.6 mm slice thickness.
The examination covers bottom body part starting in
a half of livers and ending before knees.
Segmentation process of the liver's vascular network
should be able to work also with non-complete data
sources like this. At this point we cannot expect full
network, but only the part which is covered by the
examination.
2.2 Desired Outcome
We need to find surface model of vascular network.
It means that we must find just surface of the
network and describe it as coordinations of vertexes
and list of connections between them forming
triangles or rectangles lying on surface. The ideal
surface should be formed by a mesh describing
smooth tubes (cylinders) of diameters corresponding
to detected vessels. But it is a task for a future work
at the moment.
2.3 Preparation
Input examinations often contain more data then it is
required and it makes process of vessels
segmentation more time consuming. By selecting a
sub-volume we significantly reduce time required
for processing. Sub-volume selection can be
described as finding upper left and lower right x, y, z
coordinations of the sub-volume (see Figure 1).
323
Maule P., Polívka J. and Kle
ˇ
cková J. (2010).
VASCULAR NETWORK SEMI-AUTOMATIC SEGMENTATION - Using Computed Tomography Angiography.
In Proceedings of the 5th International Conference on Software and Data Technologies, pages 323-326
DOI: 10.5220/0002917203230326
Copyright
c
SciTePress
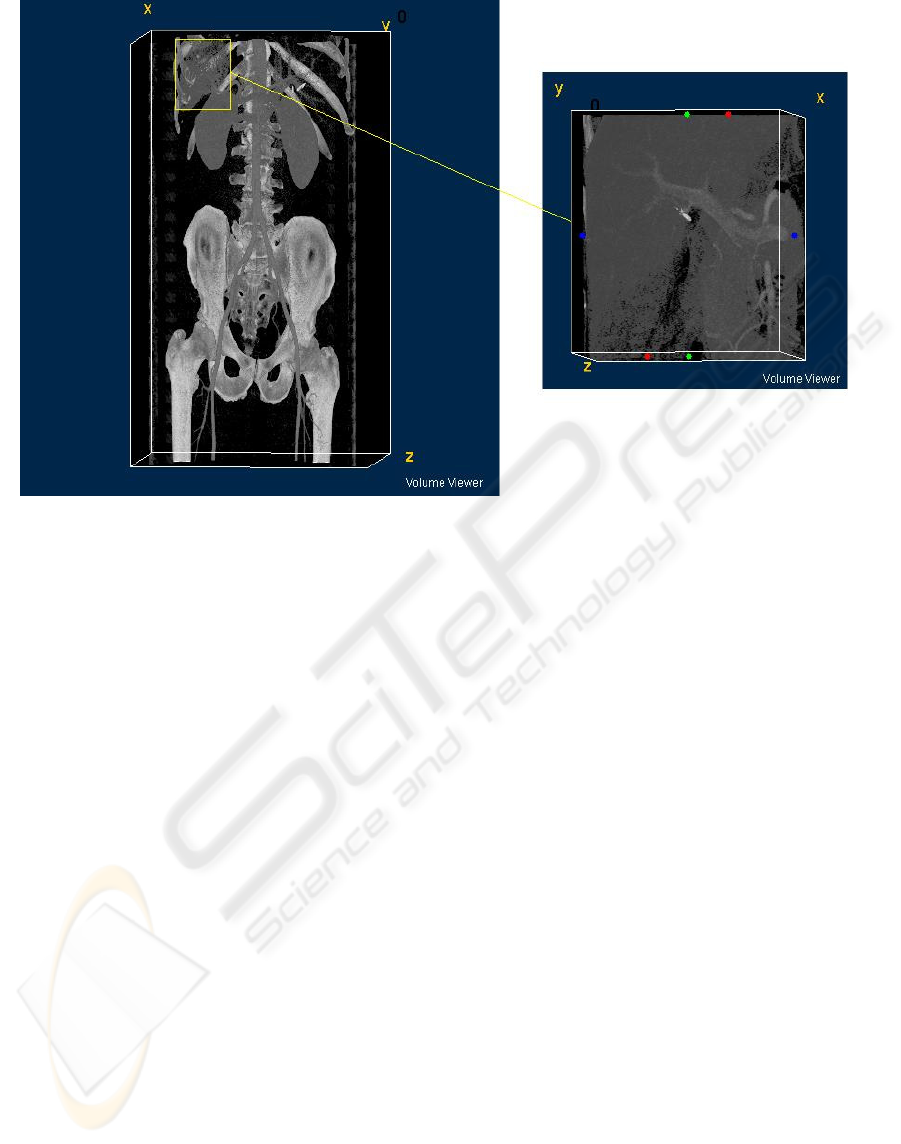
Figure 1: Sub-volume selection.
2.4 Segmentation
Segmentation is based on assumption that we know
range of densities which desired object should have.
In our case range of portal vein densities is 100-150
HU. Input examinations can contain noise which
makes segmentation more difficult. We use
averaging method of near neighborhood where
dimensions of the considered neighborhood we are
of the smallest object which we want to detect. In
our case we want to find all vascular structures at
least with diameter of 2 mm. We use neighborhood
of spherical area with diameter 2 mm. We compute
average density for each pixel of the sub-volume
resulting in intermediate image where only two
values are present (1 for average density of desired
object, 0 elsewhere).
Portal vein comes from larger dimensions to
smaller. Trunk of the vein is significant and can
measure about several centimeters in diameter. As
the vascular tree divides in branches the diameter is
less and less. The smallest parts are out of
instruments possibilities and are not visible in scans.
Figure 2 shows intermediate image. It requires
further processing steps.
2.5 Grouping Method
Figure 2 shows that basic segmentation process
produces too much points. Idea of further processing
is to divide all points into groups. Each group
contains only points which border with each other.
For this purpose we use seed filling algorithm. For
each point of intermediate image with value of 1 we
search his neighborhood in all 26 directions. If there
is a point with value of 1 too it will be added to the
same group as initial point (seed filling). The points
which have been already assigned to a group will be
skipped. We mark groups by numbers increasing by
1. When all groups are found we can count how
many of the points each group have and easily we
can remove groups where number of points does not
exceed certain level. Threshold number is
application depended. In our case we will finally
leave just one group which will correspond to the
portal vein which is the group with the highest
number of the points. But in first tries it is better find
a threshold value which will provide removing of
those points which persisted by noise or by limited
sensitivity of the instruments. Figure 3 shows our
case using threshold of 50 000 points.
2.6 Final Adjustment
Result shown in Figure 3 contains desired portal
vein but it contains also other connected parts which
should be removed. We recommend to cut these
parts already during creation of intermediate image.
It is required to find bounding box of these parts in
input examination.
ICSOFT 2010 - 5th International Conference on Software and Data Technologies
324
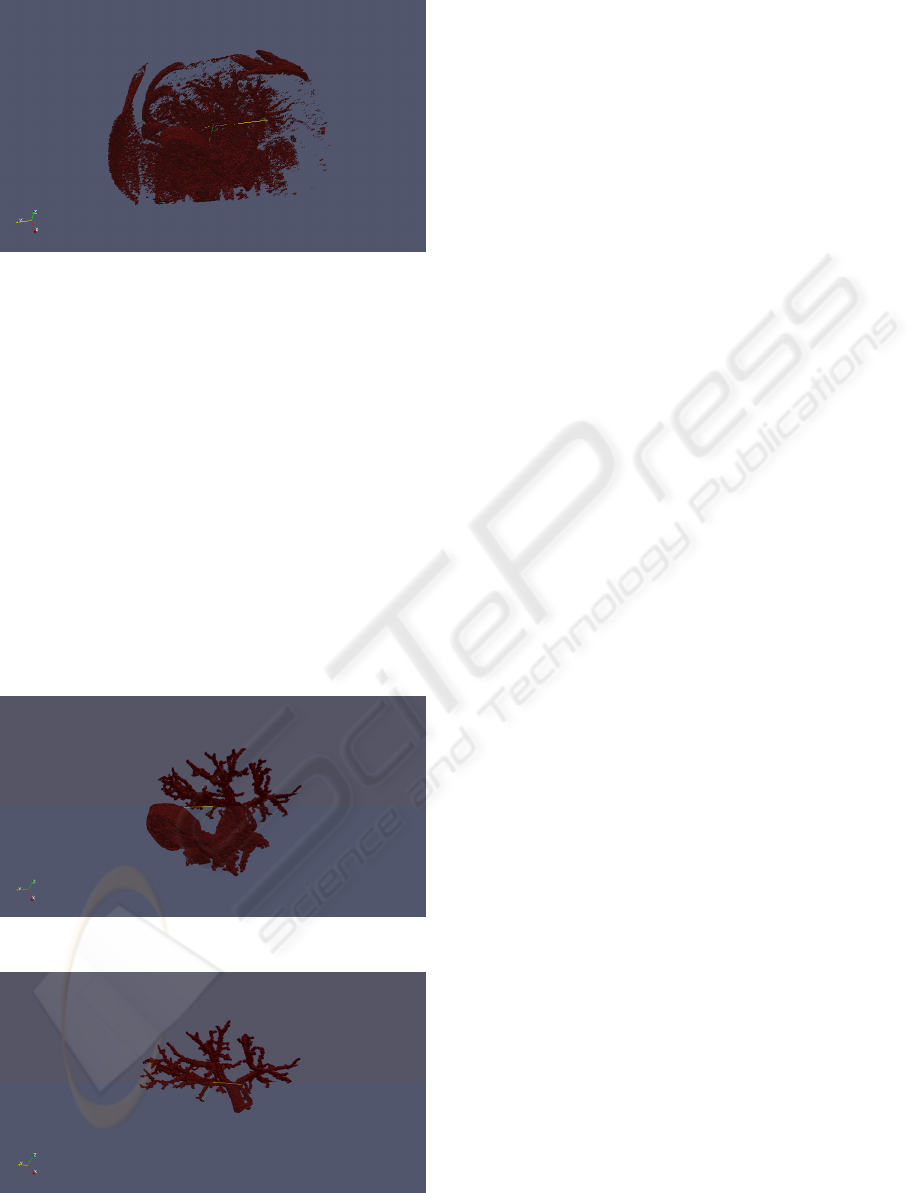
Figure 2: Intermediate image.
It is similar to finding sub-volume described in
section 2.3. It means that for each part we must find
upper left and lower right coordinations (x, y, z)
forming a box which will not be present for further
processing. Skipping these areas from intermediate
image processing will influence grouping method
(section 2.5). Correct bounding box of the object to
be removed should break connections between
object to be removed and desired object. It should
not cut any part of the desired object (portal vein).
This process will lead to division of groups where
objects to be removed will have their own groups
with less points thus it will be removed according to
used threshold value. We used four bounding boxes
to remove unwanted objects. The final result is
shown in Figure 4.
Figure 3: Grouping method result.
Figure 4: Portal vein network.
3 MESH GENERATION
Our method described in section 2 results in three-
dimensional array where all places of vascular
network are marked with value of 1. Mesh can be
described as a list of vertex coordinations and
description of faceset stored as indexes of the
vertexes composing each face.
Mesh generation process is a process where only
surfaces of the vascular network should be stored.
We store mesh by processing all elements of the
array. At those places where we detect transition
from 1 to 0 we store it as a mesh face. In more
details all elements with value of 1 undergo testing
whether any of their neighbouring elements in 6
directions (left, right, up, down, forward, backward)
contains value of 0 and if yes we store face
information. As far as we use DICOM format
examinations we know dimensions of each element
of the 3D array so we use it for computing
coordinations of vertexes. We store face in a
rectangle form therore a face will be stored as 4 new
vertexes and one description of the face as 4 vertex
indexes. Vertexes of adjacent faces can be shared so
we prevent duplicities by testing whether required
vertex has been already stored.
3.1 File Formats
Important part of vascular network segmentation is
visualization. Visualization offers important
feedback. Good visualization can help you with
localization of parts to remove and tells where to
remove it (see section 2.6). Visualization software
exists but it differs in licence conditions and
supported file formats. We use mesh exporting to
Virtual Reality Modeling Language (VRML) file
format because VRML files is easy to create and
there can be also downloaded plugins into a web
browser and you can display it directly in the web
browser. For more information about VRML see [2].
4 FUTURE PLANS
Our goal is to improve this tool and make it usable
from experimental database medical system [1]. The
database stores examinations of different kinds
including CT examinations. We hope that we will
develop a system which will be able to segment
imaging examinations starting with CT examinations
according to needs of future mathematical models
which will run above the experimental database
VASCULAR NETWORK SEMI-AUTOMATIC SEGMENTATION - Using Computed Tomography Angiography
325

system. This will require to develop description
system of mathematical model needs. All segmented
vascular network structures will be stored in the
database and will be available by web-based
browsing system in form of VRML files.
5 CONCLUSIONS
We proposed simple straightforward method which
is able to segment and export vascular network in a
mesh form. This method is shown on example of
liver's vascular network segmentation. We have
described method which can be easily used for
segmentation of other vascular networks.
Description of each step with graphical figures can
help others who are dealing with this problematic.
Described method can be implemented in a short
time and gives satisfactory results which can be used
for further processing or base for mathematical
modeling.
ACKNOWLEDGEMENTS
The work presented in this paper is supported by
The Czech Science Foundation project 106/09/0770
dealing with brain perfusion modelling.
REFERENCES
Vcelak P, Polivka J, Maule P, Kratochvil P and Kleckova
J (2009). Experimental database system for the
vascular brain diseases research. Frontiers in
Neuroinformatics. Conference Abstract: 2nd INCF
Congress of Neuroinformatics. doi: 10.3389/conf.neu
ro.11.2009.08.002
VRML Specification, http://www.web3d.org/x3d/vrml.
A. Henderson. ParaView Guide, A Parallel Visualization
Application. Kitware Inc., Clifton Park, NY, USA,
2007.
Abramoff, M. D., Magelhaes, P. J., Ram, S. J. Image
Processing with ImageJ. Biophotonics International,
volume 11, issue 7, pp. 36-42, 2004.
ICSOFT 2010 - 5th International Conference on Software and Data Technologies
326
