
CANONICAL CORRELATION ANALYSIS OF COURSE AND
TEACHER EVALUATIONS
Tamara Sliusarenko and Bjarne Kjær Ersbøll
DTU Informatics, Technical University of Denmark, DK-2800 Kgs. Lyngby, Denmark
Keywords: Course Evaluation, Teacher Evaluation, Student Questionnaire, Canonical Correlation, Higher Education.
Abstract: At the Technical University of Denmark course evaluations are performed by the students on a
questionnaire. On one form the students are asked specific questions regarding the course. On a second form
they are asked specific questions about the teacher. This study investigates the extent to which information
obtained from the course evaluation form overlaps with information obtained from the teacher evaluation
form. Employing canonical correlation analysis it was found that course and teacher evaluations are
correlated. However, the structure of the canonical correlation is subject to change with changes in teaching
methods from one year to another.
1 INTRODUCTION
Teacher evaluations and overall course quality
evaluations are widely used in higher education.
Students usually submit their feedback about the
teacher and the course anonymously at the end of the
course. Results are usually employed to improve
courses for future students and to improve the
instructor’s effectiveness. Many researchers have
stated that student rating is the most valid and
practical source of data on teaching and course
effectiveness (McKeachie, 1997). Therefore,
research on student evaluations is critical to make
improvements in course construction and teaching
methods.
Many studies have been done based on the data
from student evaluation addressing the relationship
between student rating and student achievement
(Cohen, 1981; Abrami et al. 1997). The main
conclusion is that the student’s achievement is
correlated with the student’s evaluation of the
teacher and the course.
The purpose of this research is to investigate the
degree of association between students’ evaluation
of the course and students’ evaluation of the teacher.
This is done using canonical correlation analysis,
which is designed to investigate correlations
amongst two sets of variables. The other question we
are trying to address is whether this association is
consistent over time.
2 DATA AND METHODS
2.1 Data Source and Study Sample
This research is based on questionnaire data from
course evaluations at the Technical University of
Denmark (DTU). Online course evaluation is
performed a week before the final week of the
course. This usually means in week 12 out of 13
weeks of teaching. Two samples of observations
from the introductory statistics course taught by the
same instructor in two subsequent years were
analysed: 131 observations from autumn 2007 and
183 observations from autumn 2008.
The questionnaire at DTU consists of three parts:
Form A contains questions about the course; Form B
contains questions about teacher. Finally, form C
contains three open questions; that gives the students
the opportunity to write their feedback “What went
well?”; “What did not go so well?”; ”Suggestions
for changes”. This particular analysis is based on
investigation of the relationship between Form A
and Form B. Questions used in this research are
presented in Table 1 and Table 2 respectively.
Each student has five possibilities to rate
questions from 5 to 1, where 5 means that the
student strongly agrees with the underlying
statement and 1 means that the student strongly
disagrees with statement.
451
Sliusarenko T. and Kjær Ersbøll B. (2010).
CANONICAL CORRELATION ANALYSIS OF COURSE AND TEACHER EVALUATIONS.
In Proceedings of the 2nd International Conference on Computer Supported Education, pages 451-454
DOI: 10.5220/0002858904510454
Copyright
c
SciTePress
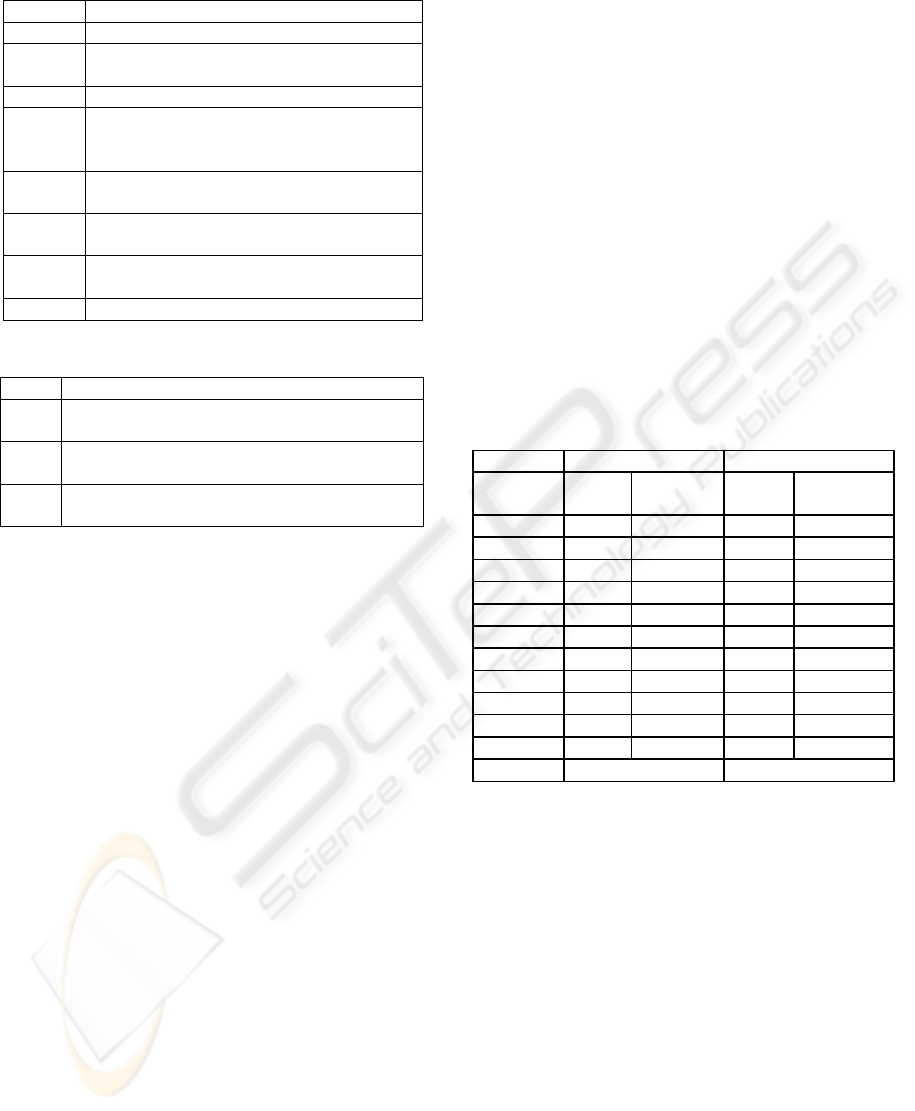
Table 1: Example of questions in Form A.
Question
A.1.1 I think I am learning a lot in this course
A.1.2 I think the teaching method encourages my
active participation
A.1.3 I think the teaching material is good
A.1.4 I think that throughout the course, the
teacher has clearly communicated to me
where I stand academically
A.1.5 I think the teacher creates good continuity
between the different teaching activities
A.1.6 5 points is equivalent to 9 hours per week. I
think my performance during the course is
A.1.7 I think the course description’s
prerequisites are
A.1.8 In general, I think this is a good course
Table 2: Example of questions in Form B.
Question
B.1.1 I think that the teaching gives me a good grasp
of the academic content of the course
B.1.2 I think the teacher is good at communicating
the subject
B.1.3 I think the teacher motivates us to actively
follow the class
For question A.1.6 5 corresponds to “much less” and
1 to “much more”, while for A.1.7 5 corresponds to
“too low” and 1 to “too high”.
2.2 Methodology
Canonical correlation analysis (CCA), introduced by
Hotelling (1935, 1936), was performed to
investigate the degree of association between the
evaluation of the teacher and the evaluation of the
course. CCA is a convenient method to investigate
what is common amongst two sets of variables in a
linear sense, and can also be used to produce a
model equation which relates two sets of variables.
It has similarities with both multivariate regression
and principal component analysis
The main idea behind CCA is to find canonical
variables in the form of two linear combinations (1):
nn
xaxaxaw
12211111
...+
+
+=
mm
ybybybv
12211111
...+
+
+=
(1)
such that the coefficients a
1i
and b
1i
maximize the
correlation between two canonical variables w
i
, and
v
1
. This maximal correlation between the two
canonical variables is called the first canonical
correlation. The coefficients of the linear
combinations are called canonical coefficients or
canonical weights.
The method continues by finding a second set of
canonical variables, uncorrelated with the first pair
that has maximal correlation, which produces the
second pair of canonical variables. The maximum
number of canonical variables is equal to the number
of variables in the smaller set. A likelihood ratio test
was used to investigate statistical significance of
canonical correlations.
3 RESULTS
3.1 Evidence from the Data
From the simple descriptive statistics presented in
Table 3 it is evident that there is a difference in
student rating between 2007 and 2008 in both parts:
the course and the teacher evaluation.
Table 3: 2007 and 2008 sample descriptive statistics.
Autumn 2007 Autumn 2008
Question Mean
Standard
Deviation
Mean
Standard
Deviation
A.1.1 4.34 0.74 4.02 0.76
A.1.2 4.11 0.84 3.91 0.83
A.1.3 3.98 0.88 3.88 0.95
A.1.4 3.52 1.06 3.24 1.06
A.1.5 4.20 0.79 4.03 0.83
A.1.6 3.24 0.69 3.40 0.71
A.1.7 2.98 0.19 3.02 0.23
A.1.8 4.31 0.73 4.09 0.82
B.1.1 4.66 0.54 4.34 0.81
B.1.2 4.79 0.46 4.48 0.76
B.1.3 4.73 0.53 4.40 0.83
#observ 131 183
The highest rated course specific questions in both
years about the course are A.1.1 “I think I am
learning a lot in this course” and A.1.8 “In general, I
think this is a good course.”, but the rating is lower
in 2008 than in 2007. On average students rate both
course and the teacher better in 2007 than in 2008.
This difference may be explained by the fact that in
autumn 2007 the course was taught in the way of
normal lecturing, but in autumn 2008 it was also
covered by video.
3.2 Autumn Semester 2007
The first canonical correlation was found to be equal
to 0.64. This gives an overall indication of the
degree of association between teacher and course
evaluation. It is the only canonical variable which is
significant (p-value < 0,0001), which indicates that
CSEDU 2010 - 2nd International Conference on Computer Supported Education
452
the two sets of variables are correlated in only one
dimension.
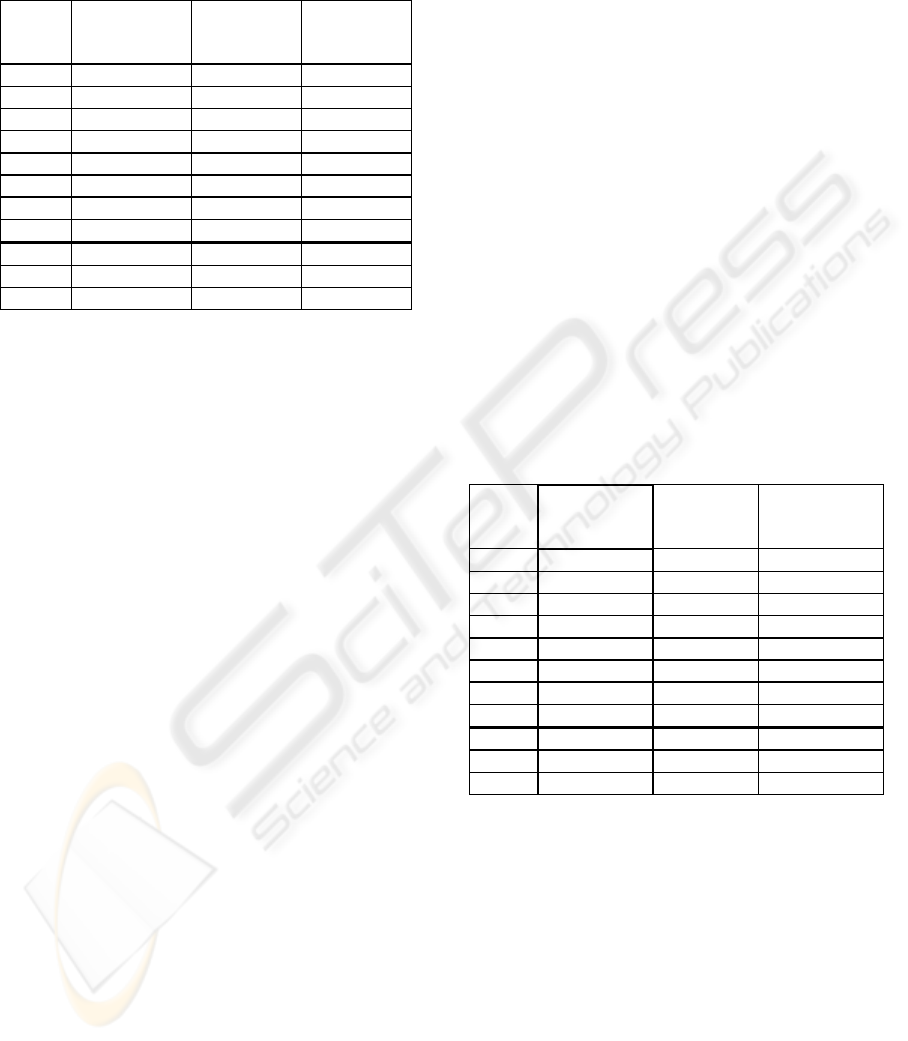
Table 4: Canonical structure analysis of 2007 sample.
Standardized
Canonical
Coefficients
Canonical
factor
loadings
Canonical
cross-
loadings
A.1.1 0.22
0.78 0.50
A.1.2 0.01
0.73
0.47
A.1.3 -0.07 0.38 0.24
A.1.4 -0.02 0.37 0.24
A.1.5
0.46 0.82 0.53
A.1.6 -0.10 -0.04 -0.03
A.1.7 -0.08 -0.14 -0.09
A.1.8
0.51 0.89 0.57
B.1.1
0.82 0.98 0.63
B.1.2 0,12 0,78 0,50
B.1.3 0,14 0,71 0,45
The next question that arises is “how do we interpret
the canonical variables?”. To answer this question
standardized canonical coefficients should be
investigated. These coefficients are reported in the
first column of Table 4. We can see that in the
canonical variable of the course evaluation questions
A.1.5 (I think the teacher creates good continuity
between the different teaching activities) and A.1.8
(In general, I think this is a good course) have the
highest weights. In the teacher related canonical
variable question B.1.1 (I think that the teaching
gives me a good grasp of the academic content of
the course) is the most important.
Structure correlation coefficients, called
canonical factor loadings, are also used to interpret
the importance of each original variable in the
canonical variables. Canonical factor loading is the
correlation between the original variables and the
canonical variables. Variables with high canonical
factor loading should be interpreted as being a part
of the canonical variable.
The first set of loadings between course
evaluation variables and their canonical variable are
presented in the second column of Table 4.
Questions A.1.5 and A.1.8 have the highest
correlation with the course related canonical
variable. However, questions A.1.1 (I think I am
learning a lot on this course) and A.1.2 (I think the
teaching method encourages my active participation)
also have high canonical factor loadings. Question
B.1.1 has the highest correlation with the teacher
related canonical variable.
Next we look at the cross correlations between
the original course evaluation variables and the
canonical variables of the teacher evaluation
variables presented in the third row of Table 4. We
can see that questions A.1.5 and A.1.8 also have the
highest cross-correlations with the teacher related
canonical variable, questions A.1.1 also has quite a
high canonical cross-loading. Question B.1.1 has the
highest cross-correlation with the course related
canonical variable.
An overall conclusion that can be made is that
the canonical correlation of 0.64 in the autumn 2007
introductory statistics course is mainly due to the
relationship between the teachers ability to give a
good grasp of the academic content of the course
from one side and a good continuity between
teaching activities in the course, good content of the
course and good overall quality of the course on the
other side.
3.3 Autumn Semester 2008
As in the case of autumn semester 2007 only the
first canonical correlation, equal to 0.71, appears to
be significantly different from zero (p-
value<0,0001).
Table 5: Canonical structure analysis of 2008 sample.
Standardize
d Canonical
Coefficients
Canonical
factor
loadings
Canonical
cross-
loadings
A.1.1
0.39 0.88 0.62
A.1.2
0.47 0.87 0.62
A.1.3 -0.03 0.61 0.43
A.1.4 0.08 0.40 0.28
A.1.5 0.17 0.71 0.51
A.1.6 0.03 -0.09 -0.07
A.1.7 0.08 -0.04 -0.03
A.1.8 0.16
0.76 0.54
B.1.1
0.43
0.89 0.63
B.1.2 0.11 0.90 0.64
B.1.3
0.55 0.94 0.67
Analyzing the standardized canonical coefficients
from the first column of Table 5 we can conclude
that in the canonical variable of the course
evaluation question A.1.1 (I think I am learning a lot
on this course) and question A.1.2 (I think the
teaching method encourages my active participation)
are important. In the teacher related canonical
variable questions B.1.1 (I think that the teaching
gives me a good grasp of the academic content of
the course) and B.1.3 (I think the teacher gives me
useful feedback on my work) are important.
Analysis of the canonical factor loadings,
presented in the second and third columns of Table
5, shows that questions A.1.1, A.1.2 and A.1.8 have
CANONICAL CORRELATION ANALYSIS OF COURSE AND TEACHER EVALUATIONS
453

the highest correlations with their canonical variable.
We can also see that the same three questions have
the highest cross-correlation with the teacher
evaluation canonical variable. Question B.1.3 has
the highest correlation and cross-correlation with the
corresponding canonical variables.
An overall conclusion is that the canonical
correlation of 0,71 in the autumn semester 2008
course is mainly due to the relationship between the
teacher’s ability to motivate the students and a good
teaching method that encourages active participation
in the course, good course content, and overall
quality of the course. This difference can be
explained by the change in teaching method from
normal lectures in 2007 to combined lectures and
video sequences, which could be replayed by the
students, in 2008. This was reflected to a very high
degree in the verbal comments in form C.
Examples of verbal comments from 2007 are
very much focused on the teacher: “Good
dissemination”, “Teacher seems pleased with his
course”, “Engaged teacher”, “Gives a really good
overview”, “Inspiring teacher”. Examples of verbal
comments from 2008 on the other hand to a very
large extent are concerned with the new teaching
method: “Good idea to record the lectures – useful
for preparation for the exam”, “The possibility of
downloading the lectures is fantastic”, “Really good
course, the video recordings really worked well!”
4 CONCLUSIONS
This study analyses the association between how
students evaluate the course and how students
evaluate the teacher in two subsequent years, using
canonical correlation analysis. This association was
found to be quite strong in both years: higher in
2008 than in 2007. The structure of the canonical
correlations appears to be different for these two
years. This is accounted for by the change in
teaching method used by the same teacher in the two
different years: in 2007 it was normal lecturing, but
in 2008 it was also covered by video - and the
students really liked that. Therefore, question A.1.2
that concerns the teaching method has more impact
on the correlation between course evaluation and
teacher evaluation in 2008 than in 2007. In 2008 the
teacher’s motivation for the students to actively
follow the class has major impact on the correlation
between the teacher evaluation and the course
evaluation instead of good academic grasp as in
2007.
5 FUTURE WORK
This paper is the early stage of comprehensive
research on student evaluation at the Technical
University of Denmark. Questions we would like to
address in future work include consistency of the
evaluation in courses over time, across courses, and
comparison of mandatory vs. elective courses. The
study will also investigate the relationship between
students’ achievements and students’ rating of the
teacher and the course (Ersbøll, 2010). Furthermore,
we will investigate whether student specific
characteristics such as age, gender, years of
education, etc have relationship with the student
evaluation and achievement. Information from
qualitative answers is also important, so some text-
mining type methods will be used in order to utilize
information from Form C.
REFERENCES
Abrami, P.C., d’ Apollonia, S, Rosenfield, S., 1997. The
dimensionality of student ratings of instruction: what
we know and what we do not. In Perry, R.P., Smart
J.C., editors: effective teaching in higher education:
research and practice., New York: Agathon Press.
Cohen, P. A. 1981. Student rating of instruction and
student achievement. Review of Educational Research;
51(3): 281-309.
Cohen, J., Cohen, P., West S. G. Aiken, L. S., 2003.
Applied multiple regression/correlation analysis for
the behavioural sciences.; 3
rd
ed. Mahwah(NJ):
Lawrence Erlbaum.
Ersbøll B.K. 2010. Analyzing course evaluations and
exam grades and the relationships between them.,
paper accepted to be published at CSEDU 2010.
Feldman, K.A., 1989. The association between student
ratings of specific instructional dimensions and
student achievement: Refining and extending the
synthesis of data from multisection validity studies.
Research in Higher education, Vol. 30, No 6.
Hotelling, H., 1935. The most predictable criterion.
Journal of Educational Psychology, Vol. 26: 139-142.
Hotelling H., 1936, Relation Between Two Sets of
Variates, Biometrika. 28(3-4):321-377
McKeachie, W.J., 1997 Student Ratings: Their Validity of
Use, American Psychologist, Vol. 52, 1218-1225
SAS Institute, 2009, SAS 9.2 User's Guide, 2
nd
ed.
Thompson B. 1984. Canonical correlation analysis: uses
and interpretation. In: Quantitative applications and
social sciences. Vol. 47 of Sage university papers. 2
nd
ed.
CSEDU 2010 - 2nd International Conference on Computer Supported Education
454
