
UNSUPERVISED IMAGE SEGMENTATION BASED ON THE
MULTI-RESOLUTION INTEGRATION OF ADAPTIVE LOCAL
TEXTURE DESCRIPTORS
Dana E. Ilea, Paul F. Whelan and Ovidiu Ghita
Centre for Image Processing & Analysis (CIPA), Dublin City University, Glasnevin, Dublin 9, Ireland
Keywords: Texture Segmentation, Multi-resolution Integration, Image Orientation, Texture Distribution.
Abstract: The major aim of this paper consists of a comprehensive quantitative evaluation of adaptive texture
descriptors when integrated into an unsupervised image segmentation framework. The techniques involved
in this evaluation are: the standard and rotation invariant Local Binary Pattern (LBP) operators, multi-
channel texture decomposition based on Gabor filters and a recently proposed technique that analyses the
distribution of dominant image orientations at both micro and macro levels. The motivation to investigate
these texture analysis approaches is twofold: (a) they evaluate the texture information at micro-level in
small neighborhoods and (b) the distributions of the local features calculated from texture units describe the
texture at macro-level. This adaptive scenario facilitates the integration of the texture descriptors into an
unsupervised clustering based segmentation scheme that embeds a multi-resolution approach. The
conducted experiments evaluate the performance of these techniques and also analyse the influence of
important parameters (such as scale, frequency and orientation) upon the segmentation results.
1 INTRODUCTION
Texture-based image segmentation represents a
major field of research in the area of computer
vision that has been intensively investigated for
more than three decades. This has been motivated by
the fact that the robust detection of texture
primitives in digital images plays a key role in the
identification of the constituent image regions.
Taking into consideration the large spectrum of
applications based on texture analysis, an impressive
number of approaches has been published in the
computer vision literature. As indicated in several
reviews on texture-based segmentation (Tuceryan
and Jain, 1998; Materka and Strzelecki, 1998) the
existent techniques can be classified into four major
categories: statistical, model-based, signal
processing and structural. From these approaches
most attention received the statistical and signal
processing texture extraction methods.
Statistical methods are based on the evaluation of
the spatial distributions and relationships between
the pixel intensities in the image. Relevant statistical
texture analysis techniques include the
autocorrelation function (Haralick, 1979), texture
energy features (Laws, 1980), grey-level co-
occurrence matrices (Haralick, 1979) and Local
Binary Patterns (Ojala and Pietikainen, 1999). Based
on the studies detailed in relevant papers focused on
statistical texture analysis it can be concluded that
these methods return adequate results when applied
to synthetic images, but their performance is limited
when applied to complex textured images.
To address some of the limitations associated
with standard statistical texture analysis techniques,
a non-parametric approach that analyses the texture
at micro-level based on the calculation of the Local
Binary Patterns (LBP) has been introduced by Ojala
and Pietikainen, 1999. This approach attempts to
decompose the texture into small units where the
texture features are represented by the distribution of
the LBP values. In (Ojala et al, 2002) the authors
extended the initial LBP approach to address its
sensitivity to rotation by introducing a new multi-
resolution rotational invariant LBP texture descriptor
whose performance was evaluated on standard
texture databases.
The signal processing methods represent another
important category of texture analysis techniques.
These techniques were developed as a consequence
of the psychophysical investigations that indicated
134
Ilea D., Whelan P. and Ghita O. (2010).
UNSUPERVISED IMAGE SEGMENTATION BASED ON THE MULTI-RESOLUTION INTEGRATION OF ADAPTIVE LOCAL TEXTURE DESCRIPTORS.
In Proceedings of the International Conference on Computer Vision Theory and Applications, pages 134-141
DOI: 10.5220/0002822301340141
Copyright
c
SciTePress

that the human brain performs a frequency analysis
of the image perceived by the retina. Building on
this concept, the signal processing techniques
formulate the texture extraction in terms of the
frequency information associated with the texture
primitives present in digital images. Representative
methods that belong to this category are: spatial
domain filtering, Fourier analysis, Gabor filtering
and Wavelet analysis. Among these signal
processing methods, the approach that involves
filtering an image with a bank of Gabor filters has
gained the largest interest from the vision
researchers (Bovik et al, 1990; Jain and Farrokhnia,
1991; Hofmann et al, 1998, Randen and Husoy,
1999). This approach implements a multi-channel
texture decomposition and it is achieved by filtering
the input image with 2D Gabor filter banks. (Bovik
et al, 1990) used quadrature Gabor filters to segment
images defined by oriented textures. The main
conclusion resulting from their investigation is that
the spectral difference sampled by narrow band
filters provides sufficient information for texture
discrimination. (Jain and Farrokhnia, 1991) followed
a similar approach and developed a multi-channel
Gabor filtering technique that was applied for image
segmentation. In their paper, each filtered image was
subjected to a non-linear transform and the energy
was calculated within a pre-defined window around
each pixel in the image. The energy features were
afterwards clustered using a standard algorithm to
obtain the segmented image. This approach was
further advanced by (Randen and Husoy, 1999)
while noting that filtering the image with a bank of
Gabor filters or filters derived from Wavelet
transform is computationally intensive. In their
paper they proposed a new methodology to compute
optimised filters for texture discrimination that
requires a reduced number of filters than the
standard implementation developed by Jain and
Farrokhnia. A different segmentation strategy is
proposed by (Hofmann et al, 1998) where the texture
segmentation is formulated as a data clustering
problem. In their approach the dissimilarities
between pairs of textured regions are computed from
a multi-scale Gabor filtered image representation.
The resulting unsupervised segmentation scheme
was successfully applied on both Brodatz textures
and natural images.
Recently a novel hybrid statistical-structural
approach was proposed where the texture is
described in terms of the distribution of edge
orientations calculated at micro and macro-level for
all pixels in the image (Ilea et al, 2008; Ghita et al,
2008). The quantitative evaluations were conducted
on standard texture databases and the results
indicated that the local image orientation based
descriptor has a high discriminative power in the
context of texture classification. In this study we will
investigate its discrimination when applied to the
unsupervised segmentation of complex textural
arrangements.
The unsupervised segmentation process is in
particular challenging since the texture attributes are
not uniformly distributed within image areas defined
by similar objects and often the strength of the
texture can vary considerably from image to image.
In addition to this, complications added by the
uneven illumination, perspective and scale
distortions make the process of identifying the
homogeneous image regions with similar texture
characteristics extremely difficult. The quantitative
evaluation of the texture extraction techniques
investigated in this paper was carried out using a
segmentation framework similar to the one proposed
in (Ilea and Whelan, 2009). The selection of this
clustering-based segmentation technique for texture
segmentation is justified as it provides an attractive
platform for generalization and it also performs a
global data optimization.
The selection of the texture analysis techniques
evaluated in this study (the Local Binary Pattern
Operators, texture decomposition using Gabor
filtering and local orientation-based texture
descriptor) is also justified, as they allow an adaptive
texture analysis (at micro and macro-level) when
integrated into an unsupervised clustering approach.
The adaptive approach considered in this paper
provides a robust scenario for texture segmentation
and together with a comprehensive numerical
evaluation of the above mentioned methods it
represents a contribution of this paper in the study of
texture features segmentation.
This paper is organised as follows. Section 2
briefly introduces the texture analysis methods
investigated in this study and discusses the
motivation behind their selection. Section 3
describes the experimental setup and presents the
numerical evaluation followed by a discussion of the
obtained results. Section 4 concludes the paper.
2 EVALUATED TEXTURE
EXTRACTION METHODS
The Standard LBP/C Operator - The LBP
operator (Ojala and Pietikainen, 1999) is a powerful
texture descriptor as it analyses the texture at micro-
UNSUPERVISED IMAGE SEGMENTATION BASED ON THE MULTI-RESOLUTION INTEGRATION OF
ADAPTIVE LOCAL TEXTURE DESCRIPTORS
135

level, but at the same time the macro characteristics
of texture are sampled by the distribution of the LBP
values. The LBP texture unit is calculated by
thresholding the values of the pixels in a 3×3
neighbourhood with respect to the value of the
central pixel, while the LBP value is calculated by
multiplying the elements of the texture unit with
binomial weights (that are powers of 2 with respect
to the position of the pixels in the neighbourhood)
and summing the result.
To further improve the robustness of the LBP
operator and allow the sampling of the illumination
offsets between different textures, the standard LBP
operator is used in conjunction with the contrast
operator, C. The contrast measure C is calculated as
the difference between the average grey-level of the
pixels with values 1 and the pixels with values 0
contained in the 3×3 texture unit. The main
advantage of analysing the texture using the
distribution of LBP/C values is given by the fact that
they can be used to discriminate textures in the input
image regardless the region size. The distribution of
the LBP/C values calculated over an image region
represents the texture spectrum that can be defined
as a joint histogram of size (256 + bins), where the
first 256 bins are required by the distribution of the
LBP values and bins represents the number of bins
employed to sample the contrast measure. Based on
the experiments performed by Ojala and Pietikainen,
the best results are obtained when the contrast
distribution is quantised into 4 to 16 bins. The
optimal selection of the number of bins is a difficult
issue since for low values of bins the histogram will
lack resolution, while for high values of bins the
histogram will become sparse and unstable. Based
on experimentation it has been demonstrated that a
quantisation of the contrast measure in 8 bins returns
the best results.
The Rotation Invariant LBP Operator (LBP
ri
) -
The standard LBP values calculated for each texture
unit are sensitive to texture orientation. This is
motivated by the fact that the elements of the texture
unit uniquely encode the position of each pixel in the
3×3 neighbourhood. To remove the sensitivity to
rotation, the texture descriptor is calculated within a
circular neighbourhood and the texture is evaluated
in terms of uniformity. A uniform pattern is defined
as the number of transitions between 0 and 1 in the
LBP mask obtained after thresholding the pixels
from the circular neighbourhood with the intensity
value of the central pixel. In this way, the authors
defined a pattern as uniform if the binary LBP
pattern has maximum two transitions; otherwise the
pattern is labelled as non-uniform. To improve its
discriminative power, the LBP
ri
value is
complemented with the contrast measure that is
calculated as the variance of the pixels situated in
the LBP mask. For more details regarding the
calculation of the LBP operators, the reader can refer
to (Ojala and Pietikainen, 1999; Ojala et al, 2002).
Texture Analysis using Gabor Filters is an
approach that implements a multi-channel texture
decomposition and is achieved by filtering the input
image with a two-dimensional (2D) Gabor filter
bank that was introduced by (Daugman, 1988) and
later applied to texture segmentation by (Jain and
Farrokhnia, 1991). The 2D Gabor function that is
used to implement the even-symmetric 2D discrete
filters can be written as follows:
'2cos)
2
''
exp(),(
2
22
,,
fx
yx
yxG
f
(1)
In equation (1)
sincos
'
yxx ,
cossin
'
yxy , σ is the scale parameter of the
Gabor filter,
is the orientation and f is the
frequency parameter that controls the number of
cycles of the cosine function within the envelope of
the 2D Gaussian (
is the phase offset and it is
usually set to zero to implement 2D even-symmetric
filters). The parameters of the Gabor filters are
chosen to optimise the trade-off between spectral
selectivity and the size of the bank of filters.
Typically, the central frequencies are selected to be
one octave apart and for each central frequency is
constructed a set of filters corresponding to four (0
0
,
45
0
, 90
0
, 135
0
) or six orientations (0
0
, 30
0
, 60
0
, 90
0
,
120
0
, 150
0
).
Texture Extraction using the Dominant Image
Orientation at Micro and Macro-levels is an
approach defined in terms of the distribution of the
dominant edge orientations at micro and macro-level
and was introduced in (Ilea et al, 2008; Ghita et al,
2008). In this regard, the orientation for each pixel in
the image is extracted using the partial derivatives of
the Gaussian function (G) while the main focus is
the evaluation of the local dominant orientation.
An important parameter is the scale (σ) of the
Gaussian function and its role is to control the
amount of noise reduction. After the calculation of
the partial derivatives, the weak edge responses were
eliminated by applying a non-maxima suppression
procedure (Canny, 1986) and the edge orientation is
calculated. As indicated in (Ilea et al, 2008), the
problem of analysing the texture orientation at a
given observation scale is not a straightforward task
VISAPP 2010 - International Conference on Computer Vision Theory and Applications
136

as the orientation of textures may be isotropic at
macro-level but having a strong orientation at micro-
level. Therefore, we propose to evaluate the
dominant orientation of the texture calculated at
micro-level for all texture units that are defined as
the local neighbourhood around each pixel in the
image, while the distribution of the dominant
orientations calculated for all texture units is
employed to capture the dominant orientation of
texture at macro-level.
In this implementation, the orientation of the
texture is determined by constructing the histogram
of orientations for all pixels in the local
neighbourhood and the dominant orientation is
selected as the dominant peak in the histogram as
follows,
)2/(
)2/(
)2/(
)2/(
)),,(( ),,(
][0,2 D ,),,(),(
wx
wx
wy
wy
Di
iyxiyxh
iyxhyxH
(2)
ji
ji
ji
0
1
,
),(
),(
),(
yxfG
yxfG
arctgyx
x
y
and
)max(arg
H
d
(3)
In equations (2) and (3), Θ is the local
orientation, the symbol defines the convolution
operation,
yGG
y
/ , xGG
x
/ , f(x,y) is the
pixel value at position (x,y) in the original image, i is
the orientation bin, D defines the orientation domain,
H (x,y) is the distribution of the local orientations
calculated around pixels situated at positions (x,y)
and Θ
d
is the dominant texture orientation in the
neighbourhood w×w. The dominant orientation at
macro-level (H
Θd
) is estimated by the distribution of
the local dominant orientations that are determined
over the region of interest as follows,
diyxH
Di
ww
d
d
)),,((
(4)
where Γ is the image domain. In equation (4) it
should be noted that the texture orientation is
sampled at a pre-defined observation scale that is
controlled by the size of the neighbourhood w×w.
The dominant orientation is not robust in
sampling the difference between textures that are
subjected to illumination variation. Thus, the local
texture orientation is augmented with measures such
as local orientation coherence and contrast (C) that
are calculated in the local neighbourhood w×w
where the dominant orientation of the texture has
been estimated. The contrast measure (C) is sampled
by the mean grey-scale value calculated in the w×w
neighbourhood and the orientation coherence (Θ
c
) is
calculated using the weighted standard deviation of
the edge orientation of all the pixels in the
neighbourhood w×w.
3 EXPERIMENTS AND RESULTS
In this paper, we have modified the computational
architecture of the segmentation framework
proposed in (Ilea and Whelan, 2008) in order to
provide a robust scenario for texture segmentation.
The main steps of the proposed texture segmentation
algorithm are illustrated in Figure 1. It is important
to mention that the texture features are
independently extracted from the luminance
component of the input image to exclusively
evaluate the texture information.
Input Image
Number of
clusters
k
Texture
Features
ASKM
Segmented
Image
Figure 1: Overview of the texture segmentation algorithm.
The Adaptive Spatial K-means (ASKM)
clustering is the main component of the
segmentation method. The main idea behind ASKM
is to minimise an objective function J
T
based on the
fitting between the local texture distributions
calculated for each pixel in the texture image and
global texture distributions calculated for each
cluster as follows,
width
x
height
y
k
i
i
T
ss
T
s
T
HyxHKSJ
11 1
]2525,...,33[
),,(min
(5)
In equation (5), k is the number of clusters, s×s
defines the size of the local window,
),( yxH
ss
T
is the
local texture distribution calculated for the pixel at
position (x,y) and
i
T
H is the texture distribution for
the cluster with index i respectively. The number of
clusters k is automatically calculated in conjunction
with the number of textures in the image as indicated
UNSUPERVISED IMAGE SEGMENTATION BASED ON THE MULTI-RESOLUTION INTEGRATION OF
ADAPTIVE LOCAL TEXTURE DESCRIPTORS
137
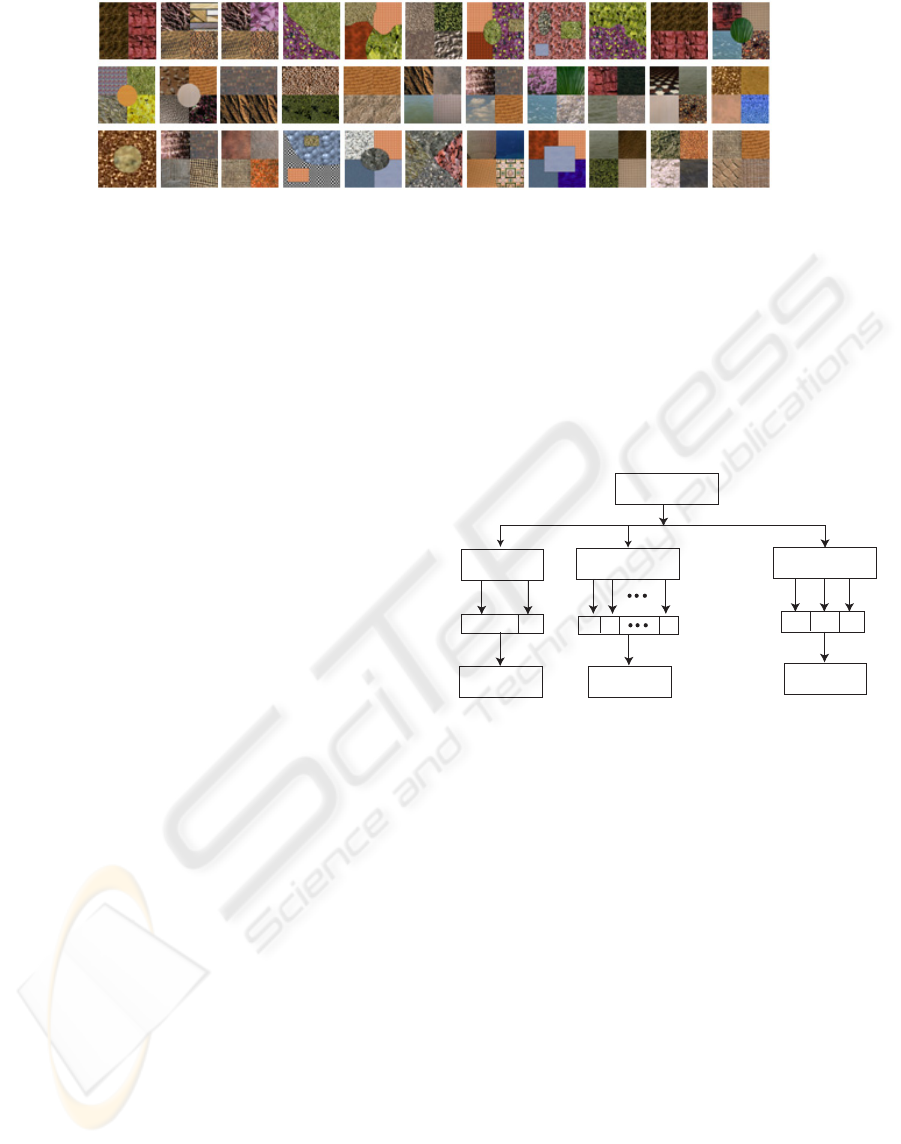
Figure 2: The database of 33 mosaic images used in our experiments.
in (Ilea and Whelan, 2008). The similarity between
the local texture distribution and the global texture
distribution of the clusters is evaluated using the
Kolmogorov-Smirnov (KS) metric (Rubner et al,
2001). The fitting between the local texture
distributions and global texture distributions of the
clusters is performed adaptively for multiple
window sizes in the interval [3×3] to [25×25]. While
textures in the image are not uniform, the multi-
resolution approach detailed in this paper offers an
attractive scheme for texture segmentation as it
allows the variation of the window size until the best
fit between the global and local texture distributions
is achieved.
Experimental Setup - Since the ground truth data
associated with complex natural images is difficult
to estimate and its extraction is highly influenced by
the subjectivity of the human operator, the texture
segmentation evaluation was performed on mosaic
data where the ground truth is unambiguous.
Therefore, the segmentation algorithm described in
the previous section was applied to a database of 33
mosaic images (image size 184×184) that were
created by mixing complex textures from (VisTex
2000) and Photoshop databases. The mosaics used in
these experiments consist of various texture
arrangements that also include images where the
borders between different regions are irregular. The
suite of 33 mosaic images is depicted in Figure 2.
The quantitative measurements were carried out
using the Probabilistic Rand Index (PR)
(Unnikrishnan and Hebert, 2005) that measures the
agreement between the segmented result and the
ground truth data and takes values in the range [0,
1]. A higher PR value indicates a better match
between the segmented result and the ground truth
data. The PR Index is defined in the appendix of this
paper. In this study, for every analysed texture
analysis technique, the PR mean and standard
deviation were computed for all images in the
database.The construction of the texture vectors is
illustrated in Figure 3. It can be noticed that the
feature vectors are defined either by the LPB/C joint
distributions or by the distributions calculated from
the responses obtained after filtering the image with
the multi-channel filter bank (the intensity values of
the filtered images were normalised in the interval
[0, 255] so the size of the feature vector is
256×number of filters in the filter bank). For the
edge orientation-based technique, the texture vector
is given by the joint distribution defined by the
dominant orientation (Θ
d
), the contrast (C) and the
orientation coherence (Θ
c
).
Texture Features
LBP operators
Gabor Filters
LBP
Contrast
ASKM
LBP C
4 or 6 oriented filters
ASKM
Local Orientation
Features
C
ASKM
Θ
Θ
d
c
Figure 3: The calculation of the texture distributions.
3.1 Results Returned by the LBP
Technique
The first set of tests evaluates the segmentation
performance when using the standard Local Binary Pattern
(LBP) and the rotation invariant LBP
ri
8,1
, LBP
ri
16,2
,
LBP
ri
24,3
texture descriptors. As indicated above, the
experiments were performed on a database consisting of
mosaic images and the numerical results are illustrated in
Table 1 (the LBP
ri
P,R
defines the rotation invariant LBP
operator where P is the number of pixels in the LBP mask
and R is the radius of the mask ).
The results illustrated in Table 1 indicate that the
LBP/C operator provides better discrimination in its
standard form than the rotation invariant LBP
ri
8,1
,
LBP
ri
16,2
, LBP
ri
24,3
descriptors. The LBP/C operator
returned the highest PR values for 21 out of 33
mosaic images, while the LBP
ri
8,1
operator returned
the lowest PR values for 13 images out of 33. The
drop in segmentation accuracy for rotation invariant
LBP descriptors indicates that the invariance to
rotation, as expected, is attained at the expense of
VISAPP 2010 - International Conference on Computer Vision Theory and Applications
138

the loss in discriminative power. This conclusion is
justified since the LBP uniform patterns are not able
to sample the directional characteristics of the
texture.
Table 1: Quantitative results when the LBP/C texture
descriptors were evaluated in the proposed segmentation
framework.
Method PR
mean
PR
standard_deviation
LBP/C 0.84 0.12
LBP
ri
8
,
1
/C 0.80 0.11
LBP
ri
16
,
2
/C 0.82 0.09
LBP
ri
24
,
3
/C 0.82 0.12
3.2 Results Returned by the Gabor
Filtering Technique
In order to evaluate the multi-channel texture
decomposition scheme based on Gabor filtering, the
input image has been processed with a small bank of
filters with four (0
0
, 45
0
, 90
0
, 135
0
) and six (0
0
, 30
0
,
60
0
, 90
0
, 120
0
, 150
0
) orientations. The central
frequency and the scale parameters were also varied.
The standard deviation (scale) parameter was set to
the values 1.0, 2.0 and 3.0 respectively, while the
central frequency parameter was varied by setting it
to the following values 1.5/2π, 2.0/2π and 2.5/2π,
respectively.
Table 2: Quantitative results when the Gabor filtering
(GF) technique was evaluated in the proposed
segmentation framework.
Scale (σ)
Method
PR
mean
PR
st_dev
σ= 1.0
GF f
= 1.5/2π, 4 angles 0.46 0.24
GF f
= 2.0/2π, 4 angles 0.61 0.17
GF f
= 2.5/2π, 4 angles 0.81 0.12
GF f
= 1.5/2π, 6 angles 0.50 0.26
GF f
= 2.0/2π, 6 angles 0.62 0.18
GF f
= 2.5/2π, 6 angles 0.81 0.12
σ = 2.0
GF f
= 1.5/2π, 4 angles 0.65 0.17
GF f
= 2.0/2π, 4 angles 0.83 0.10
GF f
= 2.5/2π, 4 angles 0.85 0.08
GF f
= 1.5/2π, 6 angles 0.65 0.17
GF f
= 2.0/2π, 6 angles 0.84 0.09
GF f
= 2.5/2π, 6 angles 0.85 0.08
σ = 3.0
GF f
= 1.5/2π, 4 angles 0.78 0.13
GF f
= 2.0/2π, 4 angles 0.85 0.08
GF f
= 2.5/2π, 4 angles 0.85 0.11
GF f
= 1.5/2π, 6 angles 0.79 0.12
GF f
= 2.0/2π, 6 angles 0.84 0.08
GF f
= 2.5/2π, 6 angles 0.86 0.08
3.3 Results Returned by the Local
Orientation-based Texture
Descriptor
In (Ilea et al, 2008; Ghita et al, 2008) a texture
descriptor based on the evaluation of the dominant
image orientation calculated at micro and macro-
level was proposed. In this section, experimental
results that quantify the performance of the image
orientation based texture descriptor in the
segmentation process are provided. For these
experiments the value of the parameter σ (that sets
the scale of the derivative of the Gaussian function)
is set to 0.5 and 1.0. The experimental results
illustrated in Table 3 indicate that the optimal results
are obtained when the scale parameter σ is set to 0.5.
Table 3: Quantitative results for the local orientation based
texture extraction technique when the window size is
varied.
Scale
(σ)
Window
size
PR
mean
PR
standard_deviation
σ = 0.5
3×3 0.83 0.12
7×7
0.82 0.11
11×11
0.82 0.12
σ = 1.0
3×3
0.81 0.12
7×7
0.81 0.12
11×11
0.81 0.11
There are two reasons behind the selection of this
value for the σ parameter. The first is motivated by
the fact that with the increase in the value of the
scale parameter the edges derived from weak
textures are eliminated and the second reason
consists in the requirement to increase the size of the
derivative of the Gaussian filters with the increase of
the scale parameter σ. The feature vectors for the
edge orientation technique are formed by the joint
distributions (see Figure 3) constructed using the
dominant orientation, the contrast and the orientation
coherence. The experiments were conducted on the
mosaic database when the size of the texture unit
w×w is varied. The experimental data shown in
Table 3 indicates that optimal performance is
obtained when the texture orientation is sampled in
small texture units and these results are motivated by
the fact that the texture orientation is best analysed
at micro-level.
UNSUPERVISED IMAGE SEGMENTATION BASED ON THE MULTI-RESOLUTION INTEGRATION OF
ADAPTIVE LOCAL TEXTURE DESCRIPTORS
139

4 CONCLUSIONS
The aim of this paper was to evaluate the
performance of a number of statistical and signal
processing texture analysis techniques when applied
to image segmentation. The techniques evaluated in
this study are: the LBP/C operators, multi-channel
texture decomposition based on Gabor filter banks
and a recently proposed texture analysis technique
based on the evaluation of the image orientation at
micro and macro-level. The main novelty associated
with this work resides in the evaluation of the
analysed texture descriptors in a multi-resolution
framework offered by the proposed texture
segmentation algorithm and in the evaluation of the
experimental results when the parameters associated
with these techniques are varied. Our experiments
show that the method based on texture
decomposition using Gabor filters marginally
outperformed the other analysed techniques. The
experimental data reinforced the concept that texture
is an important attribute of digital images and it also
indicates that the local orientation is the dominant
feature that provides the primary discrimination
between textures.
ACKNOWLEDGEMENTS
This work was funded in part by the HEA PRTLI IV
National Biophotonics & Imaging Platform Ireland
(NBIPI) and the Science Foundation Ireland
(Research Frontiers Programme).
REFERENCES
Bovik, A. C., Clark, M., Geisler, W. S.: Multi-channel
Texture Analysis Using Localized Spatial Filters.
IEEE Transactions on Pattern Analysis and Machine
Intelligence, Vol. 12, No. 1 (1990) 55-73
Canny, J.: A Computational Approach to Edge Detection.
IEEE Transactions on Pattern Analysis and Machine
Intelligence, Vol. 8, No. 6 (1986) 679-698
Daugman, J. G.: Complete Discrete 2D Gabor Transforms
by Neural Networks for Image Analysis and
Compression. IEEE Transactions on Acoustics,
Speech and Signal Processing, Vol. 36, No. 7 (1988)
1169-1179
Ghita, O., Whelan, P. F., Ilea, D. E.: Multi-resolution
Texture Classification Based on Local Image
Orientation. In Proceedings of the 5
th
International
Conference on Image Analysis and Recognition
(ICIAR), Portugal (25-27 July, 2008) 688-696
Haralick, R. M.: Statistical and Structural Approaches to
Texture. In Proceedings of the IEEE, Vol. 67, No. 5
(1979) 786-804
Hofmann, T., Puzicha, J., Buhmann, J. M.: Unsupervised
Texture Segmentation in a Deterministic Annealing
Framework. IEEE Transactions on Pattern Analysis
and Machine Intelligence, Vol. 20, No. 8 (1998) 803-
818
Ilea, D. E., Ghita, O., Whelan, P. F.: Evaluation of Local
Orientation for Texture Classification. In Proceedings
of the 3
rd
International Conference on Computer
Vision Theory and Applications (VISAPP), Portugal
(22 - 25 January 2008) 357-364
Ilea, D. E., Whelan, P. F.: CTex - An Adaptive
Unsupervised Segmentation Algorithm Based on
Colour-Texture Coherence. IEEE Transactions on
Image Processing, Vol. 17, No. 10 (2008) 1926-1939
Jain, A. K., Farrokhnia, F.: Unsupervised Texture
Segmentation Using Gabor Filters. Pattern
Recognition, Vol. 24, No. 12 (1991) 1167-1186
Laws, K. L.: Rapid Texture Identification. In Proceedings
of the SPIE Conference on Image Processing for
Missile Guidance, Vol. 238 (1980) 376-380
Materka, A., Strzelecki M.: Texture Analysis Methods – A
Review. Technical Report, University of Lodz, Cost
B11 Report (1998)
Ojala, T., Pietikainen, M.: Unsupervised Texture
Segmentation Using Feature Distributions. Pattern
Recognition, Vol. 32, No. 3 (1999) 477-486
Ojala, T., Pietikainen, M., Maenpaa, T.: Multiresolution
Grey-scale and Rotation Invariant Texture
Classification with Local Binary Patterns. IEEE
Transactions on Pattern Analysis and Machine
Intelligence, Vol. 24, No. 7 (2002) 971-987
Randen, T., Husoy, J. H.: Texture Segmentation Using
Filters with Optimised Energy Separation. IEEE
Transactions on Image Processing, Vol. 8, No. 4
(1999) 571-582
Rubner, Y., Puzicha, J., Tomasi, C., Buhmann, J. M.:
Empirical Evaluation of Dissimilarity Measures for
Colour and Texture. Computer Vision and Image
Understanding, Vol. 84, No. 1 (2001) 25-43
Tuceryan, M., Jain, A. K.: Texture Analysis. In: Chen,
C.H., Pau, L.F., Wang, P.S.P. (eds.): Handbook of
Pattern Recognition and Computer Vision, World
Scientific Publishing (1998)
Vision Texture (VisTex) Database, Massachusetts Institute
of Technology, MediaLab. http://vismod.media.mit.
edu/vismod/imagery/VisionTexture/vistex.html
Unnikrishnan, R., Hebert, M.: Measures of Similarity. In
Proceedings of IEEE Workshop on Computer Vision
Applications, Vol. 1 (2005) 394 – 394
APPENDIX
The Probabilistic Rand index (PR) was proposed in
(Unnikrishnan and Hebert, 2005) with the aim of
obtaining a quantitative evaluation of the
VISAPP 2010 - International Conference on Computer Vision Theory and Applications
140

segmentation result when compared to one or more
ground truth (manual) segmentations. Let S
test
be the
segmented image that will be compared against the
manually labelled set of ground truth images {S
1
,
S
2
,…, S
G
} (where G defines the total number of
manually segmented images). The segmentation
result is quantified as appropriate if it correctly
identifies the pairwise relationships between the
pixels as defined in the ground truth segmentations.
In other words, the pairwise labels
test
S
i
l
and
test
S
j
l
(corresponding to any pair of pixels x
i
, x
j
in the
segmented image S
test
)
are compared against the
pairwise labels
G
S
i
l and
G
S
j
l in the ground truth
segmentations and vice versa. Based on this
principle, the PR index is defined as follows:
ji
ji
ij
S
j
S
i
ij
S
j
S
i
Gtest
pllpll
N
SSPR
testtesttesttest
,
...1
)1(
2
1
}){,(
(6)
In equation (6) N is the total number of pixels in
the image,
testtest
S
j
S
i
ll
denotes the probability
that the pair of pixels x
i
and x
j
have the same label in
S
test
and p
ij
represents the mean pixel pair
relationship between the ground truth images.
G
g
S
j
S
i
ij
gg
ll
G
p
1
1
(7)
The PR index takes values in the interval [0, 1]
and a higher PR value indicates a better match
between the segmented result and the ground truth
data. The PR index takes the value 0 when there are
no similarities between the segmented result and the
set of manual segmentations and it takes the value 1
when all segmentations are identical.
UNSUPERVISED IMAGE SEGMENTATION BASED ON THE MULTI-RESOLUTION INTEGRATION OF
ADAPTIVE LOCAL TEXTURE DESCRIPTORS
141
