
EFFECTIVENESS OF VISUALISATIONS FOR DETECTION OF
ERRORS IN SEGMENTATION OF BLOOD VESSELS
B. W. van Schooten, E. M. A. G. van Dijk
Human Media Interaction, University of Twente, Enschede, Netherlands
A. Suinesiaputra, J. H. C. Reiber
LKEB, Leiden University Medical Center, Leiden, Netherlands
Keywords:
Volume visualization, Segmentation, Radiology, MRA, Visual cues.
Abstract:
Vascular disease diagnosis often requires a precise segmentation of the vessel lumen. When 3D (Magnetic
Resonance Angiography, MRA, or Computed Tomography Angiography, CTA) imaging is available, this
can be done automatically, but occasional errors are inevitable. So, the segmentation has to be checked by
clinicians. This requires appropriate visualisation techniques. A number of visualisation techniques exist, but
there has been little in the way of user studies that compare the different alternatives. In this study we examine
how users interact with several basic visualisations, when performing a visual search task, checking vascular
segmentation correctness of segmented MRA data. These visualisations are: direct volume rendering (DVR),
isosurface rendering, and curved planar reformatting (CPR). Additionally, we examine if visual highlighting
of potential errors can help the user find errors, so a fourth visualisation we examine is DVR with visual
highlighting. Our main findings are that CPR performs fastest but has higher error rate, and there are no
significant differences between the other three visualisations. We did find that visual highlighting actually has
slower performance in early trials, suggesting that users learned to ignore them.
1 INTRODUCTION
Vascular disease diagnoses can be done effectively by
means of 3D imaging techniques such as magnetic
resonance angiography (MRA) and computed tomog-
raphy angiography (CTA). We focus on contrast-
enhanced MRA as this is where our current expertise
lies (Suinesiaputra et al., 2009). With help of these
imaging techniques, the thickness of the inside of the
vessel (the vessel lumen) can be segmented precisely,
and assessed quantitatively. However, manual seg-
mentation is time-consuming. Segmentation can also
be done automatically, but occasional errors are cur-
rently inevitable. So we argue that, for both manual
and automatic segmentation, it is important to visu-
alise both segmentation and the raw data using ap-
propriate visualisation techniques, so that both can be
examined and compared at will.
A number of visualisations have been developed
to help interpret the 3D image data and the segmenta-
tion (see (van Schooten et al., 2009) for an overview).
However, there exists little in the way of clinical or
user studies that compare different visualisations.
We conducted an experiment where we compare
user performance (time taken and error rate) w.r.t.
different visualisations, by having users find errors
in a vascular-like structure with automatic segmen-
tation added. Navigation (translation and rotation)
is required to view the entire vessel. The four most
promising visualisations we consider are direct vol-
ume rendering (DVR) (Mueller et al., 2005) versus
several alternatives that provide extra cues for detect-
ing errors: curved planar reformation (CPR) (Kan-
itsar, 2004), isosurface, and explicit highlighting of
suspicious areas in the DVR in a different colour.
Our segmentation consists of a pathline and a tri-
angle mesh indicating the lumen. The pathline is a
line that goes through the lumen of the vessel, which
is determined as a first step of the automatic segmen-
tation process (Boskamp et al., 2004). The pathline
is also used for determining the curved plane in CPR.
Accuracy of current algorithms is high enough so that
the pathline is accurate in most areas, and is at least
close to the actual vessel in areas where it is inaccu-
77
W. van Schooten B., van Dijk E., Suinesiaputra A. and Reiber J. (2010).
EFFECTIVENESS OF VISUALISATIONS FOR DETECTION OF ERRORS IN SEGMENTATION OF BLOOD VESSELS.
In Proceedings of the International Conference on Imaging Theory and Applications and International Conference on Information Visualization Theory
and Applications, pages 77-84
DOI: 10.5220/0002821800770084
Copyright
c
SciTePress
rate. This is essential for using the CPR for examining
the segmentation.
The contrast-enhanced MRA imaging technique
detects a previously administered intravenouscontrast
agent. One advantage is that high densities almost
always represent blood vessels rather than other fea-
tures of the human body, so little pre-filtering is re-
quired to remove distractors and leave only the ves-
sels. A disadvantage is that density is not uniform
across the image: it may be lower in places where
blood flows less quickly. In some cases where blood
flow is blocked by a stenosis, a length of vessel may
even be blacked out. These features make it harder
for algorithms to segment the vessels.
It is our experience that segmentation errors are
usually close to a visually apparent local density de-
creases in the MRA. This indicates the most common
types of segmentation error: crossing through vessel
boundaries (in cases of high tortuosity or stenosis),
and thickness determination problems near bifurca-
tions. See fig. 1 for examples. If we assume there
is always a local density decrease, we can more eas-
ily assess the different visualisations. We will call this
the density deviation assumption. If we do not make
this assumption, our assessment depends on the par-
ticular segmentation algorithm.
In order to reason about visualisations in the light
of our error detection task, we define an error detec-
tion cue as a clear visual cue that shows that there is
a potential error in the segmentation. The cue may
be explicit, showing potential errors by explicit visual
highlighting such as a different colour, or implicit,
showing them by an easily interpreted visual configu-
ration. Any such cue can be argued to have a partic-
ular level of sensitivity (what percentage of errors are
detected) and specificity (how many false detections
are generated).
Perceptual studies on explicit error detection cues
have been made in several domains, including generic
perceptual stimuli, and perception in medical and se-
curity applications. (Fisher and Tan, 1989) and (Tam-
borello and Byrne, 2007) found that, for higher high-
lighting accuracies, response time progressively de-
creased for the accurate highlighting cases, but it also
progressively increased for the inaccurate cases. The
result is theoretically non-optimal, and in their study,
error detection cues had a detrimental effect. Other
studies found that for the presence of false alarms,
users double-check the data (Dixon et al., 2007), re-
sulting in slower performance, or overrely on the
cues, resulting in higher error rate (Maltz and Shinar,
2003). Additionally, distinction of visual elements by
highlighting helps focussed attention but hinders inte-
grative attention (that is, when all visual stimuli need
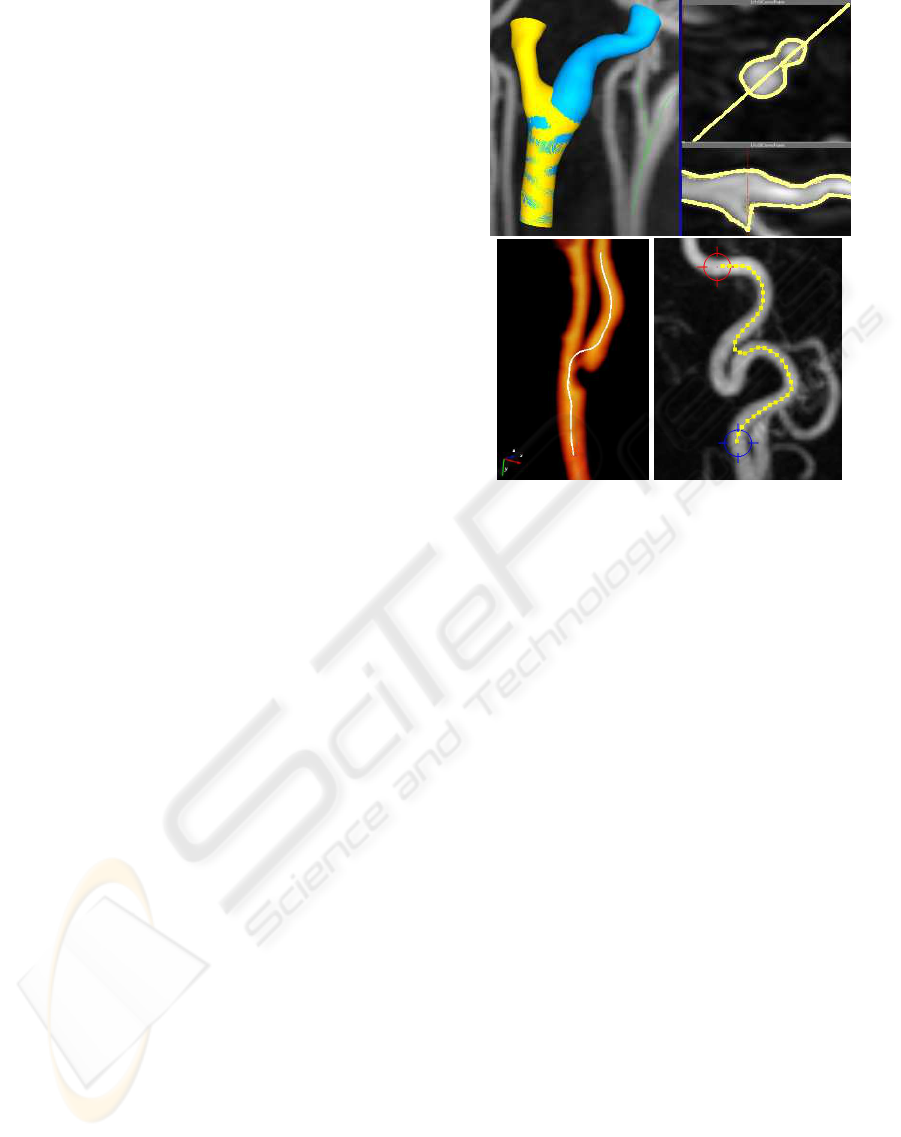
Figure 1: Density deviation around error areas in real life
data. Top: segmentation error in bifurcation. Top left: a bi-
furcating vessel with separate segmentations for each bifur-
cation. Top right: cross-sections of the bifurcating vessel,
showing that the blue (right side) segmentation follows par-
tially down the wrong vessel. Bottom left: the pathline by-
passes a stenotic area in the right bifurcation. Bottom right:
segmentation error in tortuous area. The pathline skips part
of the vessel’s curvature.
to be integrated) (Wickens and Andre, 1990). An-
other detrimental effect is called attention tunneling,
which means the highlights distract the user from see-
ing other elements in the scene (Yeh and Wickens,
2001).
We shall now focus on the four visualisations that
we shall evaluate. See fig. 2.
• DVR is a commonly used visualisation. We vi-
sualise the segmentation in DVR by means of a
wireframe mesh. DVR will show most segmen-
tation errors clearly, but only when the model is
rotated suitably. The error detection cues are im-
plicit.
• CPR is a curved cross-section, following a ves-
sel’s pathline. This results in useful cross-
sectional information along the entire vessel, ca-
pable of removing distracting parts of the volume
data (Achenbach et al., 1998). Because our ves-
sels curve in all directions, we use the straightened
variant of CPR, where the cross-section is topo-
logically distorted so that the pathline becomes a
straight line. The intersection of the segmenta-
tion with the curved plane is represented as a line.
IVAPP 2010 - International Conference on Information Visualization Theory and Applications
78
This enables the user to see immediately where
the segmentation crosses a lower-density area, in
most cases without any rotation. The visual cue is
simply the line not following the densest parts of
the vessel. This is an implicit error detection cue.
• Isosurface has strong error detection cues for a
properly chosen density threshold and raw data
with relatively uniform density. Then, the seg-
mentation goes outside of the surface boundary
where an error occurs. This can be explicitly visu-
alised using occlusion cues, though some camera
rotation may be required to see them. This capa-
bility has 100% specificity under the density de-
viation assumption, but less than 100% sensitivity
because areas where the segmentation is thinner
than required are not marked.
A disadvantage is that for realistic data with non-
uniform density, a plain isosurface often will not
be representative for the vessel lumen. Never-
theless, we argue that the potential benefits of
isosurface-type approaches are worth studying.
• Suspicious area highlighting. Here, an algo-
rithm marks the suspicious areas, using knowl-
edge of typical segmentation errors. In some
cases, the segmentation algorithm itself outputs
a credibility level for every part of its output, in
which case suspicious area information will be
easy to obtain. In model based algorithms for ex-
ample, low conformance to the model naturally
signals a suspicious area (Levy et al., 2007). The
areas can be shown as visual highlights in almost
any visualisation. We show them in DVR in our
study.
Suspicious area highlighting can be considered
experimental, but has been most actively re-
searched in colonoscopy and mammography. One
clinical study on mammography found it useful
(Freer and Ulissey, 2001). Here, they help the
clinician find the locations of resp. polyps and
masses/microcalcifications. An algorithm param-
eter α can trade off sensitivity for specificity.
In the areas of colonoscopy and mammography,
some of these algorithms manage to reach near
100% sensitivity (i.e. no false negatives) while
minimising false positives to an acceptable level
(i.e. not needing to mark a substantial part of the
image) (Hong et al., 2006; L´opez-Aligu´e et al.,
2004). Others only manage 85%-90% sensitivity
(Wang et al., 2007) or less.
There has been more limited research in the area
of segmentation error detection. (Levy et al.,
2007) proposes an error detection algorithm for
bladder segmentation. It can reach 100% sensi-
tivity only by raising false positives to an unac-
ceptable level (i.e. by marking a substantial part
of the image). (Levinski et al., 2009) also marks
suspicious areas in their brain segmentation sys-
tem. They claim an efficiency improvement of
a factor 5 for their overall segmentation system,
but the benefits of the suspicious area highlight-
ing system by itself are unclear. Both proposals
make use of knowledge of or internal parameters
within the segmentation algorithm.
Table 1: The four visualisations.
Name type sensit. specif. requires
rotation
DVR implicit 100% 100% yes
CPR implicit 100% 100% rarely
Isosurf. explicit <100% 100% yes
Susp.Ar. explicit depends depends no
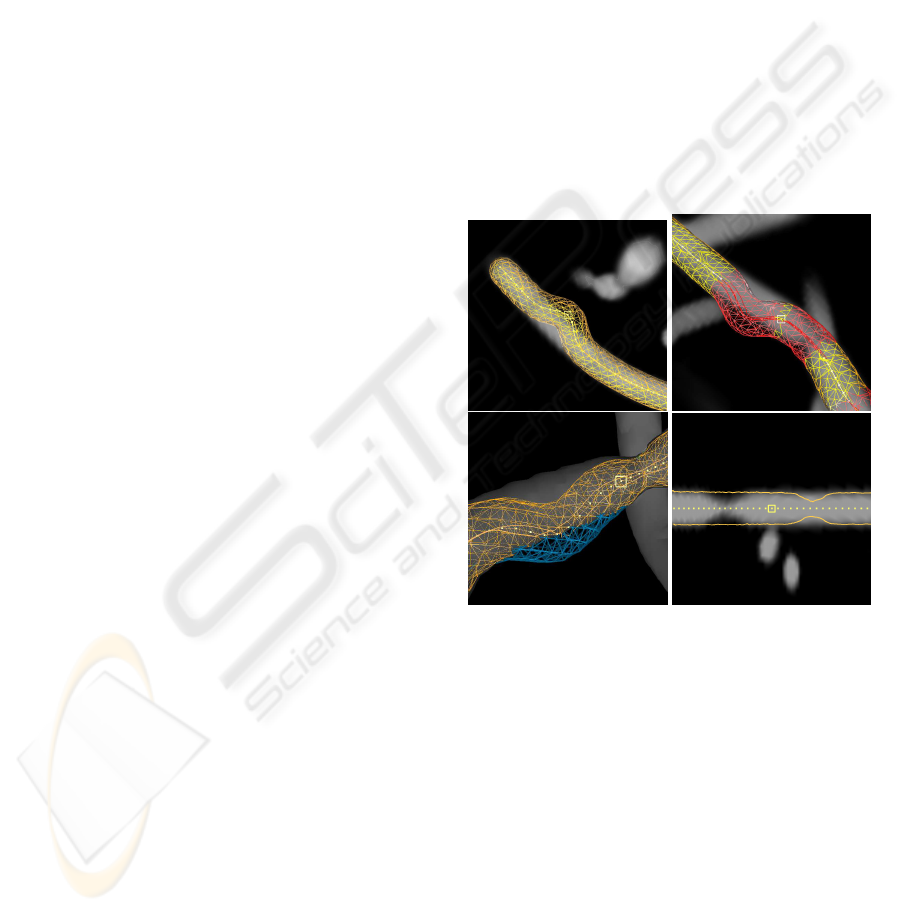
Figure 2: The visualisations used in the experiment. The
pictures visualise software phantoms with two types of ar-
tificial segmentation errors: veering errors (segmentation
veers from vessel) and thickness errors (segmentation and
vessel thickness do not match). Top left: DVR with veer-
ing error in the center. Top right: DVR with suspicious
area highlighting in red; highlighted veering error at top
left, highlighted thickness error at bottom right. Bottom
left: isosurface with veering error in the middle; the seg-
mentation is marked in blue where it sticks out. Bottom
right: CPR with thickness errors at the left and right.
2 EXPERIMENTAL DESIGN
2.1 Task
In our study, users had to perform a visual search task
that consists of checking the correctness of automatic
EFFECTIVENESS OF VISUALISATIONS FOR DETECTION OF ERRORS IN SEGMENTATION OF BLOOD
VESSELS
79

Figure 3: Left: real life data (MRA of carotid arteries).
Right: typical software phantom.
segmentations of vessels in MRA scans.
The MRA scans are artificially generated (also
known as software phantoms), along with segmenta-
tions with artificially generated segmentation errors.
This way it is easy to generate dozens of cases with
a clear distinction between correct and erroneous, an
unambiguous ground truth, and similar difficulty lev-
els. We generated these software phantoms in a way
similar to previous work (van Schooten et al., 2009).
See also (Rolland et al., 1995) for a similar approach.
A vessel is constructed using a sum of sine waves.
Three distractors vessels were added in each phantom.
Thickness of the vessel was varied in a stylized man-
ner with thinner and thicker areas. When looking at a
cross-section, density in the center of the vessel was
highest, gradually lowering towards the boundaries of
the vessel, and zero outside of the vessel. No noise
or other distractors were added, neither were bifurca-
tions present. See figure 3.
Errors are defined as a deviation between the seg-
mentation and the densest parts of the volume. Only
three error types exist: a veering away of the pathline
and segmentation from the vessel, the segmentation
being thinner than the vessel, and the segmentation
being thicker. These are explained to the user as part
of an interactive tutorial. See figure 2.
We generated 6-8 segmentation errors per model,
with approximately equal numbers of veering and
thickness errors. The number of errors was varied
to ensure the search was not self-terminating. Addi-
tionally, we generated suspicious areas for the visual
highlighting condition. Both false positives and nega-
tives were generated: between 1 and 3 of each in each
trial, yielding an average of 25% false positive and
negatives.
2.2 Controls
Because of the limited amount of previous research,
our choice of navigation controls is partially ex-
ploratory. We chose controls to be as simple as pos-
sible without sacrificing user control. We did want
users to be able to rotate and zoom at will. Control
is with the mouse only, and each button is designed to
map to a single function as much as possible. We have
two essentially different navigation methods, namely
CPR (essentially 2D, plus rotation around the vessel
axis), and the 3D visualisations.
One major choice we made is to base naviga-
tion on the pathline. The camera is always centered
around a point on the pathline. This greatly reduces
the number of degrees of freedom required for 3D
navigation and makes it much easier to do with a reg-
ular (2D) mouse. This does assume that the pathline,
if not accurate, is at least in the vicinity of the target
vessel, which we found to be true in our experience.
The user can navigate along the pathline by either
using the mouse wheel or by clicking on a pathline
point with the middle mouse button (MMB). In 3D,
the camera is also rotated so that the relative angle of
the vessel w.r.t. the viewer remains the same.
In 3D, the model is rotated by moving the mouse
while the right mouse button (RMB) is held. A stan-
dard “two-axis valuator” method is used (Bade et al.,
2005). A fourth button below the left button (the left
side-button or LSMB) was used to zoom and rotate
around the view axis, by resp. moving the mouse ver-
tically and horizontally with the button pressed. In
CPR, there is only one rotational degree of freedom.
Both the RMB + moving vertical, or the LSMB +
moving horizontal, was used to rotate around the ves-
sel axis.
The camera starts in the middle of the vessel and
is zoomed out to provide an overview. We chose to do
this so users do not get disoriented. We did ask users
to proceed systematically, that is, from end to end.
The selection of errors is designed to take as little
effort as possible; the user’s task concentrates only on
finding the errors. When the user clicks with the left
button (LMB–this is a traditional choice that many
users like) on a part of the pathline that contains an
error, the error is selected.
2.3 Setup
We used an within-subjects design for the four con-
ditions, which we name: DVR, DVRSUS (DVR with
suspicious areas highlighted in red), ISOSURF (Iso-
surface with non-occluded segmentation shown in
blue), and CPR. The pathline was visualised in yel-
low, the segmentation either as an orange mesh (in
3D) or as an orange line intersecting the CPR plane
(in CPR). Each condition was repeated four times.
Trials took about 25-80 seconds. All users received
the same set of software phantoms in the same order,
but with different, randomly ordered and counterbal-
anced, conditions. The users had to complete 4 trials
per condition, totaling 16 trials. This was achieved by
IVAPP 2010 - International Conference on Information Visualization Theory and Applications
80

cycling through the conditions 4 times, each time in a
different order, effectively counterbalancingfor learn-
ing effects within a single session. Total time for the
entire session was about 30-40 minutes. At the end
of a trial, time taken and number of errors made was
recorded, and shown to the user, before the next trial
began. The experiment was concluded with a subjec-
tive survey. See table 2.
The subjects were seated in a comfortable chair
about 70 cm away from a 24” computer screen. An
experimenter was seated behind them. The controls
and task were explained and trained in a 12-15 minute
interactive tutorial.
2.4 Participants
Because we used somewhat stylised models, medical
laypersons could easily do the task. Since our re-
search concerns usability involving novel interaction
techniques, we asked experts on user interfaces rather
than medical experts to perform our experiment, so
as to reduce learning difficulties and get better feed-
back. We recruited 12 participants from the Human
Media Interaction department of our CS faculty, in-
vited through personal invitation.
The users’ ages ranged from 25 to 51 years, with
an average of 32, and 2 users above 40. Four users
were female. Most were Ph.D. students, but there
was 1 student and 3 who finished their Ph.D. All users
used the mouse in their right hand.
As regards experience, all were highly experi-
enced computer users, and about half also had ex-
perience with actual development of user interfaces.
None had experience with medical 3D scans, except
one user who claimed occasional experience. Most
users had occasional 3D CAD/modelling experience
except 2 who had intensive experience and 3 who had
none.
3 RESULTS
3.1 Main Results
Overall, there were no real problems with interaction,
and the task was successfully performed by all users.
Users quickly learned to identify errors with help of
the tutorial. Some users kept making mistakes in the
controls during the main trial (pressing the wrong but-
tons), but none of these mistakes were costly in terms
of ruining the task performance. Most mistakes could
be corrected in a fraction of a second. The error rate
(number of errors missed and falsely identified errors)
was near zero for almost all users. Users found the
graphical render quality good, with all users finding
the animation smooth enough, and only 3 users find-
ing some details somewhat hard to see. See table 3.
We expect time performancedata to be multiplica-
tive rather than additive, so to analyse time perfor-
mance, we transformed the data using the log trans-
form. We used a second transformation to increase
sensitivity. It is based on the fact that the sequence of
trials was the same for all users. We divided the time
for each trial by the overall average of that trial over
all users (note that all conditions occurred equally of-
ten). This has the effect of normalising for variations
in trial difficulty.
We then performed a repeated-measures ANOVA
with a Sidak post-hoc analysis. (F(3,33) =
16.384, p <= 0.0005). We found that CPR was by far
the fastest (p = 0.008). This seems to be attributable
to the fact that users could see all errors without need-
ing to rotate. However, differences between the other
visualisations were not significant. The averages were
also very close to each other, see the following table.
cond. CPR DVR DVRSUS ISOSURF
perf.(s) 43.28 60.44 68.00 64.96
Because of the difficulty of the task, we may ex-
pect learning effects to occur during the experiment.
If we look at the progress over time, it seems that
the conditions go through different learning curves.
DVRSUS and ISOSURF seem slower at first, then be-
come equally fast as DVR.
We analysed the learning effect by grouping the
trials into four phases. Recall that one session con-
sists of four cycles, each cycling through all four con-
ditions. We analysed each cycle separately, as well as
cycle 1 and 2 together (the first eight trials) and cycle
3 and 4 together (the last eight trials). The average
time performance over all users for each of these cy-
cles is plotted in figure 4. Different learning effects
are apparent, especially in cycle 1. For each cycle,
we used again a repeated-measures Anova with Sidak
post-hoc analysis, considering all conditions except
CPR. We found that DVR was faster than DVRSUS
in the first eight trials (p = 0.015), and also that DVR
was faster than both DVRSUS and ISOSURF in the
first four trials (p <= 0.036). No other significant
differences were found.
While these results are tentative, we can conclude
that DVRSUS and ISOSURF have a steeper learn-
ing curve, possibly caused by users learning to pro-
cess the cues, or ignore them. This is consistent with
our qualitative observations, which indicate that users
spent a noticeable amount of time double-checking
the suspicious areas, which gradually became less.
One user even remarked: you quickly learn to ignore
the suspicious areas. At the end of the experiment
EFFECTIVENESS OF VISUALISATIONS FOR DETECTION OF ERRORS IN SEGMENTATION OF BLOOD
VESSELS
81
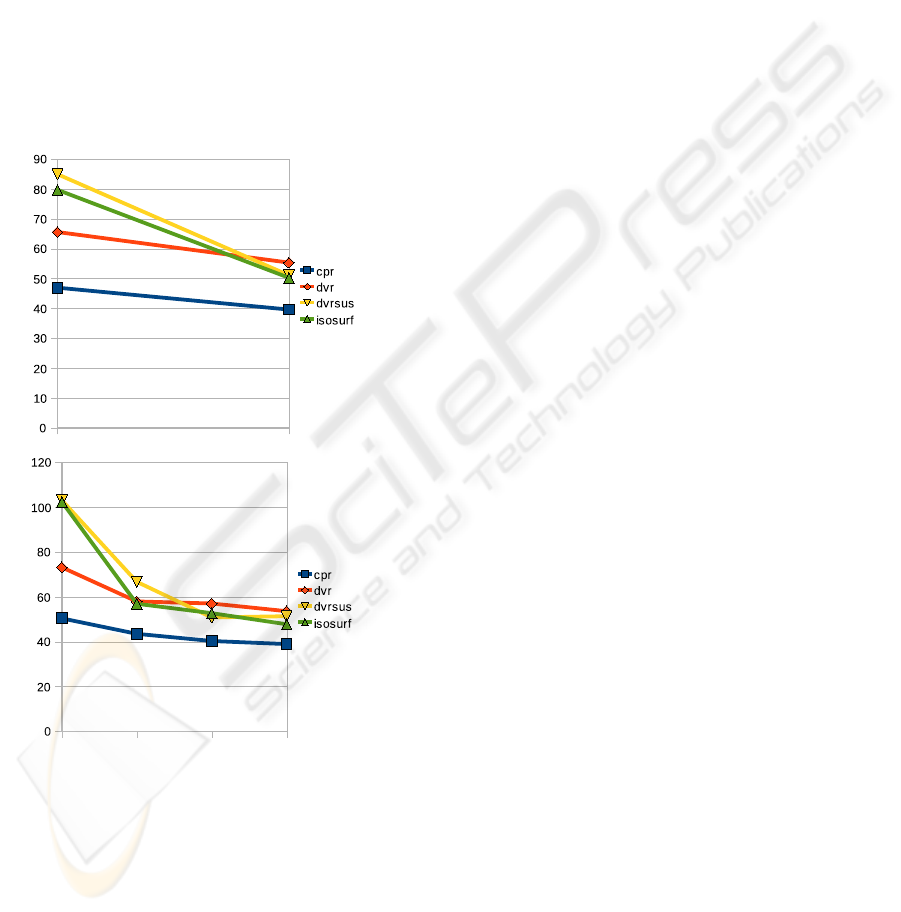
Table 2: List of all mean time performance variables and all subjective variables, and the scales used.
times: mean grand-mean, mean-DVR, mean-DVRSUS, mean-ISOSURF, mean-CPR (means of all
trials, and all trials under each of the four conditions)
difference diff-DVR-DVRSUS, diff-DVR-ISOSURF, diff-DVR-CPR (differences calculated as
(mean
cond1
− mean
cond2
)/grandmean)
user-subjective:
general clarity (details and contrast) {sufficient, somewhat hard to see, hard to see}
animation {smooth, a bit jerky, too jerky, can’t tell}
visualisation CPR (5-point scale, from strongly prefer CPR to strongly prefer 3D)
occlusion (5-point scale, from strongly prefer occlusion cues to strongly prefer no
occlusion cues)
suspicious (5-point scale, from strongly prefer suspicious areas to strongly prefer no
suspicious areas)
navigation wheel (5-point scale, from strongly prefer mouse wheel to strongly prefer middle
mouse button)
Figure 4: Performance improvement over time. The Y axis
denotes average trial performance in seconds. Top: first 8
trials versus last 8 trials. Bottom: from left to right: trials
1-4, 5-8, 9-12, and 13-16.
however, DVRSUS and ISOSURF fail to provide sig-
nificant improvement, although there may be a small
improvement which can only be measured by a more
sensitive experiment.
Mistakes (user errors) were made in 17% of the
trials, most of which were single mistakes. If we con-
sider the number of mistakes per clickable vessel re-
gion, only 3.4% of the user selections were erroneous,
almost all of which were omitted regions. We anal-
ysed mistakes by means of a χ
2
table, assuming that
trials and selection of selectable regions are indepen-
dent events.
condition trials segm.
errors
mistakes trials
w/ mis-
takes
CPR 48 336 19 16
DVR 48 336 12 7
DVRSUS 48 336 10 7
ISOSURF 48 336 5 3
A χ
2
goodness of fit test over trails with and
without mistakes reveals χ
2
(3,N = 192) = 13.3, p =
0.0041, a χ
2
test over total segmentation errors and
total number of user mistakes reveals a lower value,
χ
2
(3,N = 1344) = 9.094, p = 0.028, but still signifi-
cant. Apparently, users made more mistakes in CPR
and possibly less in ISOSURF. Contrary to theory,
we did not find that users made more mistakes in the
explicit-cues conditions DVRSUS and ISOSURF.
We will now consider subjective preferences. See
table 3. Users’ preferences for the different condi-
tions were not always consistent with their perfor-
mance. Users were strongly divided about CPR, ei-
ther preferring or dispreferring it strongly, with an av-
erage slightly below neutral, even though CPR scores
significantly faster on average. We used the non-
parametric Kendall’s τ to check if there was a corre-
lation between preference and time performance. We
found a significant positive correlation, both absolute
(mean-CPR: p = 0.046) and relative (diff-DVR-CPR:
p = 0.004).
As concerns occlusion cues and suspicious area
highlighting, most users preferred having them,
and no-one strongly preferred their absence. We
again correlated them with time performance using
Kendall’s τ, but found no significant correlations with
IVAPP 2010 - International Conference on Information Visualization Theory and Applications
82

Table 3: Subjective variable statistics. Number of users who
selected each item on each survey scale, and the average
value.
variable nr. users: average
1 2 3 4 5
CPR 5 2 - 1 4 2.75
occlusion - 1 2 4 5 4.08
suspicious - 2 2 4 4 3.83
wheel 2 1 - 1 8 4.00
clarity - 3 9 2.75
animation - - 12 3.00
either mean-ISOSURF, diff-DVR-ISOSURF, mean-
DVRSUS, or diff-DVR-DVRSUS.
3.2 Controls
In order to find out how the controls were used, we
analysed the interaction data, in particular the use of
mouse wheel and MMB, and time spent rotating and
zooming. Users spent only an average of 0.51 sec.
per trial on zooming, and 0.24 sec. on rotating around
the view axis. In contrast, they spent around 11.5
sec. (18.3% of the time) on rotating around the other
two axes using the RMB. Zoom behaviour differed
between users. Most (8 of 12) users would navigate
to one end, and then zoom in quite far to see details
clearly, then proceed to the other end without zoom-
ing out. So, a majority of users proceeded systemat-
ically with a fixed zoom level. Only four users liked
to zoom in and out in particular cases to see context
better. We conclude that the RMB rotation controls
are by far the most important, and that a fixed zoom
level would probably suffice for this task.
As regards mouse wheel and MMB, we found that
most users almost exclusively used the mouse wheel.
The MMB was clicked only 2.13 times per trial on
average. However, there were two users who used
the MMB almost exclusively. These are the two users
who strongly preferred the MMB in the subjective
survey. We conclude that the choice between mouse
wheel and MMB is a matter of personal choice.
In a few cases, users forgot what was back and
forward in their systematic search from one end to the
other, and would navigate or even zoom out to check
the direction. It may be worth incorporating a feature
that ensures users do not get lost this way.
A few users did not proceed quite systematically,
and would go back and forth randomly to check things
they think might be suspicious, or go outwards from
the middle. In only a couple of cases, users changed
strategies in the middle of the experiment, which may
be considered a learning effect.
4 CONCLUSIONS
We conducted an experiment which compared task
performance and subjective preference for a visual
search task involving finding segmentation errors in
segmented MRA data. We compared four visualisa-
tions, namely DVR, CPR, Isosurface (ISOSURF), and
DVR with suspicious areas highlighted (DVRSUS).
We used time taken and error rate as performance
measures.
CPR was clearly the fastest, but also has higher er-
ror rate. Users were strongly divided overtheir prefer-
ence for CPR, reflecting their relative individual time
performance differences. We do not have an expla-
nation for the higher error rate. CPR showed all er-
rors in our models without rotation, so it is not caused
by the users rotating too little to discover all errors.
Possibly the high interaction speed also made users
double-check less often. It would be interesting to
find out why error rate was higher in a future experi-
ment.
Contrary to some previous studies (e.g. (Maltz and
Shinar, 2003)), we found that suspicious area high-
lighting (as in ISOSURF and DVRSUS) did not lead
to increased error rate as compared to DVR. How-
ever, no significant time performance improvement is
seen for either DVRSUS or ISOSURF over DVR ei-
ther, suggesting that the error detection cues in these
visualisations did not help. Looking at the learning
effects over time showed that they performed slower
than DVR in early trials, but equally fast in later tri-
als. This is likely because of the double checking in-
volved in the warning cues, and at least some of the
users simply learned to ignore the cues. However,
most users did prefer both DVRSUS and ISOSURF
over DVR.
Possibly, the probability of false positives and
negatives in DVRSUS (averaging 25% each) was too
high for this feature to be useful. Also, because of
learning effects, our experiment can be made more
sensitive by increasing the number of trials. So, it is
still possible that some users benefited or would ben-
efit from suspicious areas, but this requires a new ex-
periment to find out.
As regards zoom and rotate controls, we found
that traditional rotation around the X/Y axis was the
most important. This two degrees of freedom rotation
appeared sufficient to discover all errors in the 3D vi-
sualisations easily. Zooming and rotation around the
view (Z) axis were little used. Most users zoomed in
to a fixed zoom level and stayed there during the rest
of the trial. This suggests that controls can be simpli-
fied using a sensible default for zoom level.
EFFECTIVENESS OF VISUALISATIONS FOR DETECTION OF ERRORS IN SEGMENTATION OF BLOOD
VESSELS
83

ACKNOWLEDGEMENTS
This work was carried out under the NWO (Nether-
lands Organization for Scientific research) Multivis
project (N 643.100.602), which is part of the NWO
VIEW program.
REFERENCES
Achenbach, S., Moshage, W., Ropers, D., and Bach-
mann, K. (1998). Curved multiplanar reconstructions
for the evaluation of contrast-enhanced electron-beam
CT of the coronary arteries. American Journal of
Roentgenology, pages 895–899.
Bade, R., Ritter, F., and Preim, B. (2005). Usability com-
parison of mouse-based interaction techniques for pre-
dictable 3D rotation. In 5th international sympo-
sium on smart graphics: SG 2005, pages 138–150.
Springer.
Boskamp, T., Rinck, D., Link, F., K¨ummerlen, B., Stamm,
G., and Mildenberger, P. (2004). New vessel analysis
tool for morphometric quantification and visualization
of vessels in CT and MR imaging data sets. Radio-
graphics, 24(1):287–297.
Dixon, S. R., Wickens, C. D., and McCarley, J. S. (2007).
On the independence of compliance and reliance: are
automation false alarms worse than misses? Human
factors, 49(4):564–72.
Fisher, D. L. and Tan, K. C. (1989). Visual displays: The
highlighting paradox. Human Factors, 31(1):17–30.
Freer, T. W. and Ulissey, J. M. (2001). Screening mam-
mography with computer-aided detection: prospective
study of 12,860 patients in a community breast center.
Radiology, 220:781–786.
Hong, W., Qiu, F., and Kaufman, A. (2006). A pipeline for
computer aided polyp detection. IEEE Transactions
on Visualization and Computer Graphics, 12(5):861–
868.
Kanitsar, A. (2004). Curved Planar Reformation for Ves-
sel Visualization. PhD thesis, Institute of Computer
Graphics and Algorithms, Vienna University of Tech-
nology, Favoritenstrasse 9-11/186, A-1040 Vienna,
Austria.
Levinski, K., Sourin, A., and Zagorodnov, V. (2009). 3D
visualization and segmentation of brain MRI data. In
GRAPP 2009, pages 111–118.
Levy, J. H., Broadhurst, R. R., Ray, S., Chaney, E. L., and
Pizer, S. M. (2007). Signaling local non-credibility in
an automatic segmentation pipeline. In Proceedings
of the International Society for Optical Engineering
meetings on Medical Imaging, Volume 6512.
L´opez-Aligu´e, F. J., Acevedo-Sotoca, I., Garc´ıa-Manso,
A., Garc´ıa-Orellana, C. J., and Gallardo-Caballero, R.
(2004). Microcalcifications detection in digital mam-
mograms. In EMBC 2004.
Maltz, M. and Shinar, D. (2003). New alternative methods
of analyzing human behavior in cued target acquisi-
tion. Human Factors, 45(2):281–295.
Mueller, D. C., Maeder, A. J., and O’Shea, P. J. (2005). En-
hancing direct volume visualisation using perceptual
properties. In Proc. SPIE, Vol. 5744, pages 446–454.
Rolland, J. P., Muller, K. E., and Helvig, C. S. (1995). Vi-
sual search in medical images: a new methodology to
quantify saliency. In Proc. SPIE Vol. 2436, pages 40–
48.
Suinesiaputra, A., de Koning, P. J., Zudilova-Seinstra, E. V.,
Reiber, J. H. C., and van der Geest, R. J. (2009). A 3D
MRA segmentation method based on tubular NURBS
model. In International Society for Magnetic Reso-
nance in Medicine 2009, Honolulu, Hawaii.
Tamborello, F. P. and Byrne, M. D. (2007). Adaptive but
non-optimal visual search behavior with highlighted
displays. Cognitive Systems Research, 8(3):182–191.
van Schooten, B. W., van Dijk, E. M. A. G., Zudilova-
Seinstra, E. V., de Koning, P. J. H., and Reiber, J.
H. C. (2009). Evaluating visualisation and navigation
techniques for interpretation of MRA data. In GRAPP
2009, pages 405–408.
Wang, Y., Gao, X., and Li, J. (2007). A feature analysis
approach to mass detection in mammography based
on RF-SVM. In ICIP 07, pages 9–12.
Wickens, C. D. and Andre, A. D. (1990). Proximity com-
patibility and information display: Effects of color,
space, and objectness on information integration. Hu-
man Factors, 32(1):61–77.
Yeh, M. and Wickens, C. D. (2001). Display signaling in
augmented reality: Effects of cue reliability and image
realism on attention allocation and trust calibration.
Human Factors, 43(3):355–365.
IVAPP 2010 - International Conference on Information Visualization Theory and Applications
84
