
DECAY-BASED RANKING
FOR SOCIAL APPLICATION CONTENT
George Papadakis, Claudia Niederée and Wolfgang Nejdl
L3S Research Center, Leibniz Universität Hannover, Appelstr. 9A, Hannover, Germany
Keywords: Information Valuation, Time-Decay Model, Information Resources Ranking, Social Applications.
Abstract: Social applications are prone to information explosion, due to the proliferation of user generated content.
Locating and retrieving information in their context poses, therefore, a great challenge. Classical
information retrieval methods are, however, inadequate in this environment, and users inevitably drown in
an information flood. In this paper, we present a novel method that facilitates user’s information quests by
identifying and improving the accessibility of the most important resources. This is achieved through an
information valuation method, that estimates how likely it is for each information item to be accessed in the
near future. The experiments verify that our method performs significantly better than others typically used
in social applications, while being more versatile, too.
1 INTRODUCTION
In the current Age of Information, social
applications like Wikis constitute a valuable tool for
enterprises and consortia that employ a
geographically distributed workforce. They facilitate
team collaboration and sharing of content that is
mainly generated by users, by encouraging
individuals to contribute any information that could
well be useful to others. A significant hindrance,
though, to fulfilling collaborative tools’ potential is
the information explosion that they normally entail.
Due to their ease of use, individuals tend to be quite
prolific in producing content, which over time leads
to an information deluge (Mukherjee et al., 2004),
(Marshall et al., 1994). As a result, looking up the
currently relevant and discussed information
resources turns out to be as efficient as searching for
a needle in the haystack. This situation has been
coined in the literature as the “invisible intra-net”
problem (Feldman et al., 2003).
Contrary to one’s expectations, the classical
information retrieval methods are not fully adequate
to alleviate his issue. This is due to the highly
heterogeneous information space of social
applications that involves documents in numerous
formats, and resources lacking interconnections
(Abrol et al., 2001), (Fagin et al., 2003). Moreover,
such tools usually require a long interval between
the time new content is created, and the time it is
indexed becoming available for search (Lempel et
al., 2007). There is, therefore, an imperative need for
alternative, effective approaches.
In this paper, we present and evaluate a novel
method that aims at improving retrieval
effectiveness in content-sharing applications. It
essentially identifies and presents users with those
resources that, judging from their usage in the recent
past, are most likely to be used in the near future.
The value of information items is derived from an
information valuation method, at the core of which
lies the time-decay model of data streams (Cormode
et al., 2009). This value is then used for ranking
them so as to derive a list that contains those
resources that are most likely to be accessed in the
immediate future. In this way, retrieving critical
information is facilitated to a great extent.
The rest of the paper is structured as follows: in
section 2 we discuss related work, whereas in
section 3 we introduce our approach. Section 4
contains a detailed experimental evaluation, and
section 5 our conclusions along with future work.
2 RELATED WORK
Information valuation is a branch of Information
Lifecycle Management (ILM), a research field that
276
Papadakis G., NiederÃl’e C. and Nejdl W.
DECAY-BASED RANKING FOR SOCIAL APPLICATION CONTENT.
DOI: 10.5220/0002772802760281
In Proceedings of the 6th International Conference on Web Information Systems and Technology (WEBIST 2010), page
ISBN: 978-989-674-025-2
Copyright
c
2010 by SCITEPRESS – Science and Technology Publications, Lda. All rights reserved

encompasses methods for optimally placing
information along the tiers of Hierarchical Storage
Management Systems. The goal is to improve their
overall performance in view of the axioms that not
all information items have the same value, and that
the value of an information resource changes over
time. Several valuation methods have been proposed
in this context, employing a rich variety of criteria
(Chen, 2005). We distinguish them into two main
categories; those based on the usage of information
resources over time, and those drawn on the
business criticality of information.
The approaches of the former category assume
that the value of information is reflected in its use,
and thus usage observed in the past is a suitable
indication for the future one. (Chen, 2005), for
example, combines it in a balanced way with its
recency, whereas (Turczyk et al., 2009) employs it
in stochastic models estimating the probability of
future use. On the whole, the output of these
approaches is a classification of information
resources into groups of intensively and slightly
used ones, thus being unsuitable for our
valuation/ranking task.
The alternative valuation in terms of business
criteria is analyzed in (Moody et al., 2009) on the
principle that information bears all the
characteristics of an asset. The authors examine the
laws that govern its behavior, and deduce the
applicability of accounting models in its evaluation.
Though theoretically well established, such
approaches are hardly put into practice, as they are
human-intensive and time-consuming.
Regarding the time-decay model, it constitutes a
common practice in the field of streams, where data
arrive at high rates, and the available resources for
processing them are limited. Data streams have,
therefore, to be summarized, with most recent data
considered as more relevant, and older ones
accounted for at a lower weight. An indicative
approach that focuses on estimating the highest
degree of stream approximation that does not reduce
the accuracy in answering continuous queries is
presented in (Cohen et al., 2003). The time-decay
model has also been used for improving the review
system of Amazon in (Wang et al., 2008).
3 VALUATION METHOD
In this section we introduce a novel method for
facilitating users of social applications in their
information quests. Our approach assigns to all
information resources a value reflecting their
likelihood of being used in the future, and then ranks
them accordingly. A list of the top resources derived
from this ranking enables users to quickly locate and
directly retrieve desired information items. It should
be stressed at this point that the size of the list
depends on the application at hand and the volume
of the information space it conveys. It is also worth
stressing that the value of each information resource
is actually based on the activity of the entire user
base (collaborating team). In other words, no
individual user profiling techniques are involved in
estimating it.
In short, our method adds an intelligent usage-
based browsing dimension to a social application.
Many content management systems are already
equipped with a similar functionality, employing
either an RSS feed or a short list embedded in their
interface. Both tools, however, merely implement
the Least Recently Used (LRU) caching algorithm,
thus ordering resources according to the time of their
last transaction (access or editing). In our opinion,
though, this plainly chronological arrangement of
resources is inadequate for predicting their future
use. A comprehensive method should additionally
take into account the degree of usage, as we
empirically prove in section 4.
3.1 Problem Formulation
We begin by formalizing the problem we are
tackling as follows: having a collection of
information items, I = {i
1, i2, ...}, together with their
observed usages over the past N transaction
batches
,
,…,
, rank them so that
the average ranking position of the items used within
the next, N+1, transaction batch is minimized.
As it is evident from the above definition, our
approach to the problem is event driven; it involves a
renewal of the ranking whenever a predefined
number of transactions, termed transaction batch, is
completed. The reason is that the alternative, time
driven methodology of periodically updating the
ranking, is unreliable, as it completely disregards the
actual traffic of the underlying application. It fails,
therefore, to refresh the ranking on time whenever
there is a traffic overload, and triggers updates even
when a time interval does not include the critical
mass of transactions for re-shuffling. On the other
hand, our approach guarantees that users are
instantly informed about active and new documents,
without even having to wait for them to be indexed.
It is also worth noting at this point, that the only
evidence considered when estimating the value of
information items is their past transactions, and their
DECAY-BASED RANKING FOR SOCIAL APPLICATION CONTENT
277

chronological order. In fact, the transaction vectors
,1 consist of two dimensions; we have
that
,
, where a
ik
and e
ik
express
respectively the accumulated number of accesses
and editings of the item i over the k-th transaction
batch. Any other contextual information is ignored,
and no assumptions are made about the underlying
application, allowing for solutions that are
applicable to a rich variety of environments.
Last but not least, the above definition makes
clear that as performance metric we employ the
average ranking position of the information items
used in the immediate future. The intuition behind it
is the principle of search engines: the lower this
average is, the easier it is for a user to pinpoint the
desired resources.
3.2 Time-Decay Model
The adoption of time-decay functions as our
information valuation technique is driven by the
following rationale: the transactions of a social
application can be regarded as a data stream; they
arrive at quite high rates, and practically cannot be
considered in their entirety when estimating the
value of information resources. We assume,
therefore, that the contribution of a transaction to
the value of a resource is proportional to its
recency. Furthermore, the higher the degree of
usage, the more important that resource is.
Several time-decay functions have been
introduced in the literature and found numerous
successful applications. They are generally classified
into groups according to the rate of decay they
convey. This rate balances the influence of the two
divergent parameters on the total value of a
resource; namely, the degree of usage and its
recency. A steep decay actually emphasizes on the
latter, whereas a slow one leverages the relative
weight of the former. In the following, we present
the formal definition of several time-decay
functions, adapted from the original ones in
(Cormode et al., 2009), so that they fit to the context
of our problem.
A time-decay function,
,
,
,takes as
input the usage
of an information item i within
the k-th transaction batch, and returns the weight of
this usage for the n-th transaction batch.
It satisfies the following properties (0):
1.
,
,
1
2. 0
,
,
1
3. d is monotone non-increasing as n increases:
′ ,
,
′
,
,
Accordingly, the total value,
,,
, of an
information item i at the n-th transaction batch
given its usage history
is computed as follows:
,
,
,
,
(1)
The most popular of the time-decay functions,
ordered in descending rate of decay, are:
• Exponential Time Decay
,
,
1
(2)
• Polynomial Time Decay with Exponent α
,
,,
1
(3)
• Logarithmic Time Decay with Base β
,
,,
(4)
There is, however, no general rule for
determining which function to apply in each case, as
their performance is application-dependent. For this
reason, we selected an indicative sample from all
these groups to experimentally investigate their
effectiveness in the social application setting.
3.3 Parameters of the Method
There are several parameters for tuning and
optimizing the performance of our method. First of
all, an essential factor is the size of the transaction
batch, s, which expresses the prerequisite number of
transactions that triggers the value update of the
entire information space. It determines, therefore,
the overhead imposed by our method on the
underlying system, introducing a trade-off between
the performance and the computational cost that our
method entails. Employing, for example, a size that
is too large would bring about a small overhead,
though accompanied by a ranking that deviates
greatly from the optimal one.
An additional tuning parameter is the relative
weight of accesses and editings, which we call a/e
ratio, r. The intuition behind this factor is the
general observation that an editing is invariably
followed by a wealth of transactions, as users want
to keep up-to-date with the new item's content. It
would, therefore, be helpful to decay the value of
editings in a smoother way, so that a newly updated
resource remains high in the ranking over a longer
period of time.
Another crucial parameter is the size of the
sliding window, w; it specifies the number of the
most recent transaction batches that are considered
in estimating the total value of a resource. Its
importance stems from the fact that, giving as input
WEBIST 2010 - 6th International Conference on Web Information Systems and Technologies
278
to a decay function the whole, long usage history of
all information items is quite inefficient; moreover,
the derived ranking does not significantly differ
from or is even inferior to the one computed when
considering solely the w most recent transactions.
The sliding window determines, therefore, that part
of history that is negligible or even misleading in
evaluating information, and can be discarded
without sacrificing the overall effectiveness.
4 EXPERIMENTS
In the following experiments we investigate the
overall performance of our approach as well as the
impact of the aforementioned parameters.
4.1 Datasets
In the course of our experiments we employed two
datasets; one consisting of the transactions of the
internal wiki of the L3S research center, D1, and
another one comprising the usage of the content
management system employed in the OKKAM
project (www.okkam.org), D2. In Table 1 we
present their technical characteristics that illustrate
their heterogeneity. Analytically, D1 involves a
small information space that is slightly used,
whereas D2 lies on the other side of both scales. In
this way, we investigate the effect of the
aforementioned factors in two quite different
settings, thus enhancing the generality of our
conclusions. It is worth mentioning here that in all
our experiments, the performance was measured by
simulating the usage history of each dataset so as to
record for each transaction the position of the
corresponding resource in the existing ranking.
Table 1: Properties of the available datasets.
Dataset D1 D2
First Date 15.10.2008 01.02.2008
Last Date
15.10.2009 22.07.2009
#Elapsed Days 367 539
#Transactions
33.808 237.118
#Accesses 28.848 224.402
#Editings 4.960 12.716
#Wiki Pages 646 2.097
4.2 Transaction Batch Size
In this section we investigate the performance for
several sizes of the transaction batch, so as to select
the optimal one. In the following, we ignore, the
computational cost associated with each batch size,
since the information spaces of the above datasets
are relatively small, and require a negligible update
cost.
In Table 2 we present the outcomes of our
experiments with respect to the exponential decay
function. The performance comparisons for other
decay functions are omitted, as they all produce
similar differences. On the whole, the evidence from
these experiments suggests that updating the value
of all information items whenever a new transaction
takes place, yields a considerably better performance
under all decay rates. Hence, for the rest of the
experiments we solely consider transaction batches
with size 1.
Table 2: Average ranking position of exponential decay
for selected sizes of the transaction batch.
Batch Size D1 D2
1 17,39 28,42
2 20,00 32,21
3 22,73 35,08
4 24,74 39,87
5 26,14 41,98
6 27,70 43,36
7 28,67 45,61
8 30,38 47,07
9 31,09 48,31
10 31,79 49,76
20 38,35 58,07
50 48,26 71,72
100 56,08 83,49
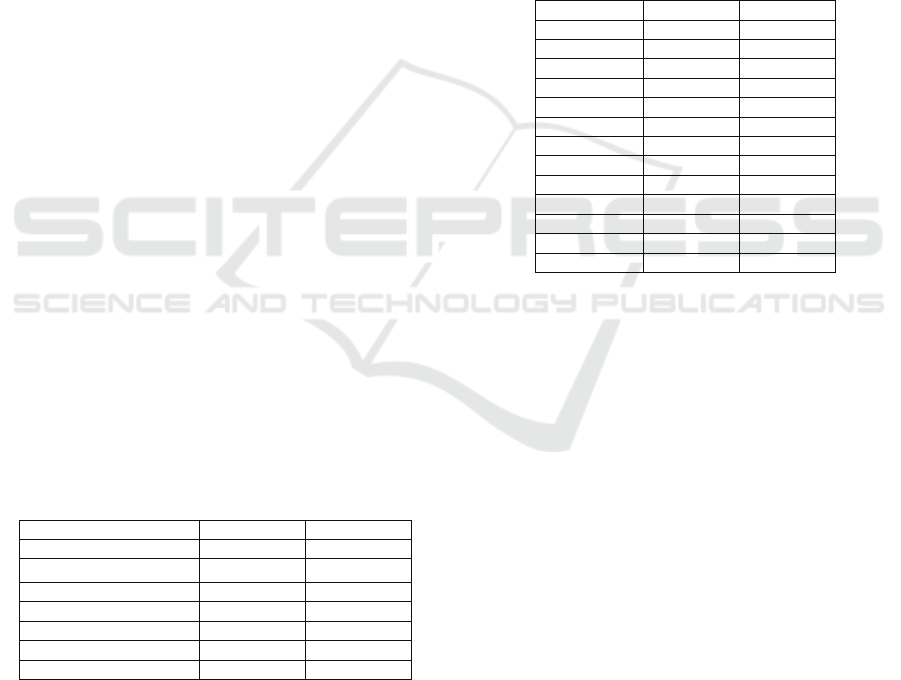
4.3 Time Decay Functions
The time-decay function employed by our method
constitutes its most crucial factor, thus demanding
for an extensive analysis. To this end, we considered
a representative sample of the above decay function
groups, comprising, in total, 20 analyzed functions.
It namely consists of the exponential time-decay
function, the polynomial ones with all exponents in
the interval [0.25, 3.00] and a step of 0.25, as well as
the logarithmic ones with the following bases: 1.1,
2.0, 5.0, 10.0, 20.0, 50.0 and 100.0. The outcomes of
these experiments are presented in Table 3.
As expected, our method exhibits a considerable
diversity in its performance, depending on the decay
function employed. More specifically, we observe
that the exponential decay achieves in both cases
exactly the same performance as LRU. This is due to
the fact that it entails a very steep decay, thus highly
emphasizing on the recency of transactions. On the
other hand, the logarithmic decay proves itself to be
quite inappropriate for ranking, having an average
ranking position that is much worse than that of the
baseline. The reason is the very slow decay of these
DECAY-BASED RANKING FOR SOCIAL APPLICATION CONTENT
279
functions, that leveraging excessively the influence
of the degree of usage against its recency.
Contrariwise, the polynomial decay functions
involve a balanced combination of both dimensions,
thus exhibiting the best performance in all datasets.
Analytically, in dataset D1 the polynomial function
with exponent α=1.25 achieves an average ranking
position of 15.69, entailing an improvement of
9.78% over that of the baseline method (17.39). In
D2 the improvement is, though, much lower
(3.62%), with the polynomial with exponent α=1.5
ranking at 27.39 on average in comparison to LRU’s
28.42. It should be stressed here that both
improvements are statistically significant, as verified
by the Student’s test (P<<0.05).
To sum up, although the most appropriate decay
function depends in general on the application at
hand, in both cases we examined, employing a
polynomial decay function guarantees a high
performance. For this reason, we employed a
common polynomial decay function for both
datasets while examining the impact of the other two
factors.
Table 3: Average ranking position of selected time-decay
functions.
Functions D1 D2
LRU 17,39 28,42
EXP 17,39 28,42
PLN α=0,25 41,35 102,77
PLN α=0,50 24,59 48,76
PLN α=0,75 17,30 34,29
PLN α=1,00 15,80 28,32
PLN α=1,25 15,69 27,56
PLN α=1,50 15,85 27,39
PLN α=1,75 16,05 27,46
PLN α=2,00 16,23 27,60
PLN α=2,25 16,39 27,68
PLN α=2,50 16,53 27,79
PLN α=2,75 16,63 27,85
PLN α=3,00 16,72 27,93
LOG β=1,1 33,77 86,86
LOG β=2,0 42,65 104,93
LOG β=5,0 46,34 112,93
LOG β=10 47,96 116,56
LOG β=20 49,21 119,39
LOG β=50 50,40 122,26
LOG β=100 51,15 124,48
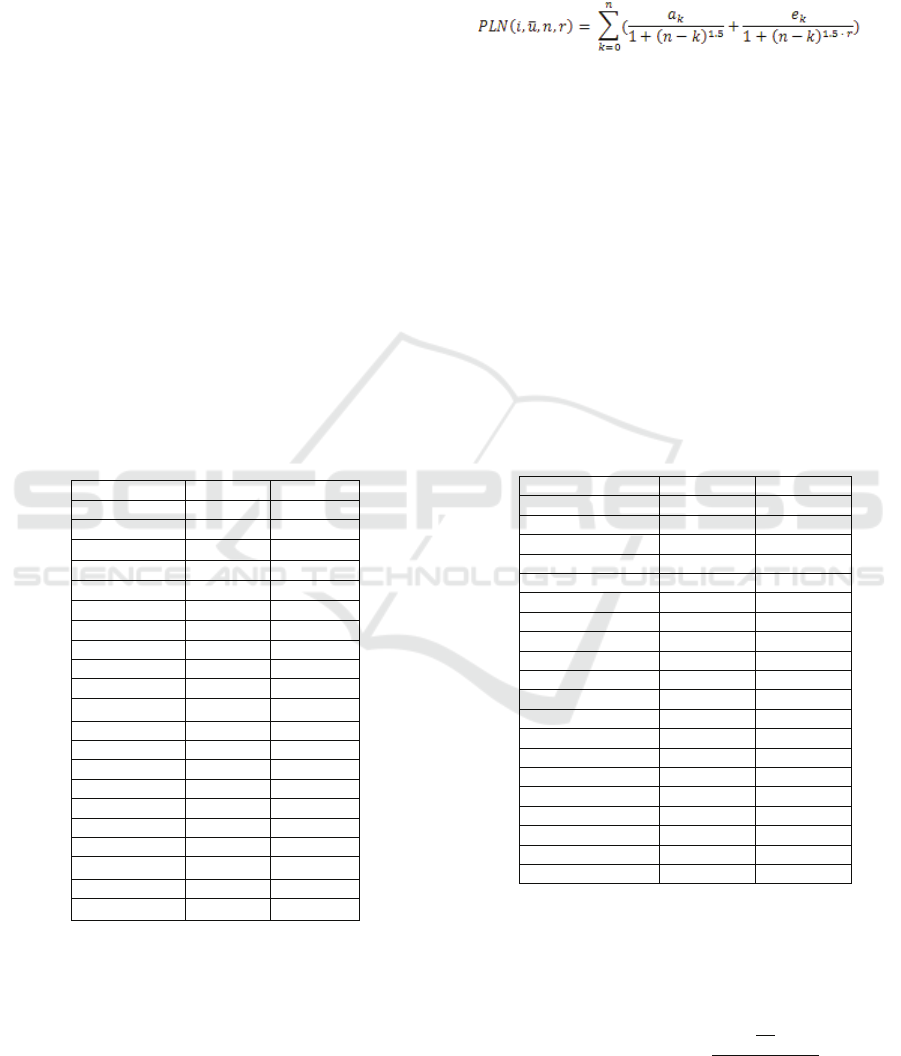
4.4 A/E Ratio
Τo investigate the impact of the a/e ratio, we
selected the best performing decay function in D2,
namely the polynomial decay function with
exponent α=1.5. We applied it in both datasets,
multiplying its editings’ exponent by all values in
the interval [0.1, 2.0] with step 0.1. In this way, we
considered the whole spectrum of the relative weight
between accesses and editings, ranging from slower
editings decay for r < 1.0 to faster decay for values
over 1.0. Analytically, the formula giving the total
value of an information item is now the following:
(5)
The outcomes of the experiments are presented
in Table 4. We observe a significant deterioration for
all ratios below 1.0, whereas for values above 1.0
the performance fluctuates around the same average
ranking position. None of them, though, exhibits a
statistically significant improvement over r=1.0.
This outcome seems to be in contrast with our
assumption that editings are more important than
accesses, and thus should have a prolonged impact
on the value of information items. The main reason
is that the subsequent high activity of an updated
resource is concentrated in the next few transactions,
when its is already high enough to maintain it on a
top ranking position.
Table 4: Average ranking position of the polynomial
decay function with α=1.5 for selected values of r.
A/E Ratio D1 D2
0,10 61,50 264,72
0,20 49,53 202,43
0,30 40,04 157,00
0,40 33,52 118,67
0,50 28,16 83,51
0,60 23,55 55,96
0,70 19,93 39,06
0,80 17,55 31,16
0,90 16,35 28,24
1,00 15,85 27,40
1,10 15,70 27,29
1,20 15,69 27,39
1,30 15,72 27,52
1,40 15,78 27,65
1,50 15,84 27,77
1,60 15,90 27,89
1,70 15,96 28,01
1,80 16,01 28,12
1,90 16,05 28,22
2,00 16,10 28,32
4.5 Size of Sliding Window
The following formula gives us the total value of an
information item, when a sliding window, w, is
considered:
,
,,
1
.
(6)
WEBIST 2010 - 6th International Conference on Web Information Systems and Technologies
280

In our experiments, w took all the values in the
interval [1,000, 20,000] with a step of 1,000
transactions. The outcomes are presented in Table 5.
We observe that the best performance in both
cases is achieved with a window of size between
13,000 and 14,000 transactions. As expected,
though, there is no significant improvement in the
case of D1, due to the anyway low number of
transactions that it entails. Contrariwise, in D2 the
sliding window did make a significant difference for
almost all sizes of the window. In the best case,
namely w=14,000, the average ranking position is
reduced to 26.67 signaling a 6.16% improvement
over LRU. This performance was again verified by
the t-test to be significantly better than the baseline.
Table 5: Average ranking position of the polynomial
decay function with α=1.5 for selected values of w.
Window Size D1 D2
1000 16,43 27,29
2000 16,19 27,03
3000 16,08 26,92
4000 16,01 26,86
5000 15,97 26,81
6000 15,91 26,79
7000 15,90 26,76
8000 15,87 26,74
9000 15,87 26,73
10000 15,84 26,71
11000 15,83 26,70
12000 15,81 26,70
13000 15,80 26,69
14000 15,81 26,67
15000 15,81 26,69
16000 15,82 26,69
17000 15,82 26,70
18000 15,81 26,70
19000 15,81 26,71
20000 15,82 26,72
5 CONCLUSIONS AND FUTURE
WORK
In this paper we presented a novel approach to
information valuation that employs time-decay
functions to rank the information resources of social
application. The top positions of this ranking contain
those resources that are most likely to be used in the
immediate future, thus facilitating their retrieval.
Through our experiments we analyzed its
performance, and suggested parameter values that
optimize it.
In the future, we plan to further improve our
method by integrating into it the structure of the
underlying Wiki, so as to propagate the value of
each resource to its neighboring ones. Moreover, it
would be quite helpful to introduce new ways of
rapidly updating the value of all information items,
so as to accelerate the calculations that it entails in a
way similar to the one presented in (Cormode et al.,
2009). Last but not least, we plan to adapt it to work
with queries, as well.
ACKNOWLEDGEMENTS
This work was partially supported by the FP7 EU
Large-scale Integrating Project OKKAM – Enabling
a Web of Entities (contract no. ICT-215032).
REFERENCES
Abrol, M., Latarche, N., Mahadevan, U., Mao, J.,
Mukherjee, R., Raghavan, P., Tourn, M., Wang, J.,
and Zhang, G. Navigating large-scale semi-structured
data in business portals. VLDB, 2001.
Chen, Y. Information Valuation for Information Lifecycle
Management. In Proceedings of the 2nd ICAC, 2005.
Cohen, E., and Strauss, M. Maintaining time-decaying
stream aggregates. PODS, 2003.
Cormode, G., Shkapenyuk, V., Srivastava, D., and Xu, B.
Forward Decay: A Practical Time Decay Model for
Streaming Systems. ICDE, 2009.
Fagin, R., Kumar, R., McCurley, K. S., Novak, J.,
Sivakumar, D., Tomlin, J. A., and Williamson, D. P.
Searching the worklplace web. WWW, 2003.
Feldman, S., and Sherman., C. The High Cost of Not
Finding Information. Technical Report #29127, IDC,
April 2003.
Lempel, R., Mass, Y., Ofek-Koifman, S., Sheinwald, D.,
Petruschka, Y., Sivan, R.: Just in time indexing for up
to the second search. CIKM,2007.
Marshall, C., Shipman, F., and McCall, R. Putting Digital
Libraries to Work: Issues from Experience with
Community Memories. Digital Libraries, 1994.
Moody, D., and Walsh, P. Measuring the Value of
Information: An Asset Valuation Approach. ECIS,
1999.
Mukherjee, R., and Mao, J. Enterprise search: tough stuff.
Enterprise Search, vol.2, No. 2, April 2004.
Turczyk, L., Gröpl, M., Liebau, N., and Steinmetz R. A
method for File Valuation in Information Lifecycle
Management. AMCIS,2007.
Wang,B.C., Zhu, W.Y. Chen, L.J. Improving the Amazon
Review System by Exploiting the Credibility and
Time-Decay of Public Reviews. WI/IAT, 2008.
DECAY-BASED RANKING FOR SOCIAL APPLICATION CONTENT
281
