
EVALUATION SYSTEM FOR MONITORING OF VITAL
PARAMETERS AND ACTIVE BODY CLIMATE CONTROL
A. Gharbi, C. Krähling, W. Stork and K. D. Mueller-Glaser
Karlsruhe Institute of technology (KIT), Institute for Information Processing Technology, Karlsruhe, Germany
Keywords: Vital parameters monitoring, Correlation and regression analysis, Energy expenditure, Regulation
algorithm, Active body climate control.
Abstract: This work presents a textile integrated evaluation system for active body climate control. The evaluation
system registers several vital parameters of the user (skin temperature, skin relative humidity, heart rate,
breathing rate and 3D acceleration data), its current subjective feedback and some surrounding parameters
(temperature and relative humidity) and thus automatically controls the air ventilation level inside a cooling
vest. For the climate control, a regulation algorithm influencing the body heat exchange processes and
leading to thermal comfort at different workloads and different surrounding conditions is heuristically
designed. In addition, a field study is conducted. This study involves 11 test persons and aims at validating
the sensor data of the evaluation system and determining the energy expenditure of the body from the sensor
data by analyzing the correlation between these data and the reference data of a spirometer. Besides, a
verification of the suitability of the evaluation system for daily use and a validation of the
implemented regulation algorithm is conducted.
1 INTRODUCTION
The active body climate control has several
interesting aspects and its benefits can be shown in
different use case scenarios. In fact, it can be
integrated into the protective clothing of rescue and
relief personnel (fire fighters and special police
units) who work under extreme thermal conditions
due to the thermal isolation of their clothing, which
is caused by its protective functionality (e.g. ballistic
protection). In this case, the active body climate
control system is primarily a cooling system that
prevents overheating of the body and protects the
wearing subject thereby increasing his physical
performance. Another very interesting application
field for such a technology is the medical field,
where it can actively support the physiological
thermoregulation mechanisms of elderly and weak-
hearted patients and thus avoid a collapse of their
cardiovascular system due to excessive heat of the
surroundings.
Besides, the active body climate control offers a
big potential for energy saving. In fact, a portable
cooling system would need an electrical power of
about 3 to 4 watts (primarily for the integrated
ventilator), which corresponds to about 1/1000 of
the energy consumed by a commercial room air
conditioner.
Apart from compensating high surrounding
temperatures, the active body climate control helps
the wearing subject to transport away the generated
body heat due to metabolic activity (especially
through evaporation and convection). This leads to
an increase of the performance even during high
physical activity and contributes to a better thermal
comfort.
2 METHODS
2.1 Evaluation System
In this section, the implemented evaluation System,
which is used in the field study conducted to validate
the reliability of the sensor data and the conceived
body climate regulation algorithm, is described.
The evaluation system comprises a modular
hardware set-up, which has a variety of sensors
integrated into a sensor shirt, a cooling vest for the
air ventilation, a control board for data processing
(sensor data as well as user feedback data),
regulation algorithm and wireless communication
94
Krähling C., D. Mueller-Glaser K., Stork W. and Gharbi A. (2010).
EVALUATION SYSTEM FOR MONITORING OF VITAL PARAMETERS AND ACTIVE BODY CLIMATE CONTROL.
In Proceedings of the Third International Conference on Bio-inspired Systems and Signal Processing, pages 94-102
DOI: 10.5220/0002748300940102
Copyright
c
SciTePress

a) b)
Figure 1: Evaluation system: a) Sensor shirt, b) Whole
system.
and a feedback interface including a scroll wheel
and a PDA.
2.1.1 Sensor Shirt
In order to get an idea about the actual body climate
and its energy expenditure due to physical activity,
several sensors for the measurement of the vital
parameters need to be used. Due to comfort and
reliability issues, the sensors have been integrated
into a shirt having elastic material permeable to the
moisture, which better fits the body form and lets the
generated evaporation heat of the body diffuse into
the ventilation air. In this way the sensors do not
need to be attached to the body surface and thus
makes the use of the system in the field study very
practical. The sensors integrated in the shirt are in
addition connected to the control board by means of
a detachable connector interface.
The sensor shirt includes the following vital
parameter sensors:
Temperature and Moisture Sensors:
The skin temperature at the thermal balance of the
body is influenced by many factors like the clothing
and the metabolism or activity level of the body.
Thus, its deviation from a set point temperature
Tsk
m0
can be used to recognize a ventilation need.
Due to the non uniform distribution of the skin
temperature (Olesen, 1973) (Crawshaw, 1975)
(Fiala, 1999), this latter is measured at four positions
on the body skin surface. Two digital temperature
sensors are integrated in the textile area at the
abdomen and the upper back. Additional two
combined sensors for measuring temperature and
relative humidity (temperature compensated) are
used in the area of the chest and the lower back. The
four temperature values are then weighted with the
corresponding skin area and thus the mean skin
temperature can be determined. The relative
humidity at the skin surface is in addition a good
index for determining the amount of energy losses in
form of evaporation. This represents the biggest part
of the whole energy given up to the surroundings
and especially at high surrounding temperature
and/or metabolic activity.
Heart Rate Sensor:
It comprises two textile electrodes integrated into the
shirt and connected to an analog frontend module,
which detects the QRS complexes out of the ECG
signal and generates digital square pulses at each
QRS event. This digital signal is connected to an
input capture module of the microcontroller on the
control board, where the heart rate can be calculated.
In order to improve the quality of the detected
ECG signal, the cross over resistance between the
skin surface and the electrodes has to be very low. In
the case of sport activity the fast formation of a
sweat film under the electrodes decreases the
crossover resistance. In the conducted measurements
a cream for ECG electrodes is applied in order to get
the best signal quality.
Respiration Sensor:
It comprises a piezoelectric crystal, which is
stretched by means of a band attached to the shirt at
the chest level. The output signal of the sensor is
proportional to tensile stress and therefore shows a
good correlation with the chest movements due to
the respiration.
Acceleration Sensor:
A 3D acceleration sensor is attached to the shirt in
the left shoulder. Out of the three acceleration values
in the three axes, the activity level can be
determined (Jatobá, 2007).
2.1.2 Cooling Vest
The cooling vest is worn over the sensor shirt and
integrates a space holder material, through which
fresh air can circulate. The inner textile separation
layer is, unlike the outer one, permeable to the
moisture. The cooling vest has an air inlet at the
most lower part on the back and an air outlet in the
front at the most lower part of the vest. A ventilator
is placed at the outlet and is responsible for the
ventilation of the body by aspiring the air, which
circulates from the inlet over the back, the shoulders,
the chest and the abdomen towards the outlet. At the
outlet the air blown out gets warmer and more
EVALUATION SYSTEM FOR MONITORING OF VITAL PARAMETERS AND ACTIVE BODY CLIMATE
CONTROL
95

humid due to the body heat, which is released
especially by evaporation and convection. In
addition the cooling vest integrates two combined
sensors for measuring temperature and relative
humidity at both the inlet and the outlet, which can
be used to monitor the surrounding conditions (from
the sensor at the inlet) and the thermal exchange
between the body surface under the vest and the
circulating air in the vest (from the sensor at the
outlet). It also has a rechargeable battery, which
allows up to more than 10 hours operating time of
the ventilator at full performance. The applied
voltage to the ventilator is controlled by a PWM
modulator on the control board and thus the
ventilation level in the vest can be changed
according to the current level of the regulation
algorithm.
2.1.3 Control Board
It is the main part of the system, where the signal
processing, the climate regulation algorithm and the
control of the ventilation take place. The main
microcontroller of the control board PIC24FJ256GB
also uses an integrated SDHC memory card in order
to save all sensor and regulation algorithm data,
which can be offline analyzed on a PC.
2.1.4 Feedback Interface
On the one hand, the user has the possibility to
change the ventilation level according to his
individual preferences through manipulating a scroll
wheel, which is integrated in a wrist-band. This
latter also integrates an RGB led, which is used to
show the status of the system. On the other hand, the
evaluation system has another interface channel
namely a PDA, which communicates with the
control board via Bluetooth and online visualizes all
vital and system parameters.
Figure 2: Evaluation system: sensor nodes and control
board (in the middle).
2.2 Climate Regulation Algorithm
In order to maximize the climate comfort for the
wearing subject of the evaluation system, a
regulation algorithm for active body climate control
needs to be designed. Outgoing from the measured
and surrounding parameters, the regulation
algorithm should control an appropriate actuating
variable responsible of the climate control. In the
designed system only the active cooling is
integrated. Nevertheless, an active heating
component is planned to be integrated in the next
generation of the system.
2.2.1 Actuating Variable
The actuating variable for the active climate control
is the ventilation level. This latter corresponds to the
rotation speed of the ventilator at the outlet. This
speed is controlled by the control board that varies
the operating voltage of the ventilator through a
PWM modulator. The voltage interval, in which the
ventilator is active, is linearly split in 10 discrete
levels. Since the ventilator needs a minimum voltage
in order to overcome its inertia, the voltage interval
taken into consideration varies from around 5.8V to
12V. In this way we get the following ventilation
levels:
• Level 0 = ventilator is inactive
• Level 1-9 = ventilator is active
• Level 10 = maximal ventilation
The calculated ventilation level (Vent
Level
) comprises
two components: the ventilation level calculated out
of the measured sensor data (Alg
Level
) and the user
level (User
Level
), which is set up by the user through
manipulating the scroll wheel at the wrist-band and
which gives him the possibility to fine tune the
ventilation level according to its individual comfort
feeling and even switch it off if desired. Thereby the
following formula and constraints are always valid.
Vent
Level
= Alg
Level
+ User
Level
(1)
with 0 ≤ Vent
Level
≤ 10
0 ≤ Alg
Level
≤ 10
− Alg
Level
≤ User
Level
≤ 10
2.2.2 Regulation Algorithm
The aim of the evaluation system is to actively
influence the physiological body thermoregulation
as shown in figure 3.
BIOSIGNALS 2010 - International Conference on Bio-inspired Systems and Signal Processing
96

Figure 3: Active influence of the evaluation system on the
body thermoregulation.
In fact, the actuator component of the implemented
evaluation system supports the heat exchange
mechanisms of the body by improving the
evaporation and the convection. As input for the
regulator, several vital and environmental
parameters are measured and post processed in order
to get information about the cooling needs of the
user.
In a first stage, the regulation algorithm
influencing the body heat exchange processes was
heuristically designed. The reason behind it was that
there have been neither enough sensor data nor
literature sources, which exactly describe the
influence of a similar concept for active climate
control on the thermal processes of the body. In
addition we had no reference sensor data (like
spirometer for detecting energy expenditure
(Hollmann, 2006)) before the field study, which
reflect the quality and reliability of the sensor data
and help to determine an analytical regulation
algorithm. During the design phase, a load test,
similar to the test in the planned field study, was
conducted. In that phase, the wearing subjects had
the possibility to manually set up the ventilation
level by the scroll wheel according to their
individual preferences. In this way, a sensor data set
correlating with subjective optimum could be
registered. Outgoing from the analyzed data of the
temperature, moisture, heart rate and acceleration
sensors the corresponding proportions for the
ventilation level (respectively Tsk
Level
, RH
Level
,
HR
Level
and ACC
Level
) were empirically defined. The
sum of these values builds up the ventilation level
out of the regulation algorithm (Alg
Level
).
Alg
Level
=
Tsk
Level
+ RH
Level
+ HR
Level
+
ACC
Level
(2)
In addition, the determined ventilation level of
each sensor has been limited to a predefined similar
range. This should minimize errors due to
malfunction of the sensors during the load test.
In the following section, the different terms of
formula (2) should be depicted.
The ventilation level outof the measured mean
skin temperature Tsk
m
is determined by formula (3)
and its deviation from the set point temperature
Tsk
m0
is proportional to the thermal heat losses at the
skin and thus the linear correlation with the
ventilation level.
Tsk
Level
= b
T
· (Tsk
m
− Tsk
m0
)
(3)
with − 1 ≤ Tsk
Level
≤ 3, b
T
= 2 and Tsk
m0
= 32 °C
Analog to the mean skin temperature, the mean
skin relative humidity RH
m
is calculated out of the
two moisture sensors and the deviation to the
relative humidity at the inlet of the cooling vest
RH
in
, corresponding to the relative humidity of the
surrounding air, is normalized and the specific
ventilation level can be determined according to the
formula 4.
RH
Level
= b
RH
· (RH
m
− RH
in
) / (100% −
RH
in
)
(4)
with 0 ≤ RH
Level
≤ 3 and b
RH
= 3
The heart rate correlates with the actual psycho
physical load on the body and has a linear
dependency with the workload (Hollmann, 2006).
HR
Level
= b
HR
· (HR
m20
− HR
0
) (5)
with 0 ≤ HR
Level
≤ 4, b
HR
= 1/29 and HR
0
= 75
Thereby HR
0
designates the heart rate at rest and
HR
m20
represents the post processed heart rate signal,
which results from filtering the raw signal by a non
linear median filter having the width of 11, and
averaging over a moving window of 20 values.
The ventilation level ACC
Level
gained out the data
of the acceleration sensor is calculated by the
following formula.
ACC
Level
= b
Eeac
· Max{Var_Eeac
m30
,
Var_Eeac
m150
}
(6)
with 0 ≤ ACC
Level
≤ 3, b
Eeac
= 50
, Var_Eeac = (Eeac − 1)²
&
∑
=
++=
s
f
i
ziyixi
s
aaa
f
1
222
1
Eeac
,
s
f = 20 Hz
EVALUATION SYSTEM FOR MONITORING OF VITAL PARAMETERS AND ACTIVE BODY CLIMATE
CONTROL
97

In this case the variance of the parameter Eeac,
which is an equivalent for the acceleration energy, is
calculated out of the energy of the acceleration
signal in the three axes of the ACC sensor (Jatobá,
2007). Eeac
m30
and Eeac
m150
represent the post
processed Eeac values, which are averaged over a
moving window of respectively the width of 30 and
150 values. The Eeac
m150
enables the integration of a
relaxation phase of 3 to 5 minutes depending on the
activity time and intensity, which precede a rest
phase. In fact after the activity phase, the Eeac
values decrease rapidly to almost 0 but the body still
dissipates a decreasingly important amount of
energy.
2.3 Field Study
The conducted field study aims at collecting detailed
information about the physiological
interdependencies and their correlation with the
workload. Thereby several physiological body
reactions, like the consumption of oxygen, the
breathing rate and the heart rate, etc., are measured
during the load test and saved for offline analysis
with reference to the predefined physical
performance.
2.3.1 Field Study Procedure
Each test person undertakes two load tests on a
treadmill ergometer. The first test is conducted with
only the sensor shirt and a spirometer, which aims at
validating the sensor data of the evaluation system
and determining the energy expenditure of the body
out of the sensor data through analyzing the
correlation between these data and the reference data
of the spirometer. In the second test, each test person
wears the whole evaluation system (including
cooling vest). Through this test, a verification of the
suitability of the evaluation system for daily use and
a validation of the implemented algorithm for active
body climate control can be done.
The test procedure has to be conceived in a way
that it makes it possible to compare the results of the
load tests related to different test persons. Therefore
a low workload level in the beginning of the test and
short workload phases, which not exclude the
reaching of a bio-physiological steady state status,
need to be considered. According to (Wahlund,
1948), an absolute steady state status for light up to
middle workload is reached after 6 minutes.
Investigations of the sports university in Köln /
Germany show that 90 up to 95% of the steady state
status can be registered already after 3 minutes of
the beginning of a constant workload (Knipping,
1953). For the conducted load test, a tradeoff is met
analog to (Hollmann, 1963). After a baseline phase
of 5 minutes, an intensity level of 6 km/h can be set
at the treadmill ergometer for the period of time of 5
minutes followed by an increase of the intensity
level with 1km/h. After the last test phase, which
corresponds to an intensity of 11 km/h, the test
person can rest for 5 minutes.
2.3.2 Test Person Feedback Form
During the study, subjective feedback from the test
persons is collected by means of a test person
feedback form. This latter includes general questions
before the beginning of the load test dealing with the
performance anamnesis (general fitness, physical
and mental state on the day of testing, feeling of the
room climate, etc.) and recording the individual
physiological data of each test person, such as age,
body height, weight, etc. and the climate in the room
of the study (temperature, moisture, etc.).
During the load test with cooling vest, the actual
wearing comfort of the vest and the local thermal
comfort at the chest, the abdomen and the back are
registered at every phase of the test.
After the end of the test, the test persons give
their feedback related to the absolved test and to the
test settings, for instance the evaluation system and
the efficiency of its active climate control.
2.3.3 Test persons
The test persons are 11 high school students (males).
Their age ranges between 21 and 30 years. Two test
persons were not able to run the second test with the
cooling vest. In addition one dataset from the test
with cooling vest was discarded due to the loss of
data after the reset of the control board. In fact a
short circuit at the wrist-band feedback interface
occurred due to an excessive generation of sweat
and a lack of a protective layer.
3 RESULTS
3.1 Cooling Algorithm
To evaluate the quality of the cooling algorithm, the
averaged level of the algorithm (Alg
Level
) over all
datasets is compared to the averaged user adjusted
ventilation level (Vent
Level
). Alg
Level
increases with
the physical load during the exercise and thus the
BIOSIGNALS 2010 - International Conference on Bio-inspired Systems and Signal Processing
98
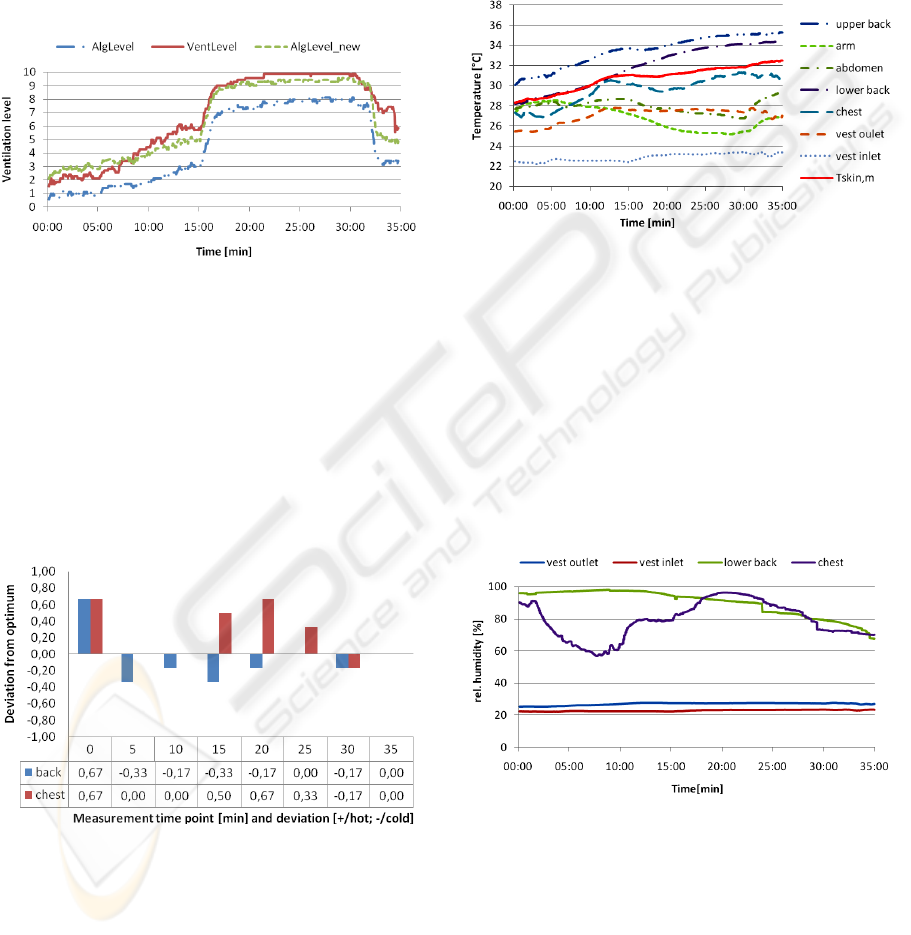
need for cooling. The deviation between Alg
Level
and
the user adjusted value can in good approximation
be interpreted as an offset failure. Further
investigations show that the expected mean skin set
point-temperature Tsk
m0
varies with different
environmental conditions. To improve the algorithm,
Tsk
m0
is adapted to the mean value (30°C) from the
measurement data from the field study. The resulting
ventilation level Alg
Level_new
shows a good dynamic
and stationary accuracy.
Figure 4: Evaluation of the implemented cooling
algorithm; comparison of the different ventilation levels.
The evaluation of the feedback regarding the
thermal sensation during the load test with active
cooling gives information about the distribution of
the cooling capacity. Since the cold air is aspired at
the lower back of the cooling vest, the thermal
sensation tends to be too cold at that area. With
higher loads, the thermal sensation at the chest is
getting hotter because the air warms up and is almost
saturated and therefore insufficiently cools the chest.
Figure 5: Evaluation of the feedback of the test persons.
3.2 Validation of the Sensor Data
3.2.1 Temperature Sensors
To analyze the temperature sensor data, a dataset is
being examined. In figure 6 one could see that the
temperature sensors can be affected by the dynamic
of the body motion. In particular between 15
minutes, where the test person changes from
walking to running and the end of the exercise at 35
minutes, the measured temperatures at the abdomen
and the chest decrease unlike expected. It seems that
the textile integrated temperature sensors loose
direct contact to the skin, which causes a
temperature drop.
Figure 6: Temperature distribution for a test person.
3.2.2 Relative Humidity Sensors
Since the relative humidity is a function of the local
temperature, the reliability of the temperature
measurement has to be taken into consideration
during the analysis. Therefore the body motion is
also influencing the humidity measurement through
the temperature deviation. At the End of the exercise
the humidity values at the lower back and the chest
are falling. This is caused by an increase in the local
temperature and a high level of the ventilation.
Figure 7: Relative humidity distribution for a test person.
3.2.3 Acceleration Sensor
From the raw data of the acceleration sensor, the
Eeac value is calculated. As can be seen in figure 8,
the signal is not directly used as a control input due
to its strong noise and its offset. To compensate the
offset the corresponding Activity equivalent
acceleration (Aeac) signal is calculated.
EVALUATION SYSTEM FOR MONITORING OF VITAL PARAMETERS AND ACTIVE BODY CLIMATE
CONTROL
99
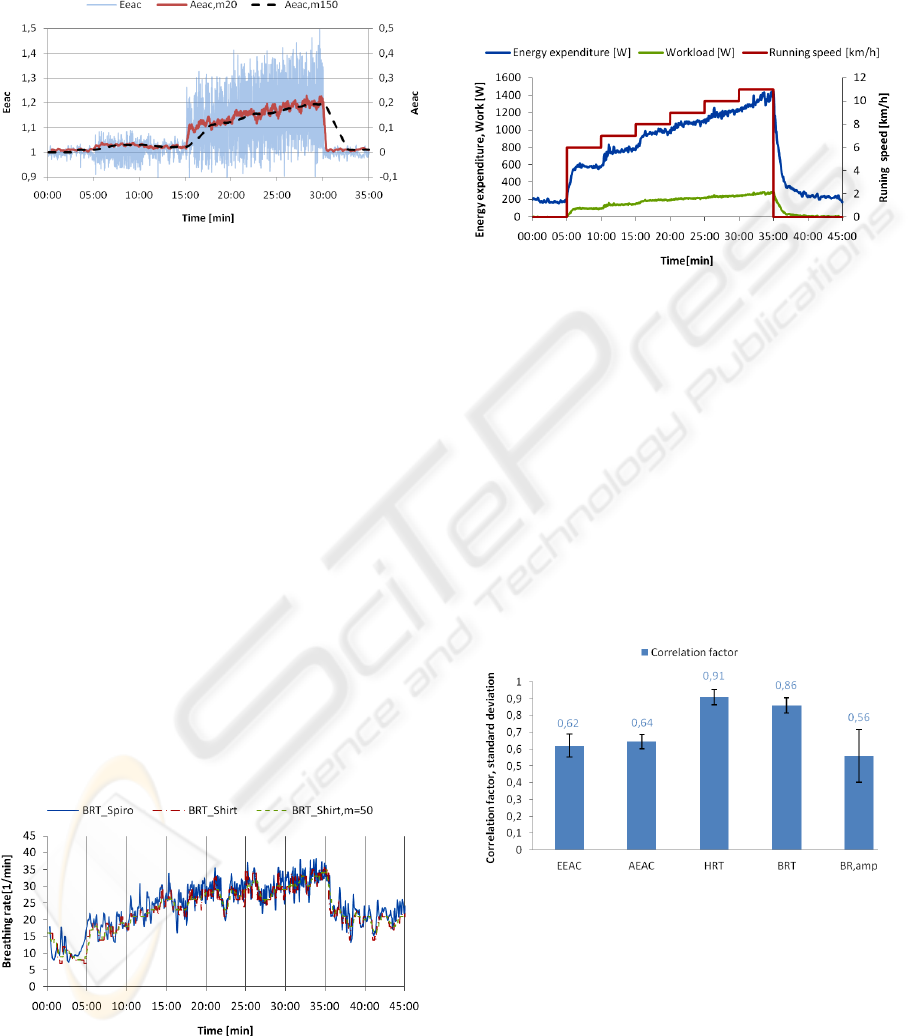
Aeac
= |Eeac
–
1|
(7)
The resulting Aeac signal is filtered to reduce the
noise.
Figure 8: Raw and post processed acceleration data for a
test person.
3.2.4 Breathing Sensor
To evaluate the results of the breathing sensor
(BRT_Shirt) the measured rate is compared to the
rate measured with the spirometer (BRT_Spiro),
which can be seen as reference value due to its high
accuracy. As figure 9 shows, both measurements
match very well. One also could observe that the
measured breathing rate has a slight latency only at
phases with high dynamic. This latency is caused by
the post processing of the raw signal with a median
filter. In the first design of the regulation algorithm
the breathing rate is not included in obtaining
AlgLevel. In fact the determination of the breathing
time volume, which results out of the product from
th breathing rate and the breathing depth and which
correlates directly with the energy expenditure
(Hollmann, 2006), cannot be determined out of the
measured signal. In addition the breathing sensor is
used only on the chest and therefore may not provide
reliable results in the case of abdominal breathing.
Figure 9: Comparison of the breathing rate data
(BRT_Shirt and BRT_Shirt,m50) with the data from the
spirometer (BRT_Spiro) for a test person.
3.2.5 Energy Expenditure
From the spirometer measurement of the O
2
consumption, an energy equivalent can be
calculated, knowing that the human body needs 1l
O
2
for the conversion of 20.9 kJ (Hollmann, 2006).
Figure 10: Workload and energy expenditure during the
load test of a test person.
3.2.6 Regression Analysis
To determine the relation between the measured
vital parameters and the energy expenditure out of
the spirometer data, a correlation analysis is done.
Out of it, the signals with the highest correlation are
used in a regression analysis in order to approximate
an analytical functional relation. For that purpose,
the linear function coefficients are estimated with
the robust least mean square method and a
confidence interval of 95%. Input data are the
energy expenditure and the corresponding sensor
values for all datasets.
Figure 11: Correlation analysis between the measured vital
parameters and the energy expenditure.
Heart Rate
The heart rate is directly influenced by physical
stress due to the higher blood flow. Therefore the
heart rate and the energy expenditure are strong
correlated. In (Hollmann, 2006), a linear relation of
first degree is postulated, which suits our results.
BIOSIGNALS 2010 - International Conference on Bio-inspired Systems and Signal Processing
100
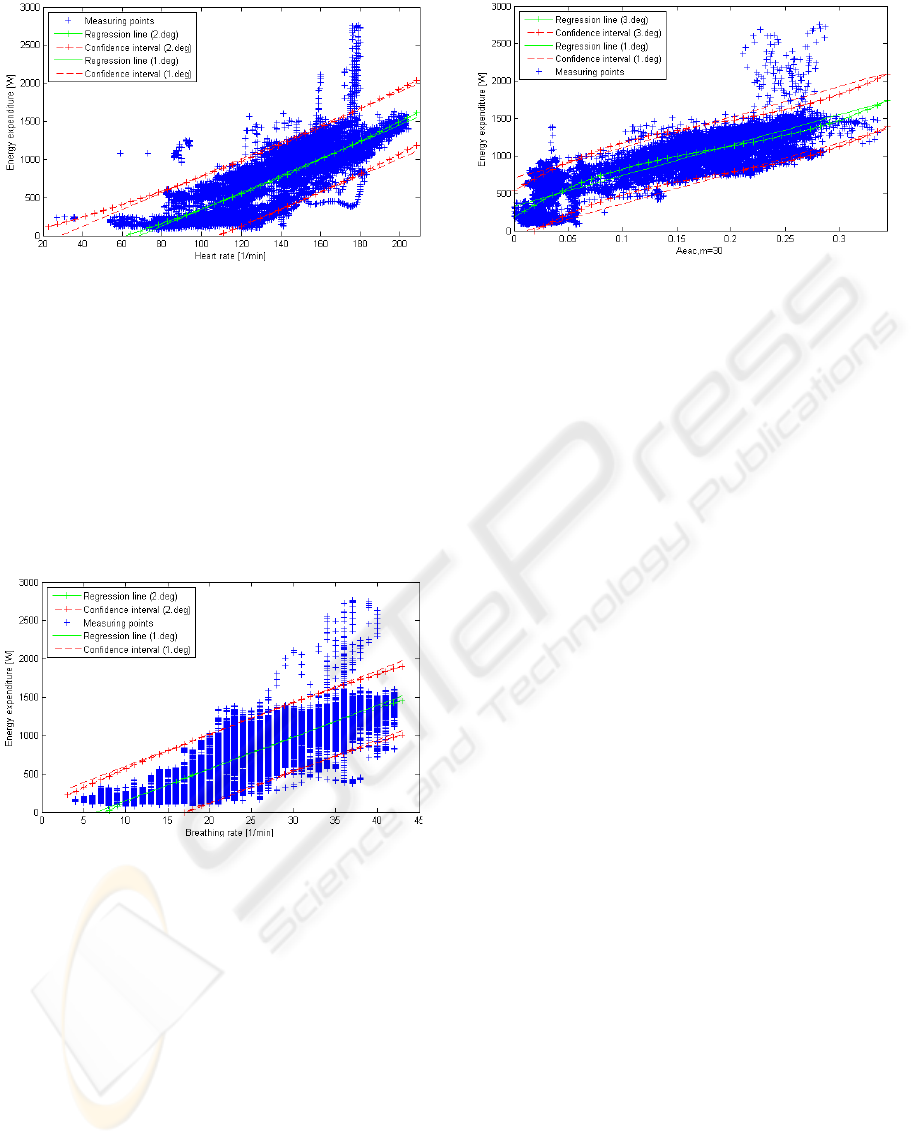
Figure 12: Regression analysis between the heart rate and
the energy expenditure.
Breathing Rate
The correlation between the breathing rate and the
energy expenditure is accounted by the linear rise in
oxygen demand. To meet the demand, the minute
volume can be raised either through faster or deeper
breathing. Thus a variation of the breathing depth is
intensified used at breathing rates of 15-30 [1/min]
(Hollmann, 2006). There the variation from the
linear approximation is higher.
Figure 13: Regression analysis between the breathing rate
and the energy expenditure.
Acceleration
For the mapping of the acceleration data, a first
degree function is not appropriate. Especially at low
acceleration values, a higher gradient is needed to
meet the constraint that the energy expenditure at
rest (AEAC ~ 0) equals the measured average
measured value (~ 165 W). A function of third
degree is used. Functions of higher degree cannot
significantly improve the results. Unlike the heart
rate and breathing rate, the acceleration is influenced
by the nature of the load. Therefore, it has to be
checked if the estimated relation is valid for other
load patterns.
Figure 14: Regression analysis between the acceleration
data and the energy expenditure.
4 DISCUSSION
In this work a regulation algorithm for active body
climate control is heuristically conceived and tested
with an evaluation system by conducting a field
study. The validation of the current regulation
algorithm shows quite gut results. Nevertheless,
more data are needed in order to take into account
the individual characteristics of different test persons
and different environmental conditions. Out of the
second part of the field study, where a spirometer
has been used as a reference measurement for the
body energy expenditure, a correlation and
regression analysis between the sensor shirt data and
the spirometer data shows a good quality of the post
processed sensor data. In addition, analytical
equations are determined in order to approximate the
actual body energy expenditure out of the sensor
data. This finding can now be used for a more
accurate and systematic regulation algorithm, which
implements a data fusion of the measured vital
parameters and estimates the heat energy that needs
to be transported away from the body surface. In
combination with the estimated heat losses, derived
from temperature, humidity and clothing isolation, it
is possible to equalize the heat balance by
calculating the appropriate ventilation level.
Besides, the design of the evaluation system
needs to be optimized according to the feedback of
the test persons during the field study: better fitting
of the cooling vest, more ventilation resources with a
better distribution, etc. Last but not least, a design of
a wireless body area network (WBAN) with more
sophisticated textile integration techniques could
increase the comfort of the cooling system and its
ease of use.
EVALUATION SYSTEM FOR MONITORING OF VITAL PARAMETERS AND ACTIVE BODY CLIMATE
CONTROL
101

ACKNOWLEDGEMENTS
This work is done in the framework of the joint
research project "KlimaJack", which is financed
from the German ministry for education and
research. Besides the Institute for Information
Processing Technology (KIT), other German
industrial parties (Beurer, IMST, Lodenfrey, MVS
and Ruhlamat) are contributing to the conducted
research work.
The field study described in this work is
accomplished in cooperation with the institute of
sports and sport science of the KIT.
REFERENCES
Crawshaw LI, Nadel ER, Stolwijk JAJ, 1975. Effect of
local cooling on sweating rate and cold sensation,
Pflügers Archiv: European Journal of Physiology
354:19–27.
Fiala D., Lomas K.J., Stohrer M., 1999. A computer model
of human thermoregulation for a wide range of
environmental conditions: The passive system, Journal
of Applied Physiology, 87:1957–1972.
Hollmann W., 1963. Höchst- und Dauerleistungsfähigkeit
des Sportlers, Barth, München.
Hollmann W., Strüder H., Predel H.-G., Tagarakis G.,
2006. Spiroergometrie, Schattauer Verlag: Stuttgart.
Jatobá L., Großmann U., Ottenbacher J., Härtel S., von
Haaren B., Stork W., Müller-Glaser K.D., Bös K.,
2007. Obtaining Energy Expenditure and Physical
Activity from Acceleration Signals for Context-aware
Evaluation of Cardiovascular Parameters, Venezuela:
CLAIB.
Knipping H.W., Albrecht H., Valentin H., Venrath H.,
1953. Über die Atmung und das Herzminutenvolumen
bei Arbeit und Sport, sowie die Herzleistung,
Zeitschrift für die gesamte experimentelle Medizin,
122:356–368.
Olesen, B. W., P. O. Fanger, 1973. The skin distribution
for resting man in comfort, Pflügers Archiv: European
Journal of Physiology 27:A385–A393.
Wahlund H., 1948. Determination of the physical working
capacity, Acta Medica Scandinavica, 132:1–78.
BIOSIGNALS 2010 - International Conference on Bio-inspired Systems and Signal Processing
102
