
COMPREHENSIVE DATA REPORTING APPROACH IN
HEALTH CARE INFORMATION SYSTEMS
Tatjana Stankovic, Dragan Jankovic and Petar Rajkovic
The Faculty of Electronic Engineering, University of Nis, Aleksandra Medvedeva 14, Nis, Serbia
Keywords: Data reporting, Healthcare, Electronic Health Record, Report generator, OLAP in healthcare.
Abstract: Modern Medical Information Systems cannot be pictured without fast and reliable data reporting that is used
not only for medical and state statistics, but for medical research and science as well. We have tried to
analyze some of possible ways of using data in medicine. Could one system have only one way of data
reporting and still be efficient enough in medical purposes? This paper answers to this question and some
other questions related to data reporting in Medical Information Systems, from the aspects of developers,
and users as well. It presents three possible ways of data analyzing and reporting, main features of each, and
our solutions related to every approach.
1 INTRODUCTION
After a certain time of the Information system
existence in some health care (HC) facility, usually a
great amount of medical and non-medical data is
collected. Often, there is a need to gain important
decision-making strategy based on the reports above
collected data. Any piece of software used for
medical data analysis and processing should create
clearly formatted, well defined and readable reports
(Lang, 1997).
One of the data processing goals is setting of
hypothesis in research purposes. Data needed for
setting of medical hypothesis are usually collected
within Medical Information Systems (MIS), i.e.
stored in corresponding medical databases. These
databases are very important element of every
information society, because they are directly related
to state of the population’s health. Medical stuff,
researchers, students, professionals, patients and
other people use them to come to data that are
relevant to their business and interests. These
databases are also used to track the development of
health, as indicators of provided services quality, or
to confirm or deny specific hypotheses about trends
of modern life negative influences (Pešić, 2009), etc.
This paper presents and compares three possible
ways of using data from databases (from the aspect
of MISs). We will shortly present data collecting in
section two, and then we'll describe classical data
reports in public HC, generic data reports (more
complicated to the end user), and OLAP data
reporting in section three. We will try to give
reasons why they are all needed in public HC, and
when to use which - according to our research and
experience.
2 COLLECTING DATA IN
PUBLIC HEALTHCARE
The first step in using data is data collecting.
Unfortunately, in the main part of HC facilities in
Serbia, that step is still done manually in paper. In
institutions that have implemented Electronic Health
Record (EHR) data collecting is faster and more
detailed, so it is possible to develop more detailed
reports in a real time. Collected data are patient’s
demographic data, and medical data dimensioned
through many medical parameters. More catalogs
the system has (so user is not allowed to arbitrarily
insert data but to choose from options list provided
in advance), the better data analyses we can get. In
our project of developing HC Information System
for public health (supported by Serbian Ministry of
Science and technological development), we tried to
provide all possible data for the selection, to be able
to generate large number of reports later.
456
Stankovic T., Jankovic D. and Rajkovic P. (2010).
COMPREHENSIVE DATA REPORTING APPROACH IN HEALTH CARE INFORMATION SYSTEMS.
In Proceedings of the Third International Conference on Health Informatics, pages 456-460
DOI: 10.5220/0002744204560460
Copyright
c
SciTePress
3 DATA REPORTING IN HCIS
For the purposes of health information systems (and
other), data reports can be divided into three groups:
1. Classical or static reports;
2. Generic or dynamic reports;
3. OLAP based reports (Tatkar, 2008).
3.1 Classical Data Reports
In both primary and secondary public health in
Serbia there is a strong need for periodical reports
that are submitted to the Republic Institute for
Health Insurance (RZZO). Some of these reports are
(from RZZO site):
General medical service and specialist services
report,
Employment medical service report,
Preschool children healthcare public service
report,
School children healthcare public service
report,
Emergency Medical Services report and many-
many others.
The basic characteristic of this type of reports is
that the report parameters and the layout of the
report are pre-defined. User can only set filter for
these parameters (like period of time, service,
ambulance, and similar). From the above reasons,
this type of reports can be called static reports.
The other important characteristic of this reports
type is that database structure is completely
transparent to the end users. So, users who are not IT
experts can easily generate these reports, which is
the largest part of employees in our health system.
There is a great deal of commercial and non-
commercial tools for generating such reports, for
example: Fast Report, Quick Report, Crystal
Reports, etc. In our project of developing MIS for
public health of our country, we have used Crystal
10.x based on MS SQL Server 2005 platform.
3.2 Generic Data Reports
There is a need in HC facilities to generate reports
that were not pre-defined by project specification.
Such reports are generally required by doctors in
order to follow the status of patient or group of
patients during a period of time, or when they try to
detect some relationships between certain
parameters and conditions of patients, etc.
The main characteristic of this type of reports is
that users can define reports themselves. Parameters
for presentation, relations between database entities,
and logical operators applied to parameters are given
by the end user. To provide easy generating of these
reports to our users, we managed the effort to create
report generator tool and embed it in our MIS.
Report generation process within MIS depends on
the EHR metadata model, as is shown in the
following subsection.
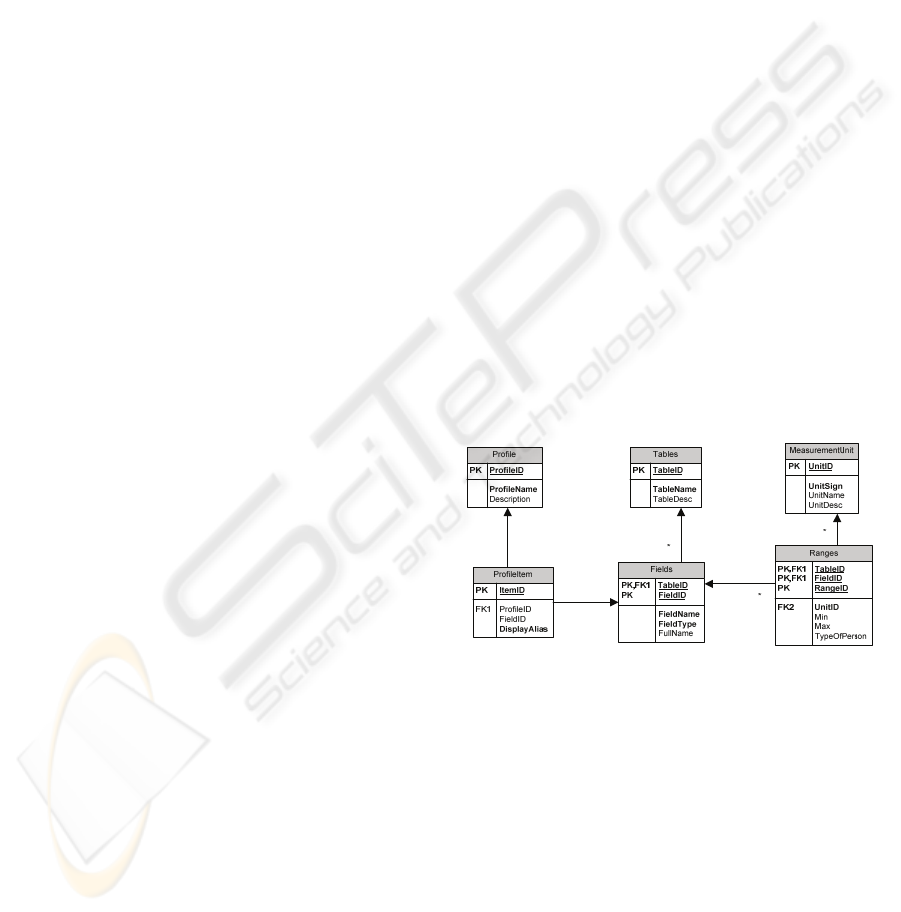
3.2.1 EHR Metadata Model
The very base component of MIS is EHR and
underlying metadata model shown in the Figure 1.
Metadata model is used as a source for creating
reporting profiles for report generating application.
The most important data in MIS are healthcare
related (both medical and non-medical) data that are
grouped in adequate database tables, described in
metadata model. Each of these tables corresponds to
some medical analysis, treatment, or diagnostic.
Every table consists of fields, and values of each
filed are connected with specific data ranges. Each
field’s data type as well as measurement unit must
be defined. These data types will be remapped to
EHR Meta types. EHR Meta types are derived from
the set of basic data types and any data type of target
DBMS can be mapped to some of EHR Meta types.
Following Meta types are defined: Boolean, integer,
decimal, shorttext, and longtext.
Figure 1: EHR - metadata model.
Data ranges are values associated to some data
field of integer or decimal type. Also, Meta system
allows definition of pseudo data ranges for fields of
shorttext type. Range for some of shorttext field is
not range of values but enumeration. Data ranges
represent the most adequate values for specified
population of patients. For example, for field
representing concentration of leucocytes per liter,
one range for patients younger than 18 years can be
defined, one for 18 to 45, and the third for over 45.
Real values can be compared with values from a
suitable range and be marked as very low, low,
normal, high and very high.
COMPREHENSIVE DATA REPORTING APPROACH IN HEALTH CARE INFORMATION SYSTEMS
457
The term profile is here used to describe set of
fields, belonging to different tables, grouped
logically to allow more relevant statistics. Structural,
the profile can be represented as a tree, where root
node is profile-describing node, branches are related
to logical groups of fields and terminal nodes are
related to fields from different data tables. Nodes
from profile representing tree will be called “profile
items” in further text. Each item is defined with two
main values – name within database structure and
alias, name that will be used for displaying profile
on user interface.
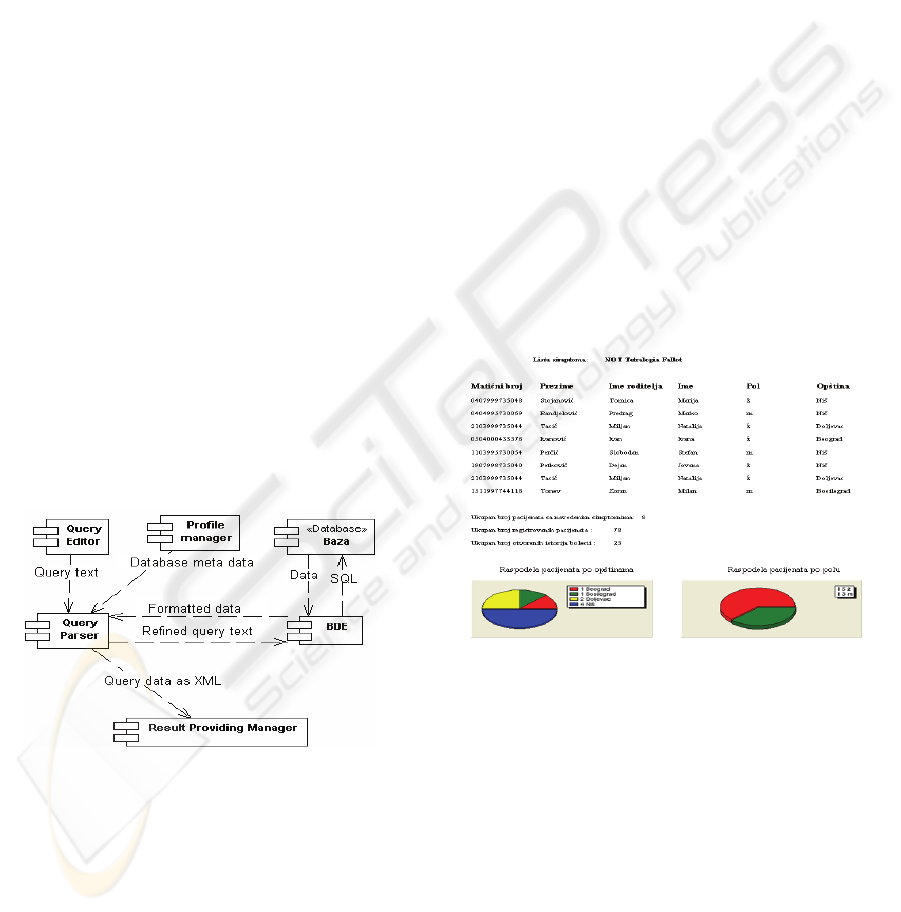
3.2.2 Report Generating Tool
Main parts of the report generator are (Figure 2):
Data Module, Profile Manager, Query Editor, Query
Parser and Result Providing Module.
Data Module manages connection to MIS’s
database and retrieves data from the database.
Profile Manager manages data profiles that are
used as base for report generation and provides basic
operations on them such are creating new profiles,
updating and deleting existing ones.
Query Editor component is used for interaction
with user in order to create query statement
containing profile items.
Query Parser evaluates created query statements,
converts them into SQL queries and forwards to
result providing module.
Result Providing Module formats retrieved data
and displays them in specified format.
Figure 2: Application Modules.
Main application window consists of the tree on
the left side representing structure of groups within
active profile, list of profile items within selected
group and query editor component. User can create
query statement by combining profile items and
available logical operators (NOT, AND, and OR).
Result is a query closer to spoken language than
SQL.
Component named query editor helps user during
query creation. It takes care whether all the open
brackets are closed and what next can be added
(profile item or operator). For example, user cannot
add two binary operators (OR immediately after
AND) one after another.
User can add all Boolean, numeric or textual
items. When user selects Boolean item it will be
directly transferred to the query editor, appearing
there after last operator added. If user selects some
field of string type he has to enter some string value
for comparing. Entered value and field name will be
connected with LIKE operator, and added to query
editor. If there’s an enumeration with predefined
values exists, list of all predefined values will
appear, so user should select one value from the list.
Created query statement can be forwarded to
parser at any time. Parser will transform query to
SQL statement and it will try to execute it. If query
was not well formed, parser will prompt an adequate
error and pass control back to the editor. The next
step is printable version (example is shown at Figure
3).
Now, user can save report as XML file, or export
result to RTF, PDF or XLS file.
Figure 3: Example of created report (titles are in Serbian
language).
3.3 OLAP Data Reports
The third kind of data reporting refers to reports that
include a large amount of data, millions of records
from database.
Online Analytical Processing (OLAP) (Webb,
2009) systems are very efficient tool used in
complex Management Information Systems.
The main characteristic of OLAP system is
multidimensional data storage. Reports move
through data over "dimensions" and "measures".
OLAP translates existing data from relational
schemas by assigning key indicators (measures) to
HEALTHINF 2010 - International Conference on Health Informatics
458
adequate contest (dimensions). The relation between
dimensions and measures can be presented by star
schema (Pešić, 2009).
Developing cube process consists of standard
steps from which the most important and most
demanded are data filtration and data importing to
certain dedicated OLAP tools (Fayyad, 1996). Data
filtration (PREPARATION) implies fault
elimination (irregular inserts, duplicates, data
inconsistency, and violation of referential integrity).
The problem is that mentioned step can significantly
slow down OLAP system developing. Also,
multidimensional databases can very often overcome
system hardware limits, but the largeness of cube
can be decreased by data aggregation before
transporting to OLAP system.
Serbian HCS has experienced great improvement
lately by bringing computers in some clinical and
administrative processes. Yet, there is no full
potentiality of using medical data as management
and diagnostic decision-making source.
EHR is on-line transaction processing (OLTP)
system that enables on-line inserting and updating of
given HC services and documentation, medical
results tracking, and real-time deciding support.
Such OLTP system has great OLAP capabilities in
medical, financial, and administrative area. HC
employers in our country have understood lately the
benefits of those systems, and have been beginning
to show curtain interest in data analysis which would
have helped them to easily achieve answers to
number of every day situation questions.
Unfortunately, the most part of classical OLTP EHR
systems has not suitable support for OLAP systems.
To gain multidimensional system suitable for
easy manipulation above datasets, we needed to pass
curtain phases (Monaco, 2004). Those phases are:
Multidimensional model creating (determining
measures, dimensions and schemas);
Extracting, transformation, and storing data to
created schemas;
Creating and manipulating with reporting by
using relational or multidimensional sources,
and
Generating information from system by using
created reports (algorithm).
3.3.1 Study and Actual Conclusions of
building OLAP over Clinical Data
In an effort to establish analytics related to the
possibility, need, benefits of using OLAP reporting
in public health, as well as the existence of reasons
for the necessity of OLAP in a close future, we have
developed OLAP over Clinic of Neurology Nis
database (store data produced during last 12 years of
work of Clinic), in SQL Server Business Intelligent
Development Studio 2005. Analytics has been done
in this software package, and in ProClarity Desktop
Professional 6.2. Star-schema fact table has been
reduced to 27000 records after significant data
transformation.
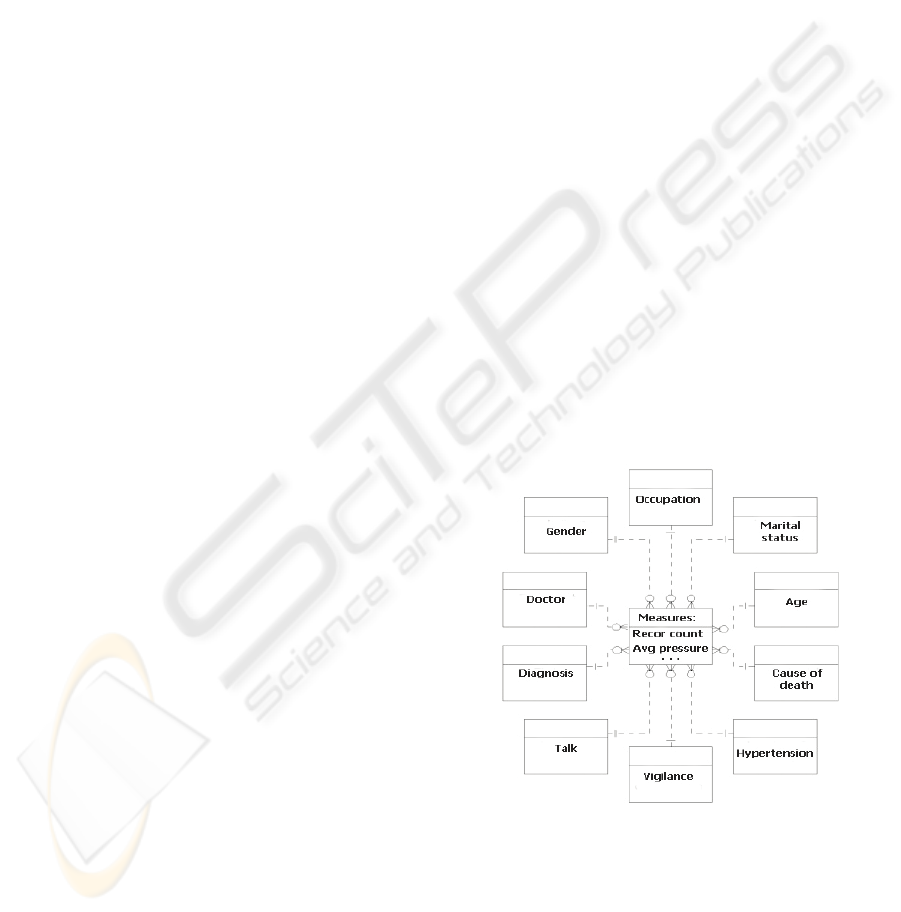
We have selected all possible parameters that
were able to represent the measures, and for the
dimensions as shown in Figure 4.
The results obtained in the built-in OLAP
showed the following.
Cube processing time is not of importance.
Cube processing on database on server configuration
(Intel Pentium Dual CPU E2160 1.80GHz, 3.00GB
RAM) lasted from 10 to 15 seconds, depending on
the number of dimensions included to cube;
Data analytics related to diagnoses, such as for
example, most diagnoses that emerged in more than
400 patient examinations in the period of 10 years,
rare diagnoses and doctors that establish them, etc,
proved to be very simple for the end users. With
tools used for analysis (MS ProClarity Desktop
Professional), even users without IT skills could
very easily acquire the analysis of OLAP, if filed
names (dimensions and measures) were concise and
understandable for them. According to that, more in
database design should take into account the naming
of objects and attributes.
Figure 4: Clinic of Neurology Nis hypercube model,
developed for analysis on the necessity for establishing
OLAP in Public Health
During the report analyses, we came quickly to
expected, but what was even more important by us,
to completely unexpected results. For example:
analytics of the number of patient treatments by
gender, marital status and diagnosis, unexpectedly
COMPREHENSIVE DATA REPORTING APPROACH IN HEALTH CARE INFORMATION SYSTEMS
459
showed that there were significantly more treatments
of married men, but of all other population.
The time needed for OLAP querying is
significantly less than for querying relational
database to get the same results. For executing query
that gives results (15395 records) about number of
patient treatments by gender, marital status and
diagnosis on relational database, we needed ~ 7
seconds. At the same server, the time required to
obtain the same results on cube was ~ 0.2 seconds.
Based on statistical data, we may be able to
make the assessment for this system implementation
to quantitatively greater volume of data. As the test
center will be taken Health Center Nis as one of the
largest institutions of its kind in the Balkans. Let’s
look some of the statistical data that our public
health has collected for years, even without
information system. These data are presented in the
Statistical Yearbook for the city of Nis for the year
2007, and they are related only to the General
Practice (Table 1).
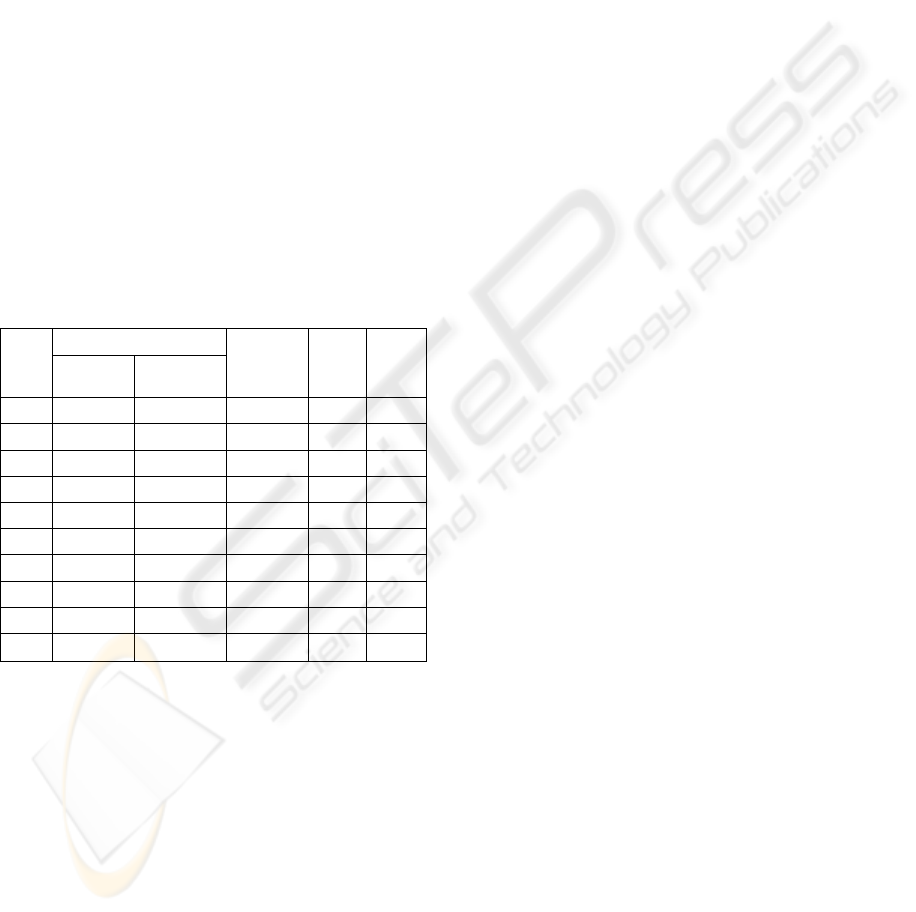
Table 1: Clipping from the table 19.7. General Medicine
Service – SGN2007.
Year Treatments
Total
treatment
s
Threat.
per
doctor
Home
treatme
nts
First tr. Repeated
treatment
1998 220 551 385 475
606 026
7 390 17 715
1999 214 549 392 159
606 708
7 399 17 987
2000 261 378 465 199
726 577
8 146 18 429
2001 278 694 507 511
786 205
8 276 19 613
2002 288 092 454 697
742 789
7 902 19 811
2003 262 603 513 943
776 546
8 261 20 268
2004 287 352 486 403
773 755
7 661 12 138
2005 275 923 532 314
808 237
8 164 5 069
2006 268 735 536 795
805 530
7 897 7 662
2007 227 938 515 049
742 987
6 694 17 915
The number of visits to general service
ambulance (Table 1) per year is between 600 000
and 800 000. For all primary HC in this area this
number may be up to 7-8 million per year. For the
base at which we have built OLAP system for
analysis, the number of visits included is not greater
then 30000. Even in this case, we have received a
significant difference by comparing the time needed
for querying common relational database, and OLAP
cube. The time required to execute the same reports
over OLAP database is 35 to 100 times less
compared to classical reports.
4 CONCLUSIONS
Modern MISs are not suited only for collecting data
but for representing these data in a best possible way
for given purposes as well. There is a great need in
every society and its medical science for analyzing
medical data. Although there is some commercial
software for data statistics and analyzing like SPSS
is (Statistical Package for the Social Sciences), using
such software usually demands strong IT skills.
Public health employees in our country are not IT-
trained, and for the use of specialized tools health
institution would have to engage IT experts, which is
always an expensive solution for public budget.
Developing MIS for public health, we have
studied all needed aspects of data reporting in
medicine, divided possible data reporting to three
types (Classical, Generic and OLAP based), and
developed our solutions for every type. We have
come to conclusions that MIS would not be
complete without any of them, and that every way of
data reporting and analyzing has its own benefits,
depending on the demands. Therefore, we have
included all three types of reports in our system. For
Classical and OLAP based reports we have used
existing commercial tools, while for generic reports
we have developed our own solution.
REFERENCES
Lang, T., Secic, M., How to Report Statistics in Medicine,
American College of Physicians, Philadelphia, USA,
1997.
Pešić, S., Stanković, T., Janković, D., Benefits of Using
OLAP Versus RDBMS for Data Analyses in Health
Care Information Systems (in Serbian), INFOTEH-
JAHORINA Vol. 8, Ref. E-VI-5, p. 751-755, March
2009.
http://www.izjzkg.rs/article/socijalna-medicina/centar-za-
informatiku-i-biostatistiku-u-zdravstvu.html
Webb, C., Ferrari, A., Russo, M., Expert Cube
Development with Microsoft SQL Server 2008
Analysis Services, Packt Publishing Ltd, Birmingham,
UK, July 2009.
Fayyad, U., Piatetsky-Shapiro, G., Smith, P., Advances in
Knowledge Discovery and Data mining, MIT Press,
pp. 1-34, Cambridge, 1996.
Monaco, G., An Introduction to OLAP in SQL Server
2005, http://www.devx.com/dbzone/Article/21410/,
2004.
Tatkar, R., OLAP Comprehensive Analysis of a Large
Pool of Clinical Data, Article taken from
http://www.ehealthonline.org, December 2008.
HEALTHINF 2010 - International Conference on Health Informatics
460
