
DEVELOPMENT OF A COMPACT X-RAY PIV SYSTEM AND
NEW X-RAY FLOW TRACERS
Visualization of Opaque Biofluid Flows using X-ray PIV System
Sang Joon Lee and Sung Yong Jung
Center for Biofluid and Biomimic Research, Department of Mechanical Engineering, Pohang University of Science and
Technology (POSTECH), San 31, Hyojadong, Pohang 790-784, South Korea
Keywords: Medical X-ray, PIV (Particle Image velocimetry), Microparticles, X-ray contrast.
Abstract: A compact X-ray particle image velocimetry (PIV) system employing a medical X-ray tube as a light source
was developed to obtain quantitative velocity field information of opaque flows. The X-ray PIV system
consists of a medical X-ray tube, an X-ray CCD camera, a programmable shutter for generating a pulse-type
X-ray beam, and a synchronization device. Through performance tests, the feasibility of the developed X-
ray PIV system as a flow measuring device was verified. In applying the developed system to biofluid
flows, the most important prerequisite is to develop suitable flow tracers which should be detected clearly
by the X-ray imaging system. Iopamidol was encapsulated into the poly(vinyl alcohol) (PVA)
microparticles to fabricate such flow tracers. The characteristics of the fabricated microparticles were
checked. With increasing the amount of crosslinker, the degree of crosslinking and the efficiency of the
Iopamidol encapsulation were increased. This compact X-ray PIV system is a unique and useful for
investigating various biofluid flows in laboratory experiments.
1 INTRODUCTION
Recently, abnormal blood flows such as formation
of recirculation flow or low wall shear stress have
been known to play a key role in the pathology of
atherosclerosis (Malek et al., 1999). For more
detailed and meaningful elucidation about these
hemodynamic phenomena related with vascular
diseases, it is definitely needed to get quantitative
hemodynamic information of blood flows related
with the vascular diseases with high spatial
resolution of tens micrometer and temporal
resolution in the order of millisecond.
Currently, various medical instruments such as
Doppler ultrasonography, MRI (Magnetic
Resonance Imaging) and X-ray angiography have
been used to measure the blood flow. However, each
method has intrinsic problems in diagnosing the
hemodynamic aspects of vascular diseases in more
detail. Doppler ultrasonography is one dimensional
point measurement tool and has relatively high
errors caused by its angle dependency. For the case
of MRI method, real time measuring is very limited
due to low temporal resolution and its spatial
resolution is not so good enough. X-ray angiography
provides morphological information of blood vessels
and blood velocity can be evaluated using
concentration difference of iodine contrast media
from consecutive digital images (Rhode et al., 2005).
Unfortunately, this method is also not suitable for
acquiring blood flow information inside blood
vessels due to low spatial resolution and it is also
limited to apply to flow in a short vessel. These
limitations of conventional clinical diagnosis
methods bring about a strong demand on a more
effective and advanced analysis tool which can
provide more detailed, quantitative hemodynamic
information of blood flows.
On the other hand, The particle image
velocimetry (PIV) method, which extracts velocity
vectors of tracer particles seeded in a flow by
obtaining their displacement, has been accepted as
one of the reliable velocity measurement techniques
with high spatial and temporal resolutions (Adrian,
1991). However, it is difficult for the PIV method to
visualize the blood flows inside blood vessels of
vascular diseases under in vivo condition, because
the conventional PIV techniques have used a visible
light source which cannot transmit an opaque blood.
To overcome these limitations on conventional PIV
32
Lee S. and Jung S. (2010).
DEVELOPMENT OF A COMPACT X-RAY PIV SYSTEM AND NEW X-RAY FLOW TRACERS - Visualization of Opaque Biofluid Flows using X-ray PIV
System.
In Proceedings of the Third International Conference on Biomedical Electronics and Devices, pages 32-37
DOI: 10.5220/0002738100320037
Copyright
c
SciTePress

systems, a transmission-type light source such as X-
ray or ultrasonic wave should be used instead of
visible light.
An X-ray PIV technique using a synchrotron X-
ray source was developed (Lee and Kim, 2003).
Thereafter, several application studies have been
performed, such as blood flows (Kim and Lee,
2006), flow of micro bubbles (Lee and Kim, 2005),
glycerin flow (Im et al. 2007), sap flow in a bamboo
leaf (Lee and Kim, 2008), and 3D X-ray PIV
application (Fouras, 2008). The synchrotron X-ray
PIV system, however, is not easy to use for general-
purpose research works because synchrotron facility
is very limited to getting beam times and
synchrotron X-rays are usually dangerous for
biological samples due to its high flux. Therefore, in
the consideration of X-ray PIV applications, the
substitution of the synchrotron X-ray source with a
medical X-ray tube is a straightforward and natural
consequence.
As far as we surveyed, there has been no trial
conducted to combine the medical X-ray imaging
method and the PIV velocity field measurement
technique with seeding fine tracer particles in the
flow. In this study, we established a new compact X-
ray PIV system employing a conventional medical
X-ray tube, an X-ray CCD camera equipped with the
frame-straddling feature, and a newly developed
mechanical shutter for generating double pulses of
X-rays. This compact X-ray PIV system has a spatial
resolution of tens of micrometers and a temporal
resolution of several milliseconds.
In applying the developed system to blood flows,
the most important prerequisite is to develop suitable
flow tracers which should be detected clearly by the
X-ray imaging system. The tracers should be able to
follow properly the fluid flow to be measured. In
addition, they should be bio-compatible and can be
removed safely without any harm to the living
organism. In earlier X-ray PIV experiments, alumina
particles (Lee and Kim, 2003) and silver-coated
hollow glass beads (Fouras et al., 2007; Im et al.,
2007) were used to track the fluid flows. However
none of them is suitable for visualizing blood flows,
because their specific weight is relatively high and
they are not bio-compatible nor bio-degradable. The
speckle pattern of red blood cells was also used to
get their velocity information (Kim and Lee, 2006).
However, this method is not conducive to in-vivo
applications due to image blurring and noises
generated by the surrounding materials such as
tissues. Therefore, the in-vivo velocity field
measurements of opaque biofluid flows have not
been fully satisfactory so far.
Poly(vinyl alcohol) (PVA) is a carbon-
backboned polymer that is biodegradable under both
aerobic (Nord, 1936) and anaerobic (Matsumura et
al., 1993) conditions. In this point of view, the
grafting functional oligomers were incoporated into
PVA chain. The PVA chain has been tried to be
modified widely where the biodegradable vinyl
alcohol block plays an essential role in the
functional polymer composites (Matsumura et al.,
1988). Iopamidol (also known as Solutrast®) is a
nonionic, low-osmolar iodinated contrast agent
developed by Bracco. It has been commonly used in
clinical angiography to enhance the absorption
contrast. In this study, Iopamidol was encapsulated
into bio-compatible and bio-degradable PVA
microparticles. The Iopamidol encapsulated PVA
was templated by W/O (water-in-oil) emulsion. It
was specially designed as flow tracers for
quantitative X-ray imaging of biofluid flows. The
compact X-ray PIV system and new X-ray flow
tracers are expected to expand the application areas
of the X-ray PIV technique even to the in vivo
velocity field measurement of various blood flows.
2 COMPACT MEDICAL X-RAY
PIV SYSTEM
Figure 1 shows the schematic diagram of the
compact X-ray PIV system developed in this study.
In the compact X-ray PIV system, a conventional
medical X-ray tube was used as a light source. The
most important issue in PIV measurements is
acquiring two consecutive flow images within a
short time interval. For this, double pulses of X-rays
should be generated from an X-ray tube and then a
detector needs to record two consecutive X-ray
Figure 1: Schematic diagram of the established compact
X-ray PIV system.
DEVELOPMENT OF A COMPACT X-RAY PIV SYSTEM AND NEW X-RAY FLOW TRACERS - Visualization of
Opaque Biofluid Flows using X-ray PIV System
33
images with high spatial resolution and good
sensitivity.
The pixel size of most clinical X-ray detectors
used in medical radiography is larger than 50 μm. In
addition, the conventional X-ray detectors cannot
provide the frame-straddling feature indispensable
for PIV measurements. In this study, we purchased a
customized X-ray CCD camera of 4000
× 2672
pixels from Hamamatsu Co. The architecture of this
CCD camera is identical with that of a cooled CCD
camera, the exception is that a CsI scintillation
crystal of 100μm in thickness is adhered to the top of
the CCD sensor array. Due to high sensitivity of the
CsI scintillator, this X-ray CCD is well fitted to the
compact X-ray PIV system for acquiring X-ray
images suitable for PIV velocity field measurement.
Related to the medical X-ray source, because an
X-ray tube with a smaller focal spot size can provide
clearer particle images (Jenneson et al., 2003), we
employed an X-ray tube (Varian A272) with a focal
spot size of 0.3/0.6mm at 100/300 mA for 40~150
kVp. The maximum exposure time of the X-ray tube
(Varian A272) is 5sec at 200mA and 60kVp. The
total pulse length of X-ray beam fired from the X-
ray tube is an input parameter on the X-ray tube
controller (SMS-525). In this experiment, the total
pulse length was fixed at 100 ms. This long pulse
was chopped into two short X-ray pulses by using a
mechanical shutter newly developed in this study.
The actual pulse length of each short pulse was 5 ms
and the time interval between two X-ray pulses was
20 ms. This X-ray tube was synchronized through an
external triggering switch by using a photocoupler
chip and a transistor transistor logic (TTL) signal
from a delay generator.
The X-ray shutter system connected with a 4-
channel synchronizer plays a key role in
synchronizing the X-ray tube, the X-ray detector,
and the rotating disc of the shutter. The delay
generator takes the pulse signal of 1 pulse/rev from
the encoder of the DC motor and then the X-ray tube
takes two pulse signals of “X-ray ready” and “X-ray
shot” from the delay generator. The X-ray CCD
camera is synchronized by using the delay generator.
The timing sequence for synchronization of the
compact X-ray PIV system is mainly determined
from the disk geometry and motor rotation speed.
Finally, the X-ray PIV system can provide two
chopped X-ray pulses for recording two consecutive
X-ray images.
3 PERFORMANCE EVALUATION
To check the feasibility of the developed compact
X-ray PIV system, we measured velocity fields of a
flow of glycerin (
ρ
= 1.260 g/cm
3
) inside an opaque
tube of 4 mm in diameter. The width of an X-ray
pulse fired from the X-ray tube was 100 ms. This
pulse was chopped into two short X-ray pulses of 5
ms width with a time interval of 20 ms using the
developed X-ray shutter. The X-ray CCD camera
then recorded two X-ray images consecutively.
Tungsten oxide particles were used as tracer
particles. The particle has a relatively high density
(ρ
p
) of 7.2 g/cm
3
and a high attenuation coefficient
for X-rays. Since the size of the tracer particles is in
the range of 10~50 μm in diameter, it is appropriate
for recording images with the X-ray CCD camera.
Glycerin solution having a viscosity coefficient (μ
f
)
of 1.50 N·s/m
2
was used as a working fluid. The
free-falling speed of the tracer particles (U
g
) in the
glycerin fluid is in the range of 0.216~5.395 μm/s, a
negligibly small under the given experimental
condition. We tested a tube flow at two different
mean velocities of 1mm/s and 2mm/s. As the two
velocity fields obtained were substantially the same,
the experimental result measured at the mean
velocity of 2mm/s is only represented in this paper.
The size of interrogation area was 16
(H)
× 128
(V)
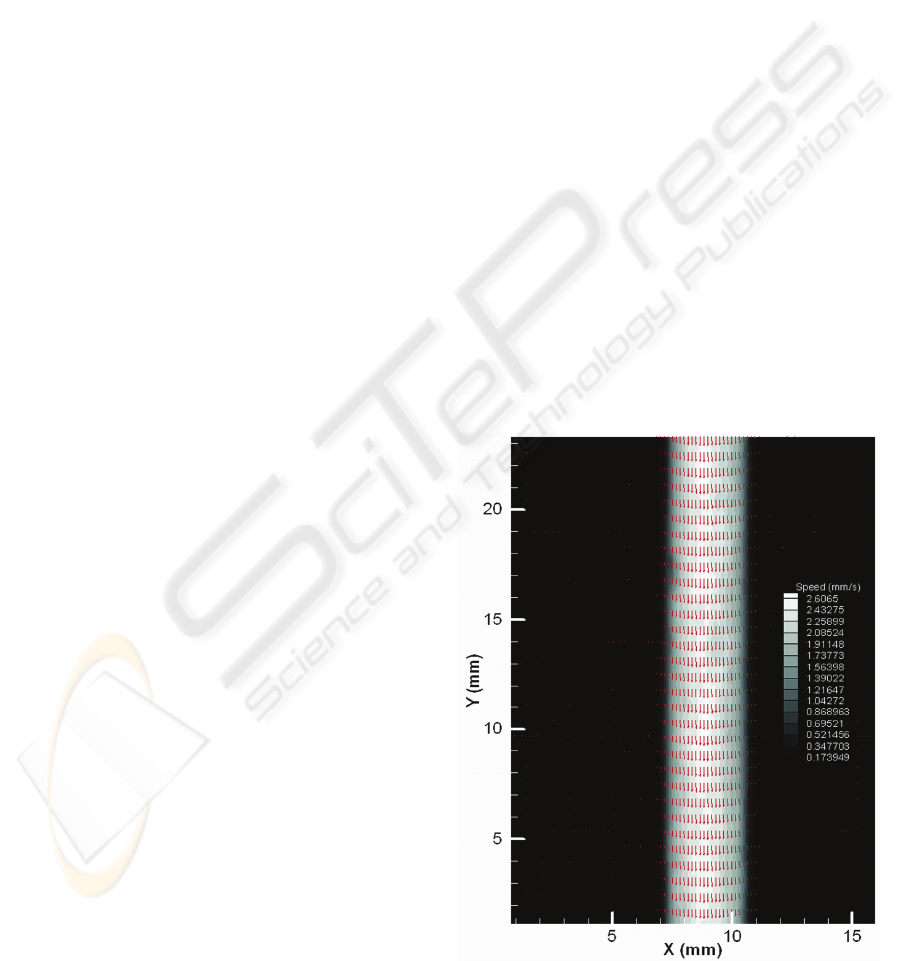
Figure 2: Mean velocity field of glycerin flow in a tube
measured by the compact X-ray PIV system.
BIODEVICES 2010 - International Conference on Biomedical Electronics and Devices
34
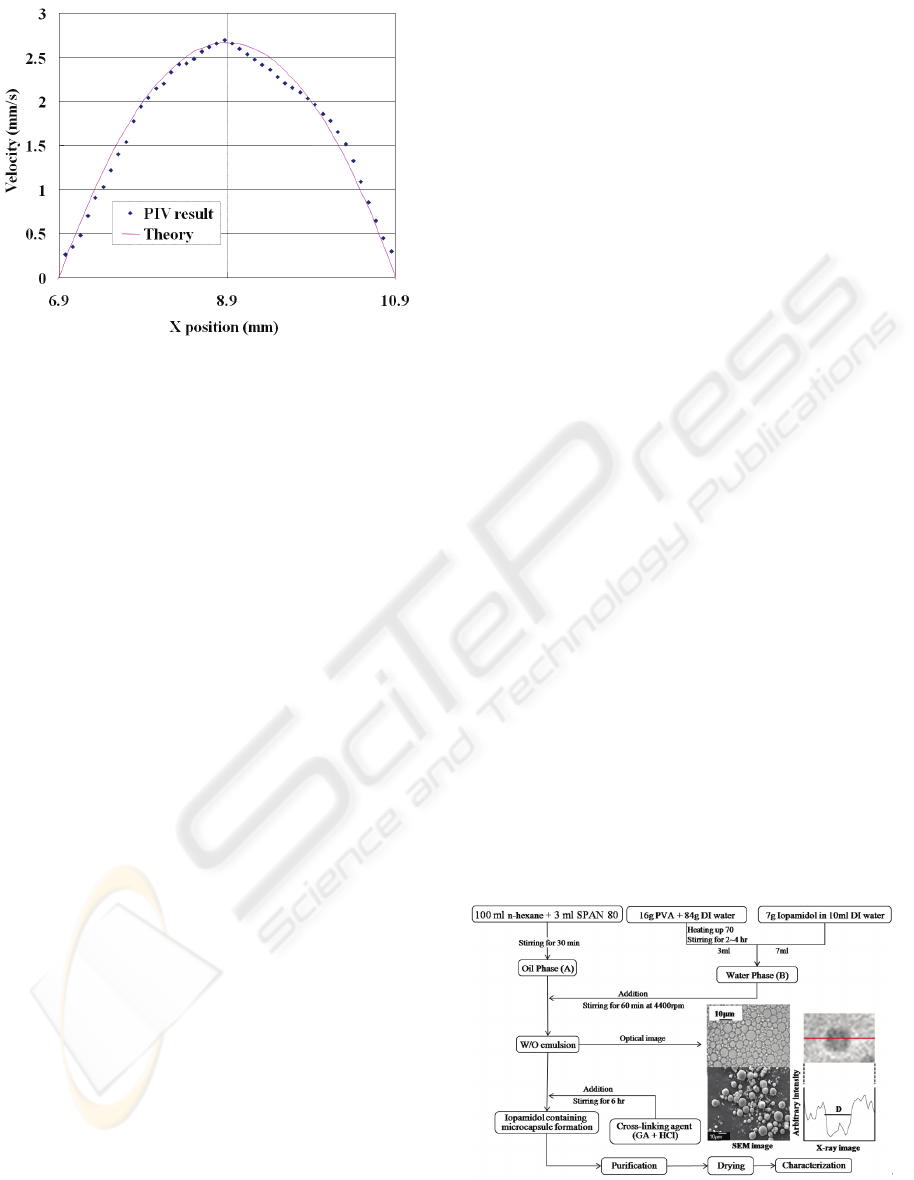
Figure 3: Comparison of velocity profiles of the test flow
in a tube.
pixels in the consideration of dominant longitudinal
flow. The number of particles in each interrogation
window was about 4-8 on average. We obtained 25
pairs of X-ray images to get velocity field
information.
The images of tracer particles seeded into the
opaque tube are apparent. In addition, there is no
optical distortion in the region near the tube wall.
From the two consecutive X-ray images, quantitative
velocity field information was obtained by applying
a cross-correlation PIV algorithm. Figure 2
represents a typical mean velocity field obtained by
ensemble averaging 25 instantaneous velocity fields.
The glycerin flow in the circular tube seems to have
a parabolic velocity profile with a maximum value at
the tube center. Actually, it is nearly impossible for
other flow measurement techniques to obtain this
kind of quantitative velocity field information of a
flow inside an opaque conduit.
Figure 3 shows the velocity profile across the
tube diameter, extracted from the mean velocity
field. The solid dots are the experimental data
obtained and the parabolic line represents the
theoretical velocity profile. The experimental results
measured with the developed compact X-ray PIV
system agree well with the theoretical one. The
spatial resolution between two adjacent velocity
vectors is about 91 μm, which is much better than
that of the MRI method (Pahernik et al. 2001).
The small discrepancy between the two velocity
profiles seems to be attributed to the density
difference of the tracer particles and the working
fluid. In addition, the cohesion feature of tungsten
particles in glycerin also has some influence on the
velocity difference.
4 FABRICATION OF NEW X-RAY
FLOW TRACERS
In applying the compact X-ray PIV system to blood
flows, new microparticles were developed as
suitable flow tracers. The detailed flow chart of
particle synthesis procedure is schematically shown
in Fig. 4. 3 ml of oil soluble Span 80 (HLB=4.3) was
dissolved in 100 ml n-hexane (A). 41 wt%
Iopamidol stock solution and 16 wt% of PVA
aqueous solution were prepared overnight at the
room temperature and 70°C, respectively. 3 ml of
PVA aqueous solution (4.8 x10
-2
g/mL) and 7 ml of
Iopamidol stock solutions (4.8 x10
-1
g/mL) were
mixed (B). The oil phase (A) was added in drop
forms to the water phase (B) by stirring at 4400 rpm.
After stirring for one hour at the room temperature,
emulsion picture was taken using an optical
microscopy to check the size of the microreactor.
Controlled amount of glutaraldehyde (GA) was
introduced as a crosslinker with proper amount of
hydrochloric acid (0.04 ~ 0.16g) for activation. The
homogenizing process was performed for additional
6 hours at the room temperature with keeping the
same stirring rate. The emulsion formation (4400
rpm) was followed by the overnight stabilization. To
remove unreacted residues, the filtering and washing
process were repeated several times with n-hexane
and de-ionized (DI) water and then centrifuged to
get the settle-downed particles. The filtered particles
were de-moisturized in the drying oven at 60°C and
then placed in the desiccator until there is no further
variation in their mass.
The microdroplets of the fabricated water-in-oil
(W/O) emulsion in this study were several
micrometers in diameter and their size distribution
was relatively narrow. After the formation of stable
emulsion, the designed amount of crosslinker was
Figure 4: Schematic diagram of the microparticle
synthesis.
DEVELOPMENT OF A COMPACT X-RAY PIV SYSTEM AND NEW X-RAY FLOW TRACERS - Visualization of
Opaque Biofluid Flows using X-ray PIV System
35
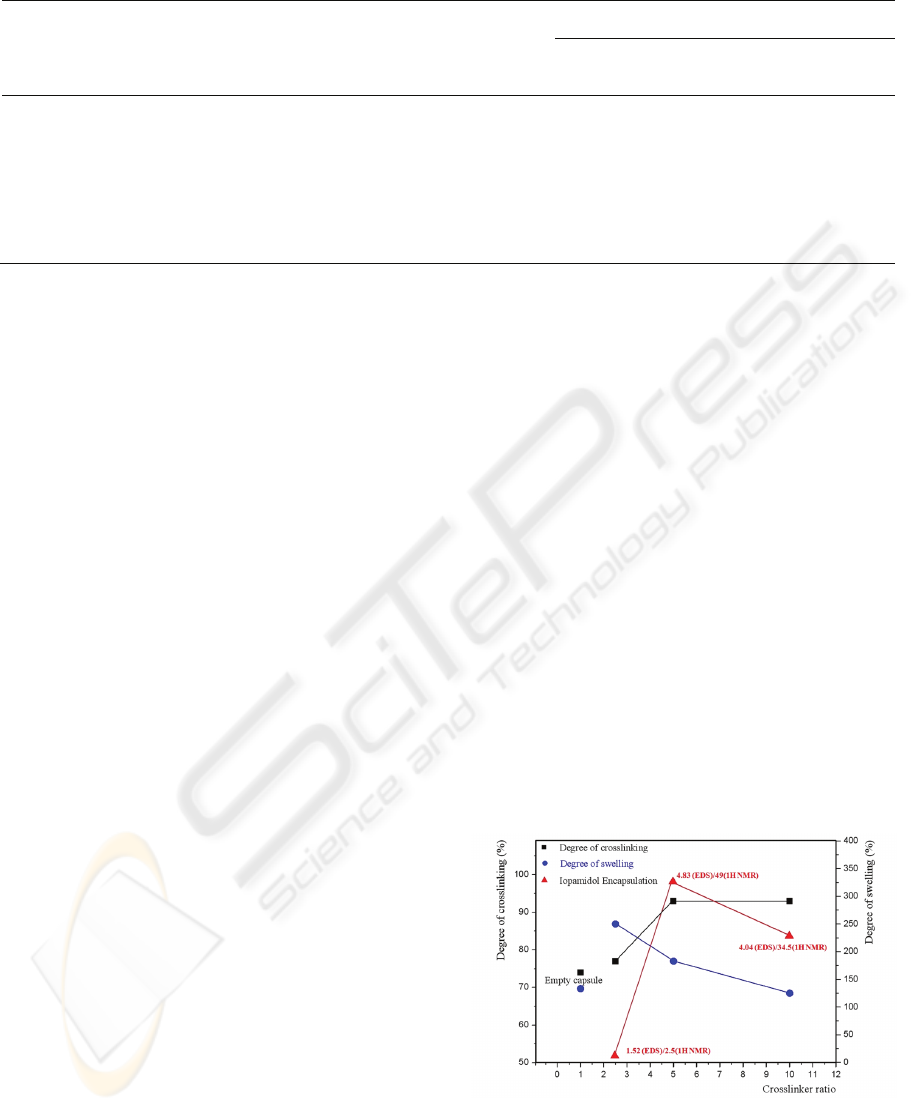
Table 1: Specifications of the particles fabricated in this study.
Particle
Crosslinker
ratio (a)
Average
diameter [μm]
Degree of
swelling
[%]
Degree of
crosslinking
[%]
Amount of Iopamidol
EDS
[atomic %]
1
H NMR
[mole]
#1
2.5 6.14 250 77 1.52 2.5
#2
5 6.92 183 93 4.83 49.0
#3
10 8.64 125 93 4.04 34.5
Empty
capsule
1 9.17 133 74 0 0
incorporated. Four hydroxyl groups of the PVA are
supposed to be connected by one glutaraldehyde
molecule. Considering the amount of hydroxyl
groups in the PVA, three different types of particle
sensors were fabricated by changing the amount of
glutaraldehyde (GA). For the case of particle #1,
0.00625 mole of GA was incorporated, which
corresponds to 2.5 times of the possible crosslinker
units in PVA. Likewise, 5 times (0.0125 mole) of
GA were added into the particle #2. For the particle
#3, 10 times of those (0.025 mole) were added,
corresponding to 0.1 mole of hydroxyl groups in the
PVA. Table 1 summarizes the specifications of each
particle fabricated in this study.
5 THE CHARACTERISTICS OF
TRACER PARTICLES
The particle size and their distributions were counted
and averaged from several images produced through
scanning electron microscopy (SEM). The average
diameter of the particles ranged from 6 to 9 μm, and
this value increased with the increase of the
crosslinker (GA) ratio from particles #1 to #3.
Therefore, the added crosslinker used in this study
contributed to the increased size rather than led to
the network shrinkage. The degree of crosslinking
was determined by the
1
H NMR. The chemical shift
of particles #1, #2, and #3 were compared with pure
Iopamidol, empty capsule, and uncrosslinked PVA.
The methylene group newly formed by crosslinking
increased along with an increase in crosslinker ratio
from particles #1 to #3, while the peaks in the
methylene groups in uncrosslinked PVA decreased
by that order. As summarized in Table 1, the
quantitative degree of crosslinking exhibited a value
of 77% in particle #1 and then reached the optimum
of 93% in particle #2; no further increase in particle
#3 was observed.
Meanwhile, the degree of swelling was measured
by dissolving the particles in deionized water until
there was no further increase in their mass according
to the relation, W = (W
s
− W
d
)/W
d
x100 [%], where
W
s
is the mass of the fully swollen particle, and W
d
is
that of the dried particle. As the added crosslinker
increased, the degree of swelling in DI water was
observed to show a decreasing trend. The degree of
maximum swelling reflects the equilibrium between
the dilution of the polymer chain into the solvent and
the retractive force produced by the crosslinked
junction points that serve to restrict further swelling.
Given that the chemical compositions of all the
particles are supposed to be similar (similar Flory-
Huggins interaction parameter, χ), the difference in
the degree of swelling seemed to be mainly caused
by the network structure. The particles became less
elastic from particles #1 to #3, reflecting more
densely crosslinked network structure by that order.
The amount of the encapsulated Iopamidol was
obtained by measuring the energy dispersive X-ray
spectroscopy (EDS) connected with SEM and then
averaging the value from the three randomly
Figure 5: Degree of crosslinking vs. swelling and
Iopamidol encapsulation according to the crosslinker ratio.
selected particles. Iopamidol encapsulation was also
determined by
1
H NMR where the chemical shift of
BIODEVICES 2010 - International Conference on Biomedical Electronics and Devices
36

particles #1, #2, and #3 were compared with those of
the characteristic methyl group peaks in the pure
Iopamidol. In both methods, the efficiency of the
Iopamidol encapsulation increased dramatically in
particle #2 compared with particle #1 brought about
by the increase in the added crosslinker. The amount
of Iopamidol reached the maximum in particle #2
and decreased slightly in particle #3. Although the
degree of crosslinking detected by the
1
H NMR was
almost same in particles #2 and #3, the degree of
swelling in particle #2 was slightly higher. From this,
we can assume that particle #2 has a more flexible 3-
dimensional structure compared to particle #3,
which could lead to higher encapsulation of
Iopamidol in the former. The relation between the
degrees of crosslinking and swelling, as well as the
amount of Iopamidol encapsulations are graphically
summarized in Figure 5. Due to the presence of the
elastic force equilibrium between the retractive and
extended forces, the degrees of crosslinking and the
swelling exhibited opposite tendencies, while
Iopamidol reached the maximum amount at the
optimized encapsulation in particle #2.
6 CONCLUSIONS
The compact X-ray PIV system combining the
conventional X-ray radiography technique and PIV
velocity field measurement method was developed.
Through preliminary tests, the spatial and temporal
resolution of this system was found to be higher than
any conventional clinical instruments. In addition,
new X-ray flow tracers were fabricated by
encapsulating Iopamidol into bio-compatible
polymer PVA. The functional characteristics of the
fabricated microparticles were checked. With
increasing the amount of crosslinker, the degree of
crosslinking and the efficiency of the Iopamidol
encapsulation were increased. In near future, the
developed system would be employed usefully for
measuring in vivo velocity field information of blood
flows.
ACKNOWLEDGEMENTS
This work was supported by the Creative Research
Initiatives (Diagnosis of Biofluid Flow Phenomena
and Biomimic Research) of MEST/KOSEF.
REFERENCES
Adrian, R. J. (1991) “Particle-imaging techniques for
experimental fluid mechanics”, Annual Review of
Fluid Mechanics, Vol. 23, pp. 261-304.
Fouras, A., Dusting, J., Lewis, R. and Hourigan, K. (2007)
“Three-dimensional synchrotron X-ray particle image
velocimetry”, Journal of Applied Physics, Vol. 102,
064916.
Im, K.S., Fezzaa, K., Wang, Y. J., Liu, X., Wang, J. and
Lai, M. C. (2007) “Particle tracking velocimetry using
fast X-ray phase-contrast imaging”, Applied Physics
Letters, Vol. 90, 091919.
Jenneson, P. M., Gilboy, W. B., Morton, E. J. and Gregory,
P. J. (2003) “An-ray micro-tomography system
optimised for the low-dose study of living organisms”,
Applied radiation and isotopes, Vol. 58, pp. 177-181.
Kim, G. B. and Lee, S. J. (2006) “X-ray PIV
measurements of blood flows without tracer particles”,
Experiments in Fluids, Vol. 41, pp. 195-200.
Lee, S. J. and Kim, G. B. (2003) “X-ray Particle Image
Velocimetry for measuring quantitative flow
information inside opaque objects”, Journal of Applied
Physics, Vo. 94, pp. 3620-3623.
Lee, S. J. and Kim, S. (2005) “Simultaneous measurement
of size and velocity of microbubbles moving in an
opaque tube using an X-ray particle tracking
velocimetry technique”, Experiments in Fluids, Vol.
39, pp. 492-497.
Lee, S. J. and Kim, Y. M. (2008) “In vivo Visualization of
the Water-refilling Process in Xylem Vessels Using X-
ray Micro-imaging”, Annals of Botany, Vol. 101, pp.
595-602.
Malek, A., Alper, S. and Izumo, S. (1999) “Hemodynamic
shear stress and its role in atherosclerosis”, JAMA, Vol.
282, pp. 2035-2042.
Matsumura, S., Kurita, H. and Shimokobe, H. (1993)
“Anaerobic biodegradability of polyvinyl alcohol”,
Biotechnology Letters, Vol. 15, pp. 749-754.
Matsumura, S., Takahashi, J., Maeda, S. and Yoshikawa,
S. (1988) “Molecular design of biodegradable
functional polymers, 1. Poly(sodium vinyloxyacetate)”,
Die Makromolekulare Chemie, Rapid
Communications, Vol. 9, pp. 1-5.
Nord, F. F. (1936) “Dehydrogenation activity of Fusarium
lini B”, Naturwissenschaften, Vol. 24, 763.
Pahernik, S., Griebel, J., Botzlar, A., Gneiting, T., Brandl,
M., Dellian, M. and Goetz, A.E. (2001) “Quantitative
imaging of tumour blood flow by contrast-enhanced
magnetic resonance imaging”, British Journal of
Cancer, Vol. 85, pp. 1655-1663.
Rhode K.S., Lambrou T., Hawkes D.J. and Seifalian A.M.
(2005) “Novel approaches to the measurement of
arterial blood flow from dynamic digital x-ray images”,
IEEE TRANSACTIONS ON MEDICAL IMAGING,
Vol. 24, pp. 500-513.
DEVELOPMENT OF A COMPACT X-RAY PIV SYSTEM AND NEW X-RAY FLOW TRACERS - Visualization of
Opaque Biofluid Flows using X-ray PIV System
37
