
NEURAL NETWORKS FOR THE MODELING
OF CONCENTRATION OF CHEMICALS
José S. Torrecilla
Department of Chemical Engineering, Universidad Complutense de Madrid
Avda. Complutense, s/n., 28040, Madrid, Spain
Keywords: Neural Network, Sensor, Chemometric Tool, Foods, Environment, Ionic Liquids.
Abstract: Recently, biosensors based on carbon nanotubes have gained considerable attention because of their novel
properties such as their high surface area, electrical conductivity, good chemical stability and extremely
high mechanical strength, among others. Nevertheless, to extract the most relevant information from those
huge databases formed by the output of biosensors, statistical techniques are required. In the last decade,
given the characteristics of neural networks (NNs), one of the most important and widely applied techniques
is based on them. Here, successful applications of NNs as chemometric tools in different types of sensors
are studied. In particular, describing the uses of NNs in the quantification of ionic liquids and hydrocarbons
in their quaternary mixtures, lycopene and β-carotene in food samples (by sensors), poliphenolic compounds
(hazardous materials in olive oil mill wastewater, by biosensors), glucose, uric and ascorbic acids in
biological mixtures (by nanobiosensors). In general, the mean prediction error values are comparable with
those values in other non portable commercial analytical equipment.
1 INTRODUCTION
Humans possess the almost perfect example of a
sensor, with the senses continuously supplying real
time data to the brain. Using the sensory elements
(eyes, ears, skin, nose and tongue), all perceptible
information contained in our environment can be
obtained. Then, by signal transducers, this
information is filtered and processed in the most
wonderful natural computer, the human brain.
Finally, depending on the results, humans react.
The two most important parts of this marvelous
system are the five sensors and certainly our natural
“computer”, but using these senses not all properties
can be detected (e.g. radioactivity, low concentration
of impurities in the air, etc.) nor can the natural
computer work using all format of signals (pressure,
electrical signals, etc.). The real meaning of these
limitations teaches us to adapt the design to the
property to be measured and the type of signal to be
processed. In the technical field, to quantify the
desired properties the appropriate physicochemical
characteristics should be found, and the
mathematical algorithms used should work using
adequate information and format.
Sensors are considered as adequate if they obey
three main rules viz. the sensor should be sensitive
to the measured property and insensitive to any
other, and it should be influenced by neither the
sample nor the measured property. In addition, the
mathematical relation between the output signal and
the measured property value should be linear.
However, although this relation would be
mathematically linear, several types of deviations
can be observed and make the measurement process
more difficult. These deviations could have its origin
in systematic or random errors. Examples of these
deviations could be hysteresis, long term drift,
digitalization error, offset, etc.
Among the large number of sensors, an extensive
family is formed by biosensors. Their history started
with the first reference to these types of sensor
which appeared in the 1960s (Clark and Lyons,
1962). Biosensors and nanobiosensors are
measurement systems for the detection of an analyte
that combines a biological component (enzymes, cell
receptors, protein, peptide, oligonucleotide, etc.)
with a physicochemical detector. These types of
sensors are capable of continuous measurement of
analytes in biological media such as blood serum,
urine, etc. (Torrecilla et al., 2008b). Among other
applications, it is used to measure biomoleculars
and/or monitoring biological processes.
580
Torrecilla J. (2010).
NEURAL NETWORKS FOR THE MODELING OF CONCENTRATION OF CHEMICALS.
In Proceedings of the 2nd International Conference on Agents and Artificial Intelligence - Artificial Intelligence, pages 580-584
Copyright
c
SciTePress

Focusing on chemometric tools, there are many
references where linear and non linear algorithms
are used to determine/quantify compounds.
Although linear algorithms use a lower number of
parameters than non linear algorithms, because the
latter show statistical performance, these are more
widely used in the chemical field. Recently,
coupling biosensor responses with computation
strategies based on neural networks (NNs) have been
growing in importance because of its application to
multicomponent analysis (Lovanov et al., 2001;
Torrecilla et al., 2009). This type of chemometric
tool has already demonstrated its utility for
interpretation of experimental data in the
determination of pesticides (Trojanowick, 2002),
phenolic compounds (Gutes et al., 2005; Torrecilla
et al., 2007), neuroactive species (Ziegler, 2000) and
ethanol–glucose mixtures (Lovanov et al., 2001).
Given their successful results, the estimations of the
concentrations of chemicals in complex multi-
component mixtures using this type of algorithms
have been here described. In particular, different
successful approaches, using of neural networks and
different types of sensors, have been studied. In
particular, four applications of NNs in the
quantification of the concentrations of chemicals in
four different chemical systems have been
described: (i) two ionic liquids (ILs) and two
hydrocarbons in their quaternary mixtures; (ii)
Lycopene and β-carotene in food samples; (iii)
poliphenolic compounds in olive oil mill
wastewater; (iv) glucose, uric and ascorbic acids in
biological mixtures.
2 EXPERIMENTAL
2.1 Neural Networks
The supervised NNs used in all described
applications are a multilayer perceptron (MLP). It
consists of several neurons arranged in three layers:
input, hidden, and output layers. The topology of the
NN is given by the number of layers and number of
neurons in each layer. The input layer is used to
input data into the NN; the nonlinear calculations are
carried out in the other two layers. The calculation
process in each neuron of the hidden and output
layers consists of transfer and activation functions.
The activation function, eq 1, means that the input
data to each neuron are multiplied by a self-
adjustable parameter called weight, w, the result, xk,
is then fed into a transfer function. The algorithm
used in all applications described here is the sigmoid
transfer function, eq 2. The calculated value, yk, is
the output of the considered neuron. The NNs used
were designed by Matlab version 7.01.24704
software (Demuth et al., 2005).
1
·
j
jjkk
ywx
(1)
k
x
kk
e
xfy
1
1
)(
(2)
The learning process, which updates the weights to
improve the predictive capacity of the NNs, is
carried out by minimizing the error prediction, eq 3,
using the back-propagation model (Torrecilla et al.,
2009).
k
kkk
yrE
2
)(
2
1
(3)
In all cases presented here, in order to optimize the
parameters of the NNs used Central Composite
experimental designs have been used. The variables
analyzed were the hidden neurons number, learning
coefficient, learning coefficient decrease and
learning coefficient increase and the responses were
correlation coefficients (real vs. predicted values)
and mean prediction error (MPE), equation 4.
n
n
nn
r
yr
N
MPE 100·
1
(4)
In equation 4, N, yk and rk, are the number of
observations, model estimation and real value,
respectively.
2.2 Principal Component Analysis
Description
Mathematically, the principal component analysis
method (PCA) is based linear algebra. It is used
abundantly from neuroscience to computer graphics,
because it is a simple and a non-parametric method
of extracting relevant information from confusing
data sets. This technique reduces complex data sets
to lower dimensions revealing the underlying
simplified structures and preserving the information
from the original data. It is based on the assumption
that most information about classes is contained in
the direction along which the variation is the largest
(Wang and Paliwal, 2003).
2.3 Sensors
In this work, three types of sensors have been used
viz. two commercial UV-vis spectrophotometers
(Varian Cary 1E UV-vis, Torrecilla et al., 2009, and
Pharmacia Ultrospec 4000 UV/vis, Torrecilla et al.,
NEURAL NETWORKS FOR THE MODELING OF CONCENTRATION OF CHEMICALS
581
2008), laccase biosensor (Campuzano et al., 2002)
and a gold-nanoparticle enzyme biosensor (vide
infra) (Mena et al., 2005; Cai et al., 2001).
3 RESULTS AND DISCUSSIONS
One of the principal problems in accurately
quantifying concentration of chemicals in complex
mixtures is the chemical signals overlapping. In
general, three methods can be used to overcome this,
viz. the design of a specific measurement system,
the application of powerful mathematical algorithms
(Torrecilla et al., 2009) and, depending on the
system, both mentioned techniques can be applied
simultaneously (Torrecilla et al., 2008b). The
application of NNs on the four aforementioned
chemical systems is shown here.
3.1 Determination of Two Ionic
Liquids, Heptanes and Toluene
Concentrations
Currently, ionic liquids (ILs), due to their properties,
have attracted increasing attention as replacements
for conventional organic solvents in many other
scientific and industrial fields (Plechkova and
Seddon, 2008).
Recently, although ionic liquids are being measured
using interpolation in physicochemical properties
(density, viscosity, refractive index, etc.), proton
nuclear magnetic resonance, gas chromatograph,
etc., but these are not adequate to measure/control
on-line chemical processes (extraction, distillation,
etc.) because of the time required to prepare
samples. Given the importance of these processes,
an analytical technique with a sample preparation
time less than the sampling time of the process and a
reliable algorithm are necessary. In order to validate
the NN algorithms as a powerful chemometric tool,
the system based on low concentrations (less than 15
ppm) of toluene, heptane and 1-ethyl-3-
methylimidazolium ethylsulfate ([emim][EtSO
4
])
and 1-butyl-3-methylimidazolium methylsulfate
([bmim][MeSO
4
]) ionic liquids (ILs) in acetone was
selected. Given that the imidazolium ring of both ILs
and toluene are UV active in the same region and the
UV-visible spectroscopy fulfilled all the
aforementioned conditions, the NN algorithms can
be reliably tested to solve overlapping effects of
quaternary mixtures on line.
A NN/UV-vis approach has been optimized and
validated using samples with toluene, heptanes,
[emim][EtSO
4
] and [bmim][MeSO
4
] ILs
concentrations between 0 and 15 ppm. As a result of
an application of principal component analysis to
UV-vis absorbance values between 190 and 900 nm
wavelengths, seven principal components (PCs)
have been selected as the main variables. Using
seven PCs, 99.767 % of the total variance in the UV-
vis absorbance values is explained, table 1 (Schott,
2006). Using these seven variables, the NN
algorithm’s parameters are optimized by an
experimental design, Table 2. Then, the optimized
NN was validated by the application of this NN to
estimate the concentration of 25 new samples never
seen before. In this process, the mean prediction
error was less than 2.5 % and the mean correlation
coefficient was higher than 0.95.
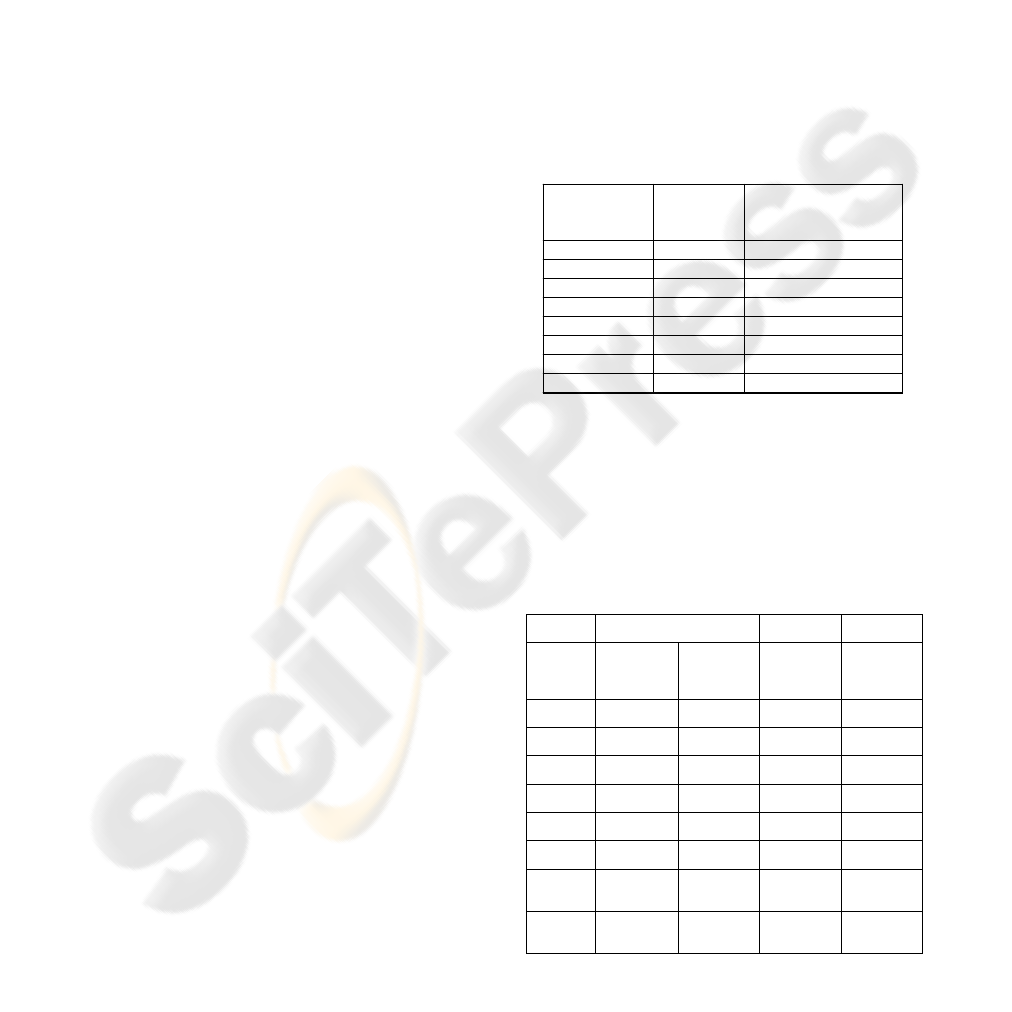
Table 1: Main Characteristics of the PCs Selected.
Principal
components
Eigenvalue
Accumulated
explained variance
(%)
PC-1
626.155
88.067
PC-2
62.425
96.847
PC-3
9.477
98.180
PC-4
4.822
98.858
PC-5
3.194
99.307
PC-6
2.103
99.603
PC-7
1.165
99.767
PC-8
0.280
99.806
Therefore, the PCA/NN/UV can be adapted to
deconvolute the contribution of each chemical. As a
result, in the ionic liquid field, this approach is very
interesting for further applications to digital control,
or measurement devices (Torrecilla et al, 2009;
Torrecilla et al., 2007).
Table 2: Parameters of the NN models used.
UV-Vis spectroscopy
Laccase
biosensor
Nano
biosensors
Hydrocarbons
and ILs
determination
Carotenoids
determination
Cathecol and
caffeic acid
determination
Glucose,
ascorbic and
uric acids
determiantion
Transfer
function
Sigmoid
Sigmoid
Sigmoid
Sigmoid
Training
function
Bayesian
Regulation
Bayesian
Regulation
Bayesian
Regulation
Bayesian
Regulation
Input
nodes
7
2
1
11
Hidden
neurons
20
5
7
13
Output
neurons
4
2
2
3
Learning
Coefficient
0.5
0.32
1
0.001
Learning
Coefficient
decrease
0.018
0.67
0.879
1
Learning
Coefficient
increase
51
57
117
100
ICAART 2010 - 2nd International Conference on Agents and Artificial Intelligence
582

3.2 Determination of Carotenoid
Concentrations in Foods
Lycopene and β-carotene chemicals belong to the
carotenoids family. These are widespread in nature
being the main group of pigments with important
metabolic functions. Due to its antioxidant activity,
these chemicals show a strong correlation between
carotenoid intake and a reduced risk of some
diseases, such as cancer, atherogenesis, bone
calcification, eye degeneration, neuronal damages
etc. Due to their characteristics of solubility and
instability, the analytical methods for measuring
carotenoids in vegetables are limited which makes
necessary a very careful handling process and a
short analysis time to avoid degradation and
isomerization. Because of this, a reliable and rapid
analysis method for carotenoid quantification in
vegetable products is required (Schoefs, 2002;
Bicanic et al., 2003).
Given that the lycopene and β-carotene are active in
the same region of UV-vis spectroscopy, their
determination by linear algorithms are not suitable
(Torrecilla et al., 2008). In order to use this fast,
simple analytical technique, a nonlinear algorithm
based on NN algorithm has been applied on the UV
absorbance data at 446 and 502 nm wavelengths.
Using these absorbance values of 25 binary mixtures
composed of lycopene and β-carotene with
concentration between 0.4-3.2 μg mL
-1
and their
respective concentration distributed following an
experimental design, the NN was optimized, Table
2. Once the NN model was optimized, NN/UV-Vis
spectroscopy was applied to determine the
concentration of both chemicals in food samples
such as tomato concentrate, tomato sauce, ketchup,
tomato juice and tomato puree. The mean prediction
error value was 1.5% and the correlation coefficient
was higher than 0.99. The mean prediction error is
fifty times lower than when a linear model is used in
place of non linear algorithms. This improvement in
the results is extremely valuable for its application to
a fast and reliable lycopene and β-carotene
evaluation in food samples without using complex
analytical methods.
3.3 Determination Polyphenolic
Compounds Concentrations
in Olive Oil Mill Wastewater
In the manufacture of extra virgin olive oil, waste is
produced and it has a serious environmental impact
due to its high content of organic substances (sugars,
tannins, polyphenols, polyalcohols, pectins and
lipids, etc.) It is known that caffeic acid (CA) and
catechol (CT) are two of the major contributors to
the toxicity of these wastes. Given their
electrochemical characteristics, laccase biosensor
(LB) is commonly used to determine CA and CT.
Because of the similarities in the produced oxidized
species, the amperometric signal overlapping in the
reduction voltammograms is high, and therefore, a
powerful tool is required to solve this signal.
Using voltammogram profiles of 300 samples and
their respective concentrations of caffeic acid and
cathecol, an NN was optimized. Once the NN model
was optimized, it was validated using real
concentration taken from three different olive oil
mills in Spain (Almendralejo, Badajoz; Martos,
Jaén; Villarejo de Salvanes, Madrid). The mean
prediction error (equation 4) was less than 0.5 % and
the correlation coefficient was higher than 0.999,
these statistical results are even better and more
selective than other non portable commercial
analytical equipment. Therefore, the integrated
NN/LB system is an adequate approach to estimate
both hazardous chemicals in olive oil mill
wastewater.
3.4 Determination of Glucose, Uric
and Ascorbic Acids in Biological
Mixtures
The major obstacle for the amperometric detection
of glucose in real samples is the interference arising
from electro oxidizale substances such as ascorbic
and uric acids existing in a measured system. Here,
an amperometric biosensor based on a colloidal gold
- cysteamine - gold disk electrode with an enzyme
glucose oxidase and a redox mediator,
tetrathiafluvalene, co-immobilized atop the modified
electrode, was used for the simultaneous
determination of glucose, ascorbic and uric acids, in
ternary mixtures. The concentrations of these
chemicals were between 0 and 1 mM.
As a consequence of an experimental design, 125
cyclic voltammograms of ternary mixtures and their
respective concentrations were used to optimize the
NN model, Table 2. Then, the optimized NN was
validated. The mean prediction error (equation 4)
was less than 1.74% and the correlation coefficient
was higher than 0.99. In the light of these results, the
NN model is able to solve the interferences between
glucose, ascorbic and uric acids without any
chemical pre-treatment.
NEURAL NETWORKS FOR THE MODELING OF CONCENTRATION OF CHEMICALS
583

4 CONCLUSIONS
In order to test the capability of algorithms based on
neural networks to solve the overlapping effect
between chemicals, different types of sensors have
been revised here. In the light of the statistical
results, chemometric tools based on NNs are suitable
to solve the overlapping effect in the systems here
revised, without any chemical pretreatment. And
given the short time taken to estimate the
concentration, this tool can be applied to calculate
the concentration of chemicals on line. Although
every application should be previously tested, these
successful results are extremely promising for other
types of sensors.
ACKNOWLEDGEMENTS
The author is grateful to the Spanish “Ministerio de
Ciencia e Innovación” for financial support for
project CTQ2008-01591 and for a Ramón y Cajal
research contract.
REFERENCES
A. Gutés, F. Céspedes, S. Alegret, M. del Valle, Biosens.
Bioelectron. 20, 1668 (2005).
A. Lovanov, L. Borisov, S. Gordon, R. Greene, T.
Leathers, A. Reshetilov, Biosens. Bioelectron. 16,
1001 (2001).
B. Schoefs. Trends Food Sci. Technol. 13, 361 (2002).
C. Ziegler, A. Harsch, W. Goepel, Sens. Actuators B-
Chem. 65, 160, (2000).
D. Bicanic, M. Anese, S. Luterotti, D. Dadarlat, J. Gibkes,
M. Lubbers, Rev. Sci. Instrum., Part 2, 74, 687 (2003).
H. Cai, C. Xu, P. He, Y. Fang. J. Electroanal. Chem. 510,
78 (2001).
H. Demuth, M. Beale, M. Hagan. Neural Network
Toolbox For Use with MATLAB1; User’s Guide,
Version 4.0.6. Ninth printing Revised for Version
4.0.6 (Release 14SP3), 2005. The Math Works, Inc:
Massachusetts, USA.
J S. Torrecilla, M. Cámara, V. Fernández-Ruiz, G. Piera, J
O. Caceres. J. Agric. Food Chem. 56, 6261 (2008).
J. R. Schott. J. MultiVar. Anal. 97, 827 (2006).
J. S. Torrecilla, A. Fernández, J. García, F. Rodríguez,
Ind. Eng. Chem. Res. 46, 3787 (2007).
J. S. Torrecilla, E. Rojo, J. García, M. Oliet, F. Rodríguez.
Ind. Eng. Chem. Res. 48, 4998 (2009).
J. S. Torrecilla, M. L. Mena, P. Yáñez-Sedeño, J. García,
J. Agric. Food Chem. 55, 7418 (2007).
J. S. Torrecilla, M. L. Mena, P. Yáñez-Sedeño, J. García,
J. Chemometr. 22, 46, (2008b).
L. C. J. Clark, C. Lyons, Electrode systems for continuous
monitoring in cardiovascular surgey. Annals of the
New York Academy of Sciences 102, 29 (1962).
M. Mena, P. Yañez-Sedeño, J. Pingarrón, Anal. Biochem.
336, 20 (2005).
M. Trojanowick, Electroanal. 14, 1311 (2002).
N. V. Plechkova, K. R. Seddon. Chem. Soc. Rev. 37, 123
(2008).
S. Campuzano, R. Galvez, M. Pedrero, F. Manuel de
Villena, J. Pingarrón, J. Electroanal. Chem. 526, 92
(2002).
X. Wang, K. K. Paliwal. Pattern Recognit. 36, 2429
(2003).
ICAART 2010 - 2nd International Conference on Agents and Artificial Intelligence
584
