
PITCH-ASYNCHRONOUS GLOTTAL INVERSE FILTERING OF
NORMAL AND PATHOLOGICAL VOICES BASED ON
HOMOMORPHIC PREDICTION
Rub´en Fraile
1
, Malte Kob
2
, Juana M. Guti´errez
1
, Nicol´as S´aenz-Lech´on
1
Juan Ignacio Godino-Llorente
1
and V´ıctor Osma-Ruiz
1
1
Department of Circuits & Systems Engineering, Universidad Polit´ecnica de Madrid
Carretera de Valencia Km 7, 28031 Madrid, Spain
2
Erich Thienhaus Institute, Hochschule f¨ur Musik Detmold
Neustadt 22, D32756 Detmold, Germany
Keywords:
Speech analysis, Glottal inverse filtering, Vocal tract filter, Cepstral analysis.
Abstract:
Inverse filtering of speech signals for the separation of vocal tract and glottal source effects has a wide variety
of potential applications, including the assessment of glottis-related aspects of voice function. Among all
existing approaches to inverse filtering, this paper focuses on homomorphic prediction. While not favoured
much by researchers in recent literature, such an approach offers two advantages over others: it does not
require previous estimation of the fundamental frequency and it does not rely on any assumptions about the
spectral enevelope of the glottal signal. The performance of homomorphic prediction is herein assessed and
compared to that of an adaptive inverse filtering method making use of synthetic voices produced with a
biomechanical voice production model. The reported results indicate that the performance of inverse filtering
based on homomorphic prediction is within the range of that of adaptive inverse filtering and, at the same
time, it has a better behaviour when the spectral envelope of the glottal signal does not suit an all-pole model
of predefined order.
1 INTRODUCTION
In a discrete signal processing framework, the most
basic, yet widely used, voice production models map
the human phonatory system to a set of linear systems
connected in cascade. In their simplest form, such
models consist of three blocks (Rabiner and Schafer,
1978): the voice source (glottal source) G(z), which
may be either a quasi-harmonic or a noise-like sig-
nal, depending on the type of sound being modelled
(voiced or unvoiced), a vocal-tract filter V (z) that
adds resonances to the signal and a radiation filter
R(z) that accounts for flow-to-pressure conversion
in the lips. Actually, using non-invasive measuring
techniques only the output of the composite system
S(z) = G(z) ·V (z) · R(z) can be measured as an au-
dio signal. In this context, glottal inverse filtering is
a blind deconvolution problem consisting in estimat-
ing the glottal source G(z) from the recorded voice
S(z) without any a priori knowledge on the form of
V (z) ·R(z). While the extraction of the glottal source
from recorded voice is of interest for many applica-
tions and several algorithms for such inverse filtering
have been proposed, to present a standard automatic
procedure is still lacking (Walker and Murphy, 2007).
The highest difficultyin glottal inverse filtering (as
in other blind deconvolution problems) is the discrim-
ination among the effects of individual systems of the
overall output. In the specific case of glottal inverse
filtering, this problem is approached in a number of
different ways (Walker and Murphy, 2007):
• Pitch-synchronous approaches: They require
identification of glottal closure instants. The rea-
son for this need may either be for analysing glot-
tal closed phase (Wong et al., 1979), which is a
time interval in which the vocal tract receives no
input and, therefore, output voice is assumed to
be independent of glottal source, or for isolating
glottal source periods whose waveform may be
estimated either adaptively (Akande and Murphy,
45
Fraile R., Kob M., M. Gutierrez J., Sáenz-Lechón N., Ignacio Godino-Llorente J. and Osma-Ruiz V. (2010).
PITCH-ASYNCHRONOUS GLOTTAL INVERSE FILTERING OF NORMAL AND PATHOLOGICAL VOICES BASED ON HOMOMORPHIC PREDICTION.
In Proceedings of the Third International Conference on Bio-inspired Systems and Signal Processing, pages 45-52
DOI: 10.5220/0002699300450052
Copyright
c
SciTePress

2005) or jointly with the vocal tract (Fu and Mur-
phy, 2006).
• Pitch-asynchronous approaches: These ap-
proaches do not necessarily require either
detection of specific time instants or pitch-period
calculation, though the performance of some
of them may be increased including pitch syn-
chronism. The most known scheme in this
group is the Iterative Adaptive Inverse Filtering
(IAIF) algorithm (Alku, 1992). It assumes a
two-pole model for the glottal source and uses
such assumption to refine the all-pole vocal tract
estimation. A similar approach based on lattice
filters has been reported in (G´omez-Vilda et al.,
2008). An alternative asynchronous approach
consists in making use of the deconvolution ca-
pabilities of cepstrum for discriminating between
glottal source and vocal tract plus radiation. Such
approach was firstly proposed in (Oppenheim and
Schafer, 1968) and was refined afterwards with
the addition of pole-zero modelling (Kopec et al.,
1977). Recently, its use for the estimation of
vocal tract resonances has been reported (Rahman
and Shimamura, 2005).
The interest of the glottal source waveform for the
assessment of laryngeal pathologies comes from the
close expected relationship between laryngeal func-
tion and the glottal waveform itself. Some results on
this application have been reported, for instance, in
(de Oliveira-Rosa et al., 2000), (G´omez-Vilda et al.,
2007) and (G´omez-Vilda et al., 2008). However, the
application of glottal inverse filtering techniques to
pathological voices has a number of difficulties that
should not be disregarded. In the first place, patholog-
ical voices may not have a clear harmonic or quasi-
harmonic structure (see type 3 voice segments in
chap. 4 of (Sapienza and Hoffman-Ruddy, 2009)) and
some pathologies may prevent complete glottal clo-
sure (Sapienza and Hoffman-Ruddy, 2009)(chap. 5).
Therefore, the implementation of pitch-synchronous
approaches may be problematic in such cases. In the
second place, assumptions about the spectral enve-
lope of the glottal waveform (e.g. a 12 dB/oct decay
(Walker and Murphy, 2007)) that are inherent to some
approaches, for instance IAIF, may not be valid for
pathological voices. In addition, other not yet solved
issues of inverse filtering, no matter its application,
have to be considered too. One of the most remark-
able of such issues is the evaluation of the inverse fil-
tering algorithms themselves. Although a set of ob-
jective measures for this evaluation has been proposed
(Moore and Torres, 2008), these rely on the expected
characteristics of the glottal source waveform, not on
the measured characteristics, as the glottal source is
commonly unknown. One way to solve that problem
is the usage of synthetic voices for the assessment of
the algorithms (Walker and Murphy, 2007), but the
validity of this approach depends on the realism of
the used voice synthesisers.
In the previously described context, this article
reports on the evaluation of two inverse filtering ap-
proaches for pathological voice signal analysis. Due
to the above-mentioned potential characteristics of
pathological voices, pitch-asynchronous approaches
have been preferred. Among these, the performance
of IAIF (Alku, 1992) has been compared to that of
a variant of the homomorphic prediction (HoP) pro-
posed in (Kopec et al., 1977). The performance has
been evaluated using synthetic voice signals produced
with a physical voice model (Kob et al., 1999) (Kob,
2002a). The usage of synthetic voices has allowed
an objective and quantitative performance evaluation
that has been carried out both in temporal and spec-
tral domains. The rest of the paper is organised as fol-
lows: in section 2 a description of the voice simulator
and the voices produced with it is provided, section 3
contains a description of the analysed inverse filtering
algorithms, section 4 presents the results of applying
these algorithms to the synthetic voices and, last, sec-
tion 5 is dedicated to the conclusions.
2 SIMULATED VOICE SIGNALS
2.1 Simulation Model
The materials used for the herein reported experi-
ments have been synthetic voice signals generated
with the VOX simulator (Kob, 2002b). An overview
of the simulation model can be found in (Kob et al.,
1999) and a more thorough description in (Kob,
2002a). As far as this paper is affected, the simulation
model consists roughly of two blocks: glottis model
and vocal tract model. The glottis model is formed by
a set of vocalis-mucosa pairs connected among them
and with the larynx walls by means of springs of tun-
able stiffness. Within each pair, both the vocalis and
the mucosa are represented by one mass each, the mu-
cosa above the vocalis, and connected between them
also by a spring. For the work reported in this pa-
per, each vocal fold has been modelled by a series of
15 vocalis-mucosa pairs. Two types of glottis have
been simulated: a normal glottis with the vocal folds
having straight edges and uniform stiffness and mass
distribution and a glottis with one pair of nodules sim-
ulated by a localised concentration of mass and irreg-
ular vocal-fold edges. The specific form of the vo-
cal folds has been chosen so as to mimic the move-
BIOSIGNALS 2010 - International Conference on Bio-inspired Systems and Signal Processing
46
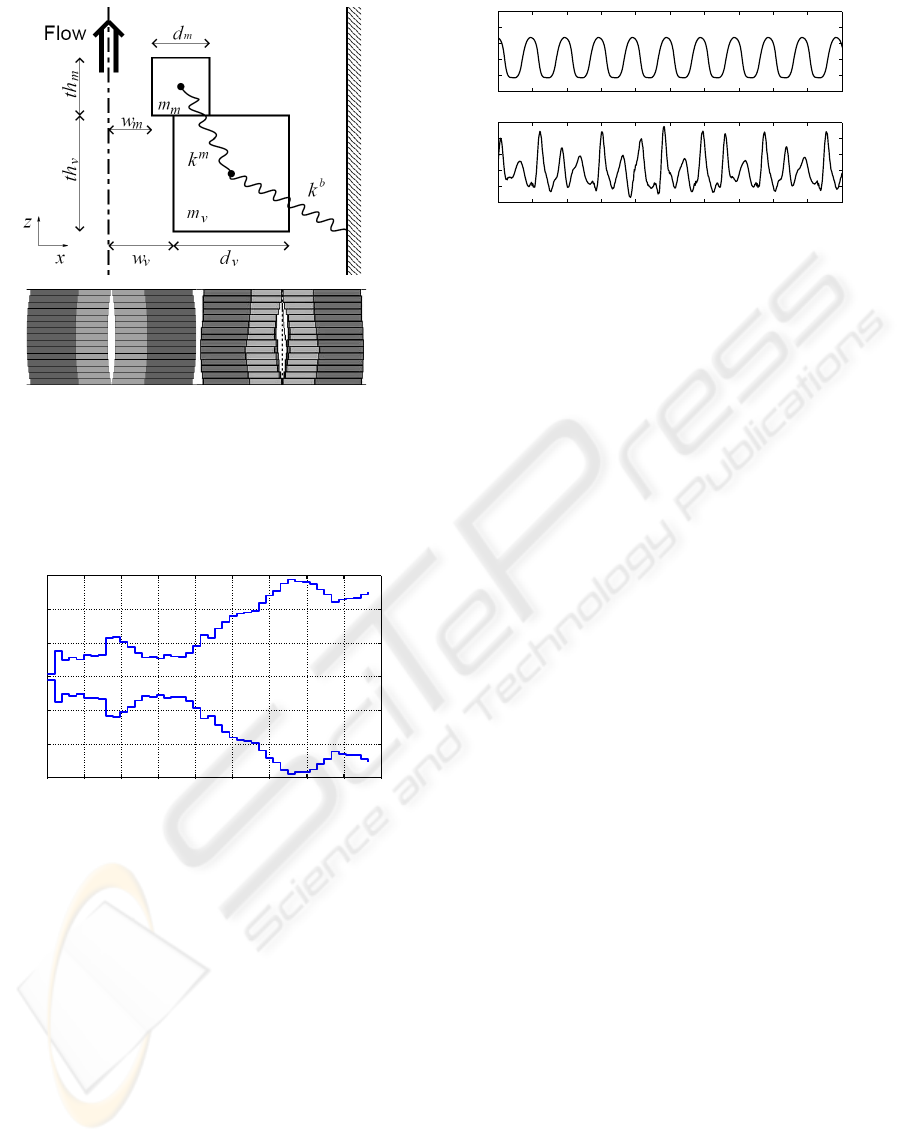
Figure 1: Schematic representation of the vocal fold model:
Up: Parameters of a single element composed by vocalis
mass, mucosa mass and springs.
Down: Arrangement in the horizontal plane of 30 of above-
described elements (15 at each side) to simulate the glot-
tis (normal glottis on the left and one with nodules on the
right).
0 0.02 0.04 0.06 0.08 0.1 0.12 0.14 0.16 0.18
−0.015
−0.01
−0.005
0
0.005
0.01
0.015
Distance to Vocal Folds (m)
Radius (m)
Figure 2: Schematic representation of the vocal tract model.
ment of one of the nodular glottis examples provided
in (Sapienza and Hoffman-Ruddy, 2009). As for the
rest of parameters, default values suggested in (Kob,
2002a) have been used. A schematic representation
of the glottis model is given in figure 1.
As for the vocal tract, among the possible mod-
elling approaches offered by VOX, the “stairs” model
has been chosen. This corresponds to the Kelly-
Lochbaum model. It considers the vocal tract as a se-
ries of 45 concatenated tubes with different diameters
and the pressure wave propagation along the inside of
such structure is simulated. The simulation approach
is similar to that of (Mathur et al., 2006). Figure 2 de-
picts one simulated configuration of the vocal tract.
Specifically, three different vocal tract shapes have
been simulated which intend to mimic the articulation
of the vowels /a/ (as in “hat”), /o/ (as in “toe”) and /u/
0 0.005 0.01 0.015 0.02 0.025 0.03 0.035 0.04 0.045 0.05
−2
−1
0
1
2
3
Normal voice
t (sec)
Normalised flow amplitude
0 0.005 0.01 0.015 0.02 0.025 0.03 0.035 0.04 0.045 0.05
−2
−1
0
1
2
3
Nodular voice
t (sec)
Normalised flow amplitude
Figure 3: Simulated normalised glottal flow for normal (up)
and nodular (down) voices.
(as in “foot”). These shapes have been obtained from
(Story and Titze, 1998).
Therefore, on the whole the experiments have
been realised with six signals which come from the
combination of the two glottis models with the three
vocal tract models. For this particular experiment, un-
coupled simulation of vocal folds and vocal tract has
been chosen. Indeed, this eases the task of inverse
filtering algorithms, since they are fed with signals
for which the simplified voice production model men-
tioned in section 1 is fully valid, which is not the case
of real voices. However, the choice is justified be-
cause such a model has proven to be valid for a wide
variety of applications and the purpose of the herein
reported work is to provide a comparative analysis of
algorithms and not absolute performance measures.
2.2 Characteristics of Simulated Glottal
Signals
Figure 3 shows part of the simulated glottal flow sig-
nals for normal and nodular voices. In both plots,
the signals have been normalised to be zero-averaged
and with mean square value equal to one (µ
x
g
= 0,
σ
x
g
= 1). The sampling frequency of both signals is
f
s
= 17640 Hz. While both signals have a fundamen-
tal frequency of 206 Hz –see the modulus of the cor-
responding Discrete Fourier Transforms (DFT) plot-
ted in figure 4–, the normal voice presents a smooth
glottal cycle, while the nodular voice has an irregular
glottal cycle with oscillations shorter that one cycle.
These correspond to a disjoint oscillation of the an-
terior and posterior parts of the glottis, with the nod-
ules being the limit between those parts. In spectral
domain, this is reflected by a non-harmonic structure
(peaks are not repeated at regular frequency intervals)
with spectral peaks higher than that corresponding to
the fundamental frequency (figure 4, down).
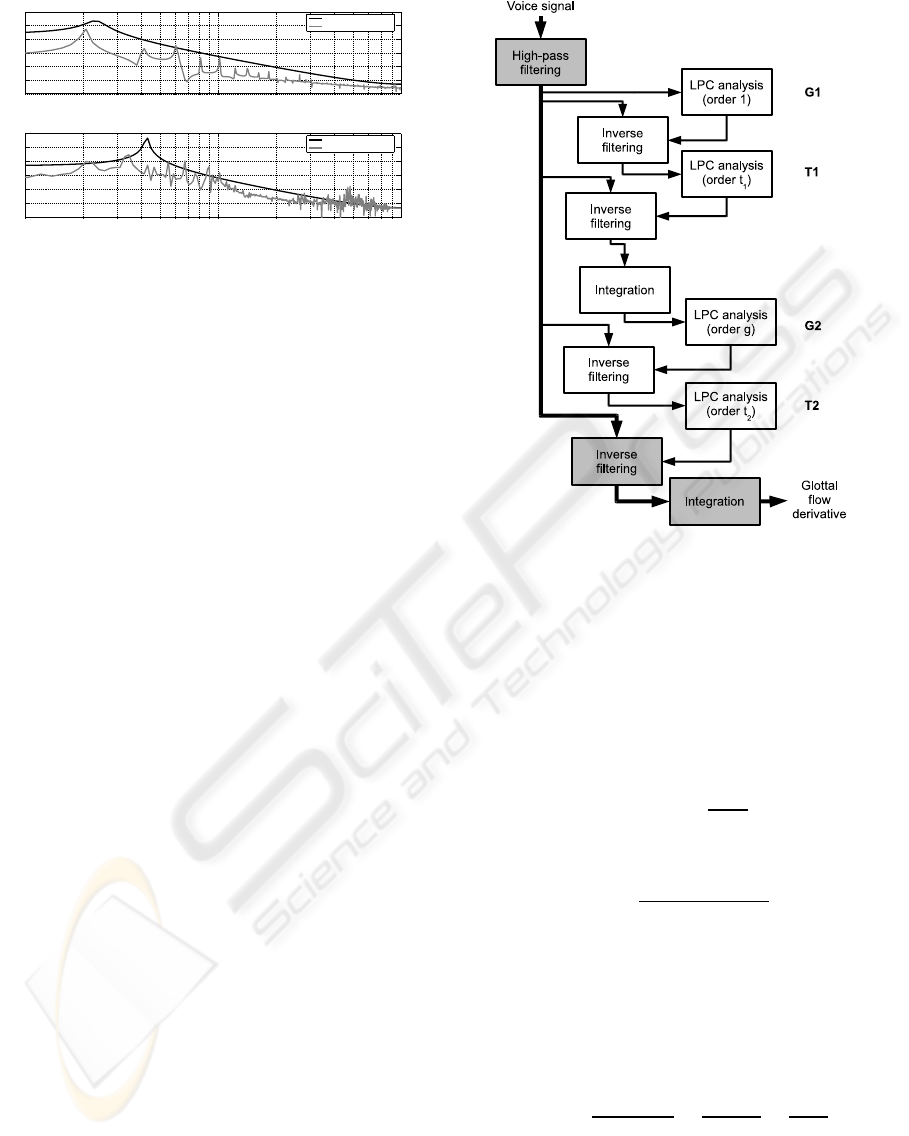
In figure 4, the spectrum of a linear prediction
(LP) model fitted to the glottal signals has also been
depicted. The spectrum of the glottal flow is typically
PITCH-ASYNCHRONOUS GLOTTAL INVERSE FILTERING OF NORMAL AND PATHOLOGICAL VOICES
BASED ON HOMOMORPHIC PREDICTION
47
10
2
10
3
−15
0
15
30
45
60
75
Normal voice
f (Hz)
dB
Fitted 2−order LP model
Simulated glottal flow
10
2
10
3
−15
0
15
30
45
60
75
Nodular voice
f (Hz)
dB
Fitted 2−order LP model
Simulated glottal flow
Figure 4: DFT of the simulated normalised glottal flow for
normal (up) and nodular (down) voices. In both cases, the
spectrum of an fitted 2-pole LP model has been plotted.
assumed to have an envelope with a 12 dB/dec de-
cay, which can be modelled with a 2-pole LP model
(Walker and Murphy, 2007). In fact, a 2-to-4 pole
LP model for the glottal flow is proposed in (Alku,
1992) and a similar number of poles (1 to 3) is sug-
gested in (G´omez-Vilda et al., 2008). The discrete
all-pole modelling (DAP) algorithm (El-Jaroudi and
Makhoul, 1991) has been used for the fitting of the LP
model. For the normal voice in figure 4 the LP model
approximately corresponds to the simulated signal as
for the placement of the highest spectral peak and the
smooth decay of the spectral envelope above 1 kHz.
In contrast the slope of the decay does not coincide.
However, in the case of the nodular signal, the decay
slope of both the model and the signal is roughly sim-
ilar, but the highest peak of the spectral envelope is
clearly different and the behaviour of the signal for
high frequencies (above 3 kHz) does not match the
model. These divergencies between the signals and
the all-pole LP models pose the interest of using in-
verse filtering algorithms that make as less previous
assumptions as possible regarding the spectral enve-
lope of the vocal tract.
3 INVERSE FILTERING
ALGORITHMS
3.1 Iterative Adaptive Inverse Filtering
(IAIF)
As mentioned in section 1, the IAIF algorithm (Alku,
1992) is a pitch-asynchronous scheme that has be-
come prototypical for adaptive approaches to inverse
filtering. The flow diagram of the IAIF algorithm is
represented in figure 5. Within this algorithm, the
voice signal is processed by three blocks:
1. A high-pass filter with cut-off frequency near
Figure 5: Flow diagram of the IAIF algorithm.
30 Hz that removes slow variations of the glottal
flow.
2. A FIR filter that removes the effect of the vo-
cal tract out of the voice signal. This block is
called inverse filtering because is response H
IF
(z)
is sought to be the inverse of the vocal tract re-
sponse:
H
IF
(z) =
1
V (z)
. (1)
Since V (z) corresponds an all-pole LP model:
V (z) =
1
1+
∑
t
j=1
a
j
· z
− j
⇒ (2)
⇒ H
IF
(z) = 1+
t
∑
j=1
a
j
· z
− j
.
3. An integrator whose response H
i
(z) compensates
for the radiation effect of the lips. Such radiation
effect is, approximately, a differentiation, thus:
H
i
(z) =
1
1− ρ· z
−1
≈
1
1− z
−1
=
1
R(z)
. (3)
where ρ is a positive real number close to 1 but
lower, so as to ensure filter stability.
The purpose of the white blocks in figure 5 is to
provide a good estimate for V (z). For this purpose,
BIOSIGNALS 2010 - International Conference on Bio-inspired Systems and Signal Processing
48

a two-step procedure is repeated twice. In the first
pass, a single-pole LP model is assumed for the glottal
waveform G(z) (G1) and, based on this assumption a
t
1
-pole LP model is fitted (LPC analysis) to the result
of inverse-filtering the voice signal with that glottal
model (T1). Such t
1
-pole LP model is a first estimate
of V (z) which is used to produce a refined 2-to-4 pole
LP model of G(z) (G2). This allows, again, an im-
proved estimation of V (z) using a LP model with t
2
poles (T2). The LPC analysis is done with the DAP
algorithm (El-Jaroudi and Makhoul, 1991), which has
shown to provide better model estimates than clas-
sical autocorrelation methods. A free implementa-
tion of the IAIF algorithm can be found in (Arias and
B¨ackstr¨om, 2008).
3.2 Homomorphic Prediction (HoP)
An alternative, pitch-asynchronous approach for in-
verse filtering is that of homomorphic (or cepstral)
analysis. This was first proposed in (Oppenheim and
Schafer, 1968) and it is based on two ideas:
• The introduction of a logarithm operation allows
to transform the convolution operation in a sum.
That is, in the speech production model could be
expressed in “log-z” domain as:
logS(z) = logG(z) + logV (z) + logR(z) (4)
• The vocal tract affects the spectral envelope of
voice, while the glottal source is responsible for
the fine quasi-harmonic structure; therefore, the
inverse transform of (4) should result in a signal
in which G(z) and V (z) are highly separable.
A combination of these two ideas with the LP
modelling approach was introduced in (Kopec et al.,
1977) under the name of homomorphic prediction
(HoP). This combination consisted in calculating the
real cepstrum of the voice signal:
e
S[q] = F
−1
log
S
e
jω
=
e
G[q] +
e
V [q] +
e
R[q] ,
(5)
eliminating the part fo the cepstrum corresponding to
the harmonic structure of the voice signal by short-
pass liftering:
e
S
SP
[q] =
e
S[q] if q < q
th
0 if q ≥ q
th
(6)
and fitting an all-pole LP model to the remaining
minimum-phase signal that can be recovered as:
V (z)|
z=e
jω
≈ e
F
{
e
S
SP
[q]
}
. (7)
The Fourier transform F and its inverse F
−1
can
be implemented with the DFT if a sufficient num-
ber of zeroes is appended to the original voice signal
(Childers et al., 1977). A very similar approach has
more recently been used in (Rahman and Shimamura,
2005) to estimate the resonances of the vocal tract for
high-pitched voices.
While such an approach for separating the effects
of glottis and vocal tract has been applied to the iden-
tification of the vocal tract response, both in (Kopec
et al., 1977) and (Rahman and Shimamura, 2005), it
has not been tested yet for glottal-source recovery. In
fact, the liftering operation in (6) separates between
spectral envelope and harmonic structure, provided
that q
th
is chosen to be less but close to the funda-
mental period of the signal. However, it does not dif-
ferentiate between the component of the spectral en-
velope of the signal due to the vocal tract and that
due to the glottal waveform itself. The glottal wave-
form is expected to provide a smooth decay of the
spectral envelope (as illustrated in figure 4), while the
vocal tract is expected to produce peaks associated to
its resonant frequencies. Therefore, in the cepstrum,
the lowest values of q in (5) should be associated to
the glottal waveform and the highest values below the
fundamental period should be associated to the effect
of the vocal tract.
Thus, the following algorithm, based in HoP, is
proposed for inverse filtering:
1. Apply an integrating filter (3) to the voice sig-
nal so as to compensate for the lip radiation
R(z). This produces a radiation-compensated sig-
nal S
R
(z).
2. Calculate the cepstrum of S
R
(z) as in (5):
e
S
R
[q] = F
−1
log
S
R
e
jω
≈
e
G[q] +
e
V [q] .
(8)
3. Choose and appropriate value of q
th
to perform
long-pass liftering:
e
S
LP
R
[q] =
0 if q ≤ q
th
e
S[q] if q > q
th
. (9)
4. Recover the minimum-phase signal:
S
LP
R
(z)
z=e
jω
= e
F
{
e
S
LP
R
[q]
}
. (10)
5. Fit a discrete all-pole LP model to S
LP
R
(z). Such a
model should is an estimate of V (z).
6. Use the estimate of V (z) to perform inverse filter-
ing on S
R
(z), hence obtaining an estimate of the
glottal flow derivative G(z).
4 RESULTS
The two inverse filtering algorithms described in sec-
tion 3, namely IAIF and HoP, have been applied to
PITCH-ASYNCHRONOUS GLOTTAL INVERSE FILTERING OF NORMAL AND PATHOLOGICAL VOICES
BASED ON HOMOMORPHIC PREDICTION
49
1000 2000 3000 4000 5000 6000 7000 8000
−40
−30
−20
−10
0
10
20
30
40
50
f (Hz)
dB
Vocal tract and estimates for normal voice
Simulated vocal tract
HoP vocal tract estimate
IAIF vocal tract estimate
1000 2000 3000 4000 5000 6000 7000 8000
−30
−20
−10
0
10
20
30
40
f (Hz)
dB
Vocal tract and estimates for nodular voice
Simulated vocal tract
HoP vocal tract estimate
IAIF vocal tract estimate
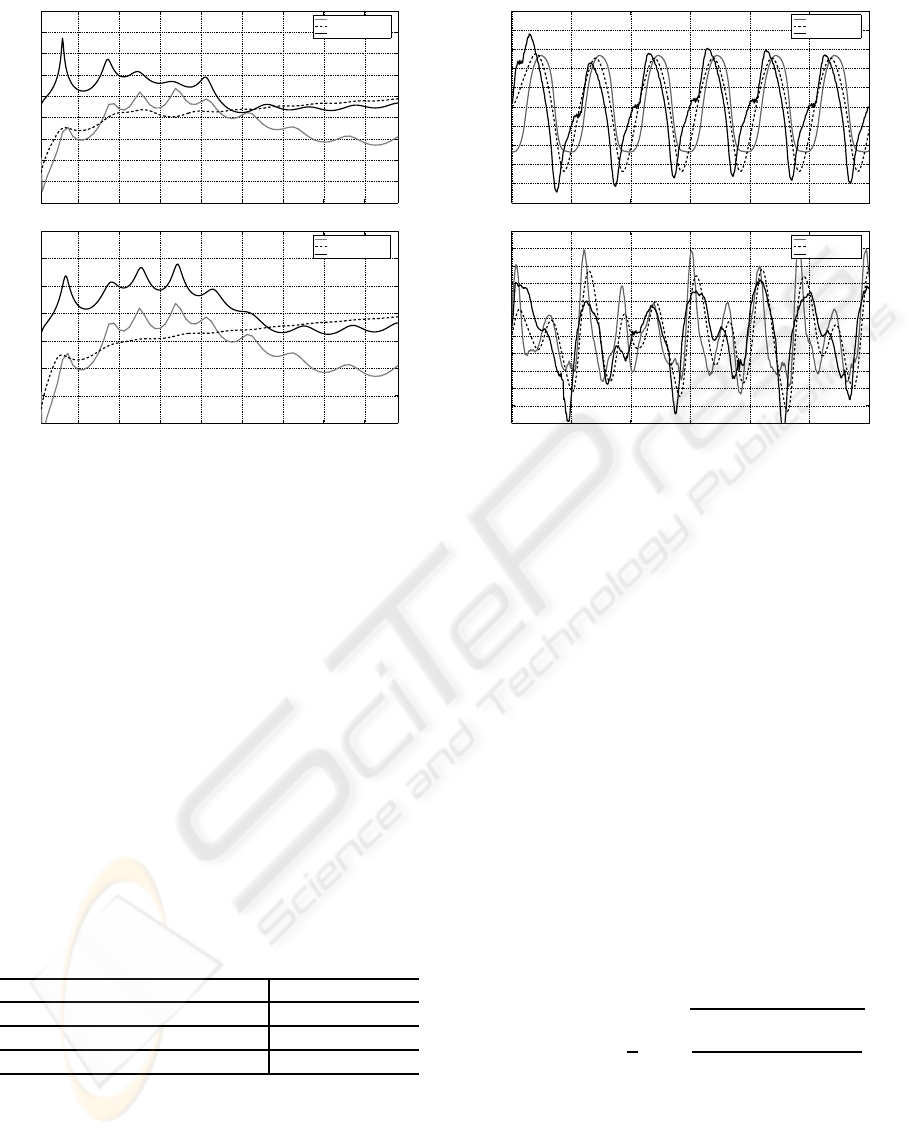
Figure 6: Simulated and estimated vocal tract frequency re-
sponses for normal (up) and nodular (down) voices.
the six synthetic voice signals mentioned in section
2. In all six cases, signal interval with lengths equal
to 717 ms have been chosen, skipping the initial tran-
sient phase of the simulation. The outputs of both
IAIF and HoP have undergone an additional integra-
tion to obtain the normalised glottal flow from its
derivative. Such integration has been performed with
filter H
i
(z) in (3). The values for the rest of the sim-
ulation parameters are summarised in table 1. The
value of ρ has been tuned manually between 0.9 and
0.99, values of t and g are as recommended in (Alku,
1992) and (G´omez-Vilda et al., 2008) and the value
of q
th
has been chosen considering the widest vocal
tract formant bandwidths (around 300 Hz) reported in
(Akande and Murphy, 2005). As for the input signals,
all of them have been normalized to have zero mean
and unit standard deviation.
Table 1: Values for simulation parameters.
ρ 0.92
Vocal-tract model order t ⌈ f
s
(kHz)⌉ = 18
Glottal model order g (IAIF) 2
Liftering thres. q
th
(HoP) ⌈ f
s
/300⌉ = 59
Figure 6 show the amplitude of the frequency
response of the simulated vocal tract corresponding
to the vowel /a/ and its estimates provided by the
IAIF and HoP algorithms for both normal and nodu-
lar voices. Qualitatively, it can be noticed that while
the IAIF algorithm allows a better identification of the
resonant frequencies of the vocal tract, the HoP pro-
0 0.005 0.01 0.015 0.02 0.025 0.03
−2.5
−2
−1.5
−1
−0.5
0
0.5
1
1.5
2
2.5
t(s)
Normalised glottal flow estimates for normal voice
Simulated glottal flow
HoP estimate
IAIF estimate
0 0.005 0.01 0.015 0.02 0.025 0.03
−2.5
−2
−1.5
−1
−0.5
0
0.5
1
1.5
2
2.5
3
t(s)
Normalised glottal flow estimates for nodular voice
Simulated glottal flow
HoP estimate
IAIF estimate
Figure 7: Simulated and estimated glottal flows for normal
(up) and nodular (down) voices.
vides a better fit to its locally averaged shape. This is
specially true for frequencies below 2000 Hz.
The simulated and estimated glottal flows for 30
ms segments of the signals corresponding to the vo-
cal tract /o/ are plot in figure 7. Qualitatively, both
for normal and nodular voices, HoP tends to provide
a better fit to the original signal than IAIF. In order to
provide a quantitative comparison of the performance
of both approaches, the available signals have been
randomly split in segments with durations uniformly
distributed between 70ms and 210ms. For each seg-
ment, both the IAIF and HoP algorithms have been
applied to produce glottal flow estimates ˆg
j
[n], where
i = 1.. . J stands for the processed voice segment. Af-
terwards, such estimates have also been normalized
and time aligned with the corresponding simulated
glottal flows g
j
[n]. The experiment has been repeated
60 times with each signal with differentstarting points
for the voice segments and an average signal-to-error
measure has then been computed as follows:
SER = −20· log
1
J
J
∑
j=1
v
u
u
u
t
E
n
( ˆg
j
[n] − g
j
[n])
2
o
E
n
g
2
j
[n]
o
,
(11)
where E{·} means time averaging and J is the total
number of segments along the 60 iterations. The ob-
tained values of SER for the six test signals are com-
piled in table 2. The performance of HoP for this par-
ticular set-up and the used test signals is significantly
better than that of IAIF for the normal voices and it is
BIOSIGNALS 2010 - International Conference on Bio-inspired Systems and Signal Processing
50
roughly similar for the pathological voices.
Table 2: Values in dB of the SER, as defined in (11).
Vocal tract model /a/ /o/ /u/
Normal Voice
HoP 13.09 11.97 12.29
IAIF 10.69 7.40 9.29
Nodular Voice
HoP 1.25 5.44 5.44
IAIF 2.37 4.37 3.72
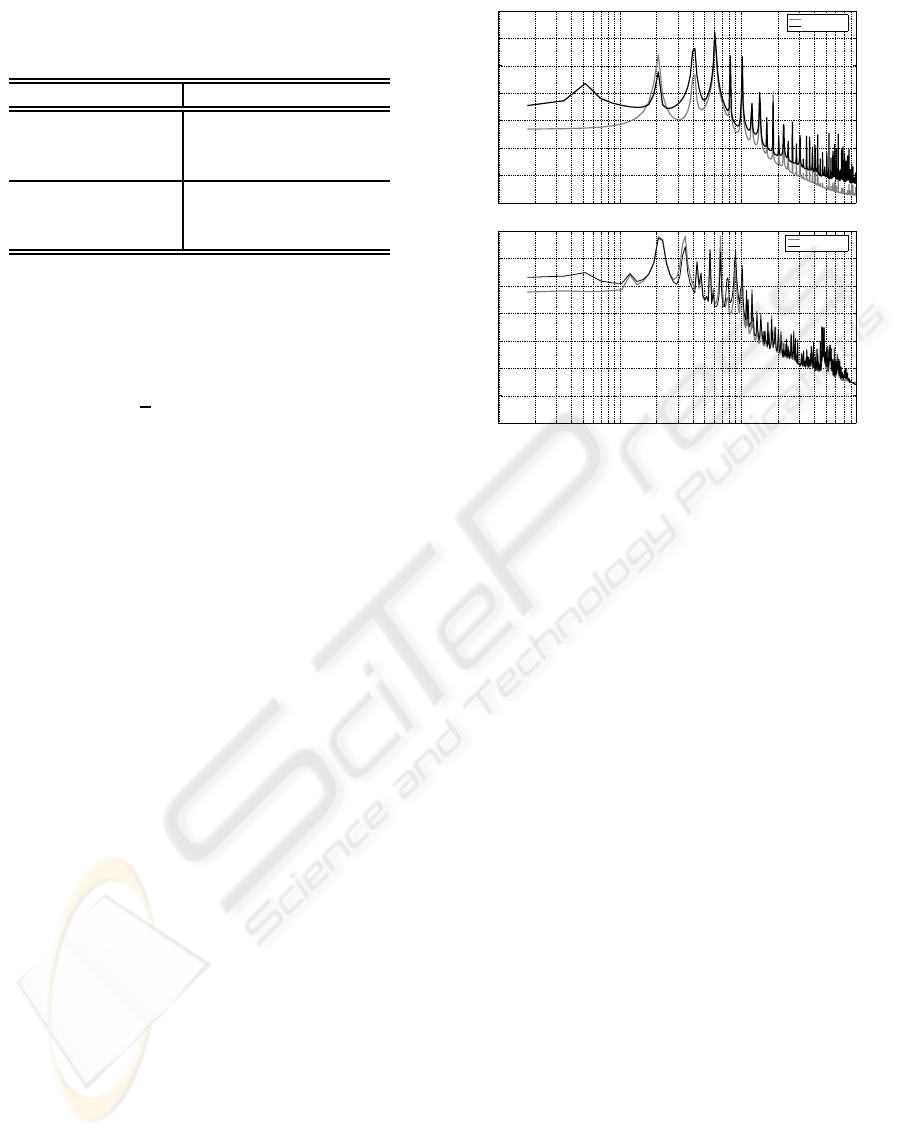
An insight into the reasons for the reported results
can be fund by analysing the spectral behaviour of the
glottal waveform estimation error. Specifically, figure
8 shows the plot of:
E (ω) = 20· log
"
1
J
J
∑
j=1
ˆ
G
j
e
jω
− G
j
e
jω
#
(12)
for both normal and nodular voices and for the vo-
cal tract /a/, for which HoP has the worst compara-
tive performance. For normal voice, the HoP estima-
tion error is lower than that of IAIF for all frequen-
cies except for an interval around the first harmonic,
which is very close to the peak provided by the 2-
pole LP model of the glottal signal (recall figure 3).
It should be remembered that the 2-pole LP model
in this case was not able to match the decay of the
spectral envelope of the signal, hence the wide inter-
val over which HoP provides a better estimate of the
glottal flow. In contrast, the fit between the decay of
the 2-pole LP model and the signal was much better
for the simulated pathological signal (recall figure 3,
again). This results in a better performance of IAIF
except around the position of the spectral peak of the
2-pole model (500 to 1100 Hz) and for very low fre-
quencies (less than 200 Hz). Therefore, the compar-
ative performance of HoP versus IAIF seems to be
directly affected by the goodness of the fit between
the spectral envelope of the glottal flow and the all-
pole LP model used to model that flow. In this case,
a good fit, as is the case for the nodular voice, results
in a similar performance of IAIF and HoP, while a
divergence results in HoP outperforming IAIF.
5 CONCLUSIONS
Within this paper, the applicability of homomorphic
prediction to inverse filtering has been analysed. This
approach, while it has not been favoured much by re-
searchers during the last years was firstly proposed
in (Kopec et al., 1977) for the estimation of the res-
onance structure of the vocal tract. Herein, it has
10
1
10
2
10
3
−20
−10
0
10
20
30
40
50
frec(Hz)
dB
Average spectral estimation error for normal voice
HoP normal voice
IAIF normal voice
10
1
10
2
10
3
−20
−10
0
10
20
30
40
50
frec(Hz)
dB
Average spectral estimation error for nodular voice
HoP nodular voice
IAIF nodular voice
Figure 8: Estimation error in spectral domain for normal
(up) and nodular (down) voices.
been shown that a modification of such an algorithm
by using long-pass liftering in cepstral domain in-
stead of short-pass liftering provides an alternative
method for the identification of the glottal source in
voice signals. This method shares with iterative adap-
tive inverse filtering its capability for working pitch-
asynchronously, which is a relevant issue for the pro-
cessing of pathological voices. Moreover, though
not directly studied in this paper, previously reported
analysis indicate that HoP may outperform IAIF for
high-pitched voices (Rahman and Shimamura, 2005)
(Walker and Murphy, 2007) in pitch-asynchronous
schemes.
The performance of both HoP and IAIF has been
analysed quantitatively by using synthetic voice sig-
nals provided by a biomechanical simulator of voice
production. The reported results show that both algo-
rithms provide a similar performance when the glot-
tal signal suits well the all-pole LP model assumed in
IAIF, while HoP gives better figures when this does
not happen. Therefore, it can be concluded that HoP
provides a scheme for inverse filtering that is ade-
quate for pathological voices since it works pitch-
asynchronously and that is more robust against vari-
ability in the spectral envelope of the glottal signal,
since it does not impose assumptions related to its
spectral decay.
PITCH-ASYNCHRONOUS GLOTTAL INVERSE FILTERING OF NORMAL AND PATHOLOGICAL VOICES
BASED ON HOMOMORPHIC PREDICTION
51

ACKNOWLEDGEMENTS
This research was carried out within a project funded
by the Ministry of Science and Technology of
Spain (TEC2006-12887-C02) and within the “Jos´e
Castillejo” program for the mobility of researchers.
The work has also been done in the context of Euro-
pean COST action 2103.
REFERENCES
Akande, O. O. and Murphy, P. J. (2005). Estimation of the
vocal tract transfer function with application to glottal
wave analysis. Speech Communication, 46(1):15 – 36.
Alku, P. (1992). An automatic method to estimate the time-
based parameters of the glottal pulseform. In IEEE In-
ternational Conference on Acoustics, Speech and Sig-
nal Processing, volume 2, pages 29–32.
Arias, M. and B¨ackstr¨om, T. (2008). TKK aparat.
http://aparat.sourceforge.net (visited May 2009).
Childers, D., Skinner, D., and Kemerait, R. (1977). The
cepstrum: A guide to processing. Proceedings of the
IEEE, 65(10):1428–1443.
de Oliveira-Rosa, M., Pereira, J., and Grellet, M. (2000).
Adaptive estimation of residue signal for voice pathol-
ogy diagnosis. IEEE Transactions on Biomedical En-
gineering, 47(1):96–104.
El-Jaroudi, A. and Makhoul, J. (1991). Discrete all-pole
modeling. IEEE Transactions on Signal Processing,
39(2):411–423.
Fu, Q. and Murphy, P. (2006). Robust glottal source estima-
tion based on joint source-filter model optimization.
IEEE Transactions on Audio, Speech and Language
Processing, 14(2):492–501.
G´omez-Vilda, P., Fern´andez-Baillo, R., Nieto, A., D´ıaz, F.,
Fern´andez-Camacho, F. J., Rodellar, V.,
´
Alvarez, A.,
and Mart´ınez, R. (2007). Evaluation of voice pathol-
ogy based on the estimation of vocal fold biomechan-
ical parameters. Journal of Voice, 21(4):450 – 476.
G´omez-Vilda, P., Fern´andez-Baillo, R., Rodellar-Biarge,
V., Nieto-Lluis, V.,
´
Alvarez-Marquina, A., Mazaira-
Fern´andez, L. M., Mart´ınez-Olalla, R., and Godino-
Llorente, J. I. (2008). Glottal source biometrical sig-
nature for voice pathology detection. Speech Commu-
nication, In Press.
Kob, M. (2002a). Physical Modeling of the Singing Voice.
PhD thesis, Fakul¨at f¨ur Elektrotechnik und Informa-
tionstechnik - RWTH Aachen. Logos-Verlag.
Kob, M. (2002b). Vox - a time-domain model for
the singing voice. http://www.akustik.rwth-
aachen.de/˜malte/vox/index.html.en (visited May
2009). Computer software.
Kob, M., Alhuser, N., and Reiter, U. (1999). Time-domain
model of the singing voice. In Proceedings of the 2
nd
COST G-6 Workshop on Digital Audio Effects, Trod-
heim (Norway).
Kopec, G., Oppenheim, A., and Tribolet, J. (1977). Speech
analysis homomorphic prediction. IEEE Transac-
tions on Acoustics, Speech and Signal Processing,
25(1):40–49.
Mathur, S., Story, B. H., and Rodriguez, J. J. (2006).
Vocal-tract modeling: fractional elongation of seg-
ment lengths in a waveguide model with half-sample
delays. IEEE Transactions on Audio Speech and Lan-
guage Processing, 14(5):1754–1762.
Moore, E. and Torres, J. (2008). A performance assess-
ment of objective measures for evaluating the quality
of glottal waveform estimates. Speech Communica-
tion, 50(1):56–66.
Oppenheim, A. and Schafer, R. W. (1968). Homomorphic
analysis of speech. IEEE Transactions on Audio and
Electroacoustics, 16(2):221–226.
Rabiner, L. R. and Schafer, R. W. (1978). Digital processing
of speech signals. Prentice-Hall.
Rahman, M. S. and Shimamura, T. (2005). Formant fre-
quency estimation of high-pitched speech by homo-
morphic prediction. Acoustical science and technol-
ogy, 26(6):502–510.
Sapienza, C. and Hoffman-Ruddy, B. (2009). Voice Disor-
ders. Plural Publishing.
Story, B. H. and Titze, I. R. (1998). Parameterization
of vocal tract area functions by empirical orthogonal
modes. Journal of Phonetics, 26(3):223–260.
Walker, J. and Murphy, P. (2007). A review of glottal
waveform analysis. In Stylianou, Y., Faundez-Zanuy,
M., and Esposito, A., editors, Progress in Nonlin-
ear Speech Processing, volume 4391/2007 of Lecture
Notes in Computer Science, pages 1–21. Springer-
Verlag.
Wong, D., Markel, J., and Jr., A. G. (1979). Least squares
glottal inverse filtering from the acoustic speech wave-
form. IEEE Transactions Acoustics, Speech and Sig-
nal Processing, 27(4):350–355.
BIOSIGNALS 2010 - International Conference on Bio-inspired Systems and Signal Processing
52
