
RESPIRATORY INFORMATION IN ARTERIAL OXYGEN
SATURATION MEASUREMENT
Yue-Der Lin
Department of Automatic Control Engineering
Master Program of Biomedical Informatics and Biomedical Engineering
Feng Chia University, 100 Wenhwa Road, Seatwen, Taichung 406, Taiwan
Keywords: Pulse oximeter, Photoplethysmography (PPG), Arterial oxygen saturation (SpO
2
), Multi-channel
autoregressive (AR) spectral estimation, Coherence analysis.
Abstract: Pulse oximeter has become a standard in intensive and critical care units for the monitoring of oxygen
support from respiratory system since 1990’s. The multi-wavelength photoplethysmography (PPG)
technique is now utilized for the measurement of arterial oxygen saturation by pulse oximeter (SpO
2
). This
research utilized multi-channel autoregressive (AR) spectral estimation method for the coherence analysis
between the respiratory signal and the PPG signal derived from pulse oximeter. Five healthy male subjects
participated in this research with signals being measured at different respiratory status. The results
demonstrate high coherence between respiration and the PPG signal from pulse oximeter, and the coherence
disappears in breath-holding experiments. The results demonstrate that the respiratory status can also be
acquired from the measurement of arterial oxygen saturation. This implies the possibility to acquire the
physiological parameters other than arterial oxygen saturation form pulse oximeters.
1 INTRODUCTION
Pulse oximetry is a non-invasive method widely
used in clinical environments for the analysis of
oxygen delivery. Two-wavelength (660 nm and 940
nm) photoplethysmography (PPG) technology is
utilized for the measurement of arterial oxygen
saturation (SpO
2
) in most commercial pulse
oximeters (Webster, 1997). In addition to the
reading of arterial oxygen saturation, pulse
oximeters also provide PPG signal (940-nm wave-
length in general) for pulse rate or heart rate
monitoring.
PPG signal represents the volumetric changes in
blood vessels. Such blood volume change occurs
mainly in the arteries and arterioles. The principle of
PPG is that the light (mainly red, infrared or green
light) traveling through biological tissue (e.g. the
fingertip or earlobe) will be absorbed by different
absorbing substances, including skin pigmentation,
bone, and arterial and venous blood. The arteries
contain more blood during systole than during
diastole, and their diameter increases due to the
increased blood pressure. The detected light
reflected from or transmitted through the vessels will
thus fluctuate according to the pulsatile blood flow
during the circulation. Therefore, the PPG signals
are composed of two components, the alternating
part of total absorbance due to the pulsatile
component of the arterial blood (AC component)
and the absorbance due to venous blood, the part of
the constant amount of arterial blood, and other non-
pulsatile components such as skin pigmentation (DC
component) (Hertzman and Spielman, 1937).
As the AC component of PPG signal is
synchronous with the heart beat and thus can be
identified as a source of heart rate information. In
addition, the PPG signal is claimed to contain
respiratory-induced intensity variations (RIIV)
(Johansson et al., 1999; Nilsson et al., 2000). The
so-called RIIV is a kind of modulation arises from
the respiratory-induced variations in venous return
to the heart. Such variation is primarily caused by
the alterations in intrathoracic pressure during
respiration. A part of the respiratory-related drift in
perfusion also originates from the autonomous
control of the peripheral vessels and is also
synchronous with respiration. RIIV signal can be
extracted from PPG by a bandpass filter (0.13-0.48
Hz). High coherence has been shown to exist
168
Lin Y. (2010).
RESPIRATORY INFORMATION IN ARTERIAL OXYGEN SATURATION MEASUREMENT.
In Proceedings of the Third International Conference on Bio-inspired Systems and Signal Processing, pages 168-173
DOI: 10.5220/0002693501680173
Copyright
c
SciTePress

between RIIV and the changes in tidal volume and
respiratory rate (Johhansson et al., 1999a and 1999b;
Nilsson et al., 2003). As some commercial pulse
oximeters also provide PPG signal, these results
imply that the pulse oximeters can be a potential tool
for the acquisition of arterial oxygen saturation,
heart rate and respiration at the same time.
The relationship between RIIV and respiratory
signal has been examined extensively in the past
decades (Johhansson et al., 1999a and 1999b;
Nilsson et al., 2003). However, little research has
been done concerning the coherence between the
raw PPG signal acquired from pulse oximeter and
respiratory signal. As the RIIV may deviate with the
varying respiratory rate, the fixed bandpass filter for
PPG signal filtration may limit the accuracy of
analysis in practical conditions, especially in slow
and fast breathing cases. The objective of the present
study was to investigate whether such coherence
exists between raw PPG signal and respiratory signal.
The multi-channel autoregressive (AR) spectral
estimation method proposed by Morf et al. (1978),
was utilized for the coherence analysis under
different breathing rates and the breath-holding state
for five healthy male subjects. The two-channel AR-
based cross-spectral analysis demonstrated that raw
PPG signal and respiration were coherent
(magnitude-squared coherence greater than 0.5) at
the respiratory frequency in the subjects studied,
with changes in respiration leading to changes in
PPG. No coherence was found in breath-holding
cases for the subjects participated. The results of this
research verify that there exists the corresponding
respiratory component in spectrum of raw PPG
signal. The results may provide another attractive
approach to acquire the respiratory information from
PPG without the need of filtering. The results also
imply the possibility to acquire the physiological
parameters other than arterial oxygen saturation
form pulse oximeters.
2 METHODS AND MATERIALS
2.1 Subjects and Experiments
Five healthy male subjects (non-smoker and with no
prior history of cardiovascular disease) aged
between 22 and 24 took part in the experiments after
giving the informed consent. All subjects were asked
to refrain from caffeine and alcoholic drink at least 4
hours before the experiments. All of the experiments
were performed at the same university laboratory
with the room temperature being maintained at about
25 degrees centigrade during the night time (from 9
to 11 pm). The subjects were required of having a
resting period of at least 5 minutes under relaxation
status before the experiment.
0 5 10 15 20 25 30
-0.15
-0.1
-0.05
0
0.05
0.1
Respiration
Time (second)
0 5 10 15 20 25 30
0
0.5
1
1.5
2
2.5
3
3.5
Time (second)
PPG from Pulse Oximeter
Figure 1: Typical signals acquired. Upper: respiratory
signal (natural respiration); lower: PPG signal derived
form pulse oximeter.
Each experiment included two stages classified
by different respiratory rate (natural respiration and
holding the breath in order). Each stage was
maintained at least one minute, and the intervals
between stages were three minutes. Throughout the
experiment, the subjects were seated in a
comfortable chair with their right upper arm kept at
the height of heart level.
2.2 Signal Measurement
The physiological data acquisition system MP150
®
(Biopac Inc.) was utilized for signal measurement.
Pulse oximetry signal (by pulse oximeter module
OXY100C) and respiratory signal (by temperature
amplifier module SKT100C with fast response
thermistor sensor TSD202A) were collected
simultaneously during each experimental stage. The
Pulse oximetry probe (TSD123A, with infrared
wavelength 910 nm) was attached to the right index
finger, whereas the respiratory signal was acquired
at the nostril during the measurement. The analysis
package Biopac AcqKnowledge
®
(version 3.9.1)
was used for signal management, including the
signal quality pre-screening, data storage and
retrieval. The signals were verified visually by a
well-trained technician. A typical respiratory signal
and PPG signal acquired form pulse oximeter are
shown in Figure 1. If the signal quality was poor, the
signal would be excluded from further analysis and
the subject was asked to repeat the experiment once
again.
As the dominant components of the processed
signals primarily locate around the frequencies
below 6 Hz, a sampling frequency of 60 Hz is
RESPIRATORY INFORMATION IN ARTERIAL OXYGEN SATURATION MEASUREMENT
169

enough. However, the ECG (electrocardiogram)
measurement is sometime needed in the experiments
for timing reference. A sampling frequency of 250
Hz was selected in this research to assure all the
signals could be acquired without aliasing. Before
the signal analysis, both respiration and PPG signal
were down-sampled by a factor of 4.
2.3 Signal Analysis
The source code for multi-channel AR spectral
estimation was developed in MATLAB
®
version
7.3.0 (MathWorks Inc.). The estimation method was
originally developed by Morf et al. (1978). It is an
expansion of single-channel Levinson recursion
algorithm (Levinson, 1947). Two-channel case is
introduced as below. The same procedure can be
easily expanded to the cases which are more than
two channels.
Let x[n] denote the vector of samples from two-
channel process at sample index n
H
nxnxn ]][ ][[][
21
=x
, (1)
where the superscript
H
represent the transpose
operation. In this research, x
1
[⋅] and x
2
[⋅] represent
the acquired respiratory signal and the PPG signal
from pulse oximeter respectively. The two-channel
AR(p) model, assumed to be wide-sense stationary,
can be represented as
∑
=
+−−=
p
k
f
pp
nknkn
1
][][)(][ exAx , (2)
in which the A
p
(k) are the 2×2 AR(p) forward
prediction parameter matrices and
][n
f
p
e is a 2×1
vector representing the forward linear prediction
error or the AR(p) driving noise process. With the
property that the driving noise process is
uncorrelated with past values of the AR process, the
multichannel Yule-Walker normal equations of
forward linear prediction version can be derived as
] [ 00PRa "
f
ppp
= , (3)
with
)]( )1( [ p
ppp
AAIa "= , (4)
]}[][{ nnE
H
ppp
xxR = , (5)
and
H
p
pnnnn ]][ ]1[ ][[][ −−= xxxx " . (6)
In the above equations, 0 are 2×2 null matrices and I
denotes a 2×2 identity matrix. The symbol E
represents the expectation operator, and
]}[][{ nnE
H
f
p
f
p
f
p
eeP = is the covariance matrix of
the driving noise process for the forward AR(p)
process.
The corresponding multichannel Yule-Walker
equations for the backward parameter B
p
(⋅) can also
be derived in a similar way as
] [
b
ppp
P00Rb "= , (7)
in which
] )1( )([ IBBb
ppp
p "
=
. (8)
The matrix
]}1[]1[{ −−= nnE
H
b
p
b
p
b
p
eeP is the
covariance matrix of the driving noise process for
the backward AR(p) process.
The matrix R
p
has a Hermitian and a block-
Toeplitz structure. On a matrix element-by-element
basis, the prediction parameter matrices possess the
recursion relationships
)1()1()()(
11
kppkk
pppp
−++
+
=
++
BAAA
(9)
)1()1()()(
11
kppkk
pppp
−++
+
=
++
ABBB (10)
for k=1 to p. Define
]}1[][{ −= nnE
H
b
p
f
p
fb
p
eeP , i.e.
fb
p
P is the cross correlation between the forward and
backward linear prediction residuals at one unit of
delay. Then the normalized partial correlation, a
counterpart to the single-channel reflection
coefficient in multichannel case, can be derived as
H
b
p
fb
p
f
pp
−−
+
⎟
⎠
⎞
⎜
⎝
⎛
⎟
⎠
⎞
⎜
⎝
⎛
=
2
1
1
2
1
1
PPPΛ
, (11)
in which the superscript
1/2
denotes the lower
triangular matrix obtained by the Cholesky
decomposition of the Hermitian matrix, and the
superscript
−H
represents the matrix Hermitian of its
inverse. And then, A
p+1
(p+1) and B
p+1
(p+1) can be
expressed in terms of
1+p
Λ as
1
2
1
1
2
1
1
)1(
−
++
⎟
⎠
⎞
⎜
⎝
⎛
⎟
⎠
⎞
⎜
⎝
⎛
−=+
b
pp
f
pp
p PΛPA (12)
and
1
2
1
1
2
1
1
)1(
−
++
⎟
⎠
⎞
⎜
⎝
⎛
⎟
⎠
⎞
⎜
⎝
⎛
−=+
f
p
H
p
b
pp
p PΛPB
(13)
respectively. In addition, the order update for the
covariance matrix of the driving noise process can
also be derived by
f
ppp
f
p
pp PBAIP )]1()1([
111
++−=
+++
(14)
and
b
ppp
b
p
pp PABIP )]1()1([
111
++−=
+++
. (15)
Finally, the relationships of the driving noise
process between AR(p) and AP(p+1)can be obtained
by
]1[)1(][][
11
−++=
++
npnn
b
pp
f
p
f
p
eAee (16)
and
][)1(]1[][
11
npnn
f
pp
b
p
b
p
eBee ++−=
++
. (17)
BIOSIGNALS 2010 - International Conference on Bio-inspired Systems and Signal Processing
170
The above procedure is summarized in Table 1. It
is assumed that there are N samples in each channel
and the order of two-channel AR process is P.
For two-channel AR spectral estimation, define
the complex exponential vector E
P
(f) of P+1 block
elements as
] [)(
22
IIIE
TPfjTfj
P
eef
⋅⋅⋅⋅⋅
=
ππ
" , (18)
in which T is the evenly sampled interval (sec) of the
signals x[
⋅
]. After the computation of the related
coefficients, the power spectrum density (PSD) can
be calculated by
11
])([)]([)(
−−
=
H
PP
f
P
H
PPAR
ffTf aEPEaP (19)
⎥
⎦
⎤
⎢
⎣
⎡
=
)()(
)()(
2221
1211
fPfP
fPfP
, (20)
where a
P
is defined in (4).
The magnitude squared coherence (MSC)
)()(
)(
)(
2211
2
21
fPfP
fP
fC =
(21)
and the coherence phase
)}(Re{
)}(Im{
tan)(
21
21
1
fP
fP
f
−
=
θ
(22)
versus frequency f are utilized for the coherence
analysis between respiration and the PPG signal
acquired from pulse oximeter in this research. From
equation (20), P
11
(f) and P
22
(f) versus f are the PSD
of respiration and PPG signal respectively.
3 RESULTS AND DISCUSSION
The coherence between the respiratory signal and
the PPG signal acquired from pulse oximeter at
different breathing status for five subjects was
analyzed to evaluate their relationships in frequency
domain. Though only the results for one subject are
demonstrated in this paper, similar results are
derived for all subjects.
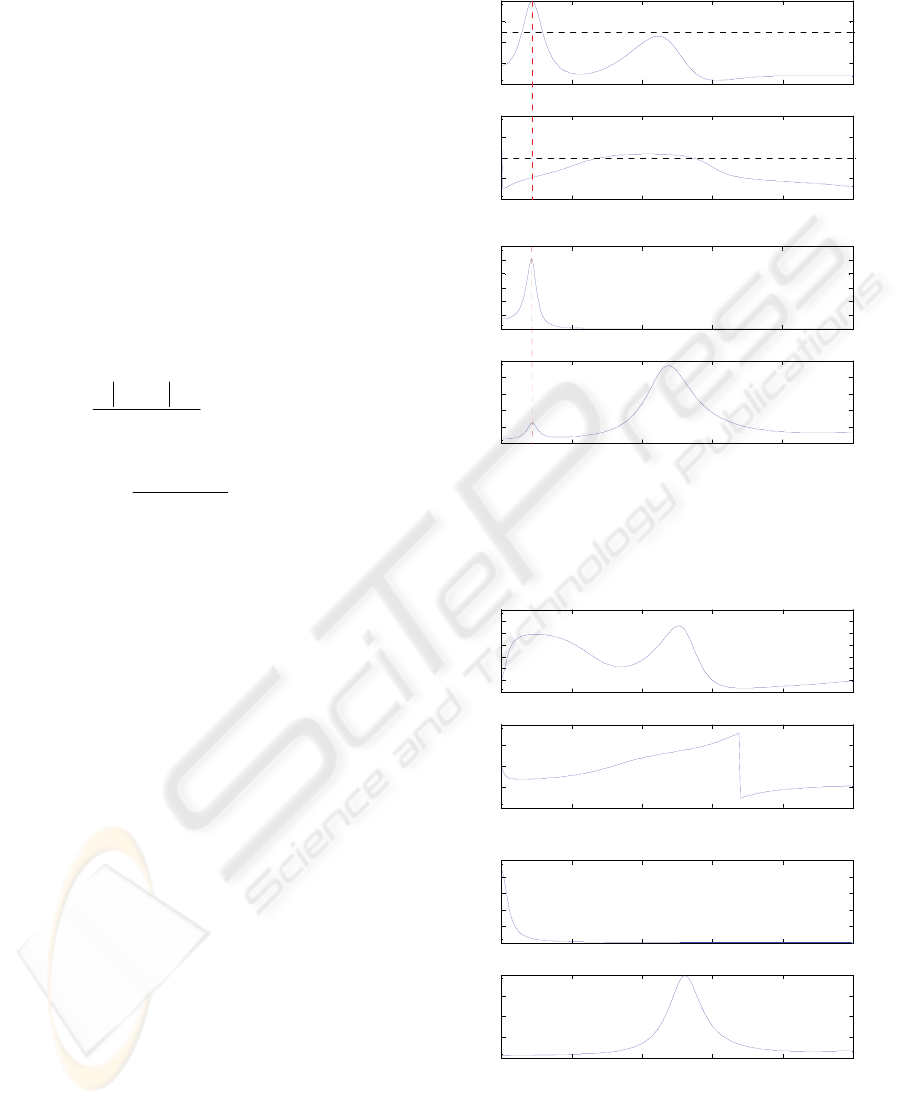
Figure 2 shows the coherence analysis results for
one subject in the condition of natural frequency. As
seen in Figure 2(a), there exists a peak of MSC
greater than 0.5 near 0.2 Hz (the respiratory
frequency, see Figure 2(b)). Also, the coherence
phase is smaller than zero (see Figure 2(a)), which
imply that the changes due to respiration in PPG lags
the respiratory signal. It also can be appreciated that
there is one corresponding component near the
respiratory frequency in the spectrum of PPG signal,
as depicted in the lower trace of Figure 2(b). This
component is relatively smaller in magnitude
compared with the dominant peaks which relate
directly to the heart beats.
0 0.5 1 1.5 2 2.5
0
0.2
0.4
0.6
0.8
Frequency (Hz)
Magnitude Squared Coherence
0 0.5 1 1.5 2 2.5
-4
-2
0
2
4
Frequency (Hz)
Coher en ce P hase
(a)
0 0.5 1 1.5 2 2.5
0
2
4
6
8
10
12
Frequency (Hz)
PSD (Respiration)
0 0.5 1 1.5 2 2.5
0
2
4
6
8
10
Frequency (Hz)
PSD (PPG)
(b)
Figure 2: Coherence analysis results for the case of natural
respiration: (a) MSC (upper) and coherence phase (lower),
(b) PSD of respiratory signal (upper) and PPG signal
(lower).
0 0.5 1 1.5 2 2.5
0
0.05
0.1
0.15
0.2
0.25
0.3
0.35
Frequency (Hz)
Magni t ude Sq ua r e d C oh e r en ce
0 0.5 1 1.5 2 2.5
-4
-2
0
2
4
Frequency (Hz)
Coherence Phase
(a)
0 0. 5 1 1.5 2 2.5
0
0.5
1
1.5
2
2.5
Frequency (Hz)
PSD (Respiration)
0 0. 5 1 1.5 2 2.5
0
5
10
15
20
Frequency (Hz)
PSD (PPG)
(b)
Figure 3: Coherence analysis results at the breath-holding
condition: (a) MSC (upper) and coherence phase (lower),
(b) PSD of respiratory signal (upper) and PPG signal
(lower).
RESPIRATORY INFORMATION IN ARTERIAL OXYGEN SATURATION MEASUREMENT
171

0 0.5 1 1.5 2 2.5
0
0.1
0.2
0.3
0.4
Frequency (Hz)
Magnitude Squared Coherence
0 0.5 1 1.5 2 2.5
-1
0
1
2
3
4
Frequency (Hz)
Coher en ce P hase
(a)
0 0.5 1 1.5 2 2.5
0
0.02
0.04
0.06
0.08
0.1
0.12
0.14
Frequency (Hz)
PSD (Respiration)
0 0.5 1 1.5 2 2.5
0
1
2
3
4
5
6
Frequency (Hz)
PSD (PPG)
(b)
Figure 4: The results by FFT-based cross-spectrum
analysis for the case of natural respiration: (a) MSC (upper)
and coherence phase (lower), (b) PSD of respiratory signal
(upper) and PPG signal (lower).
The results in the breath-holding condition for the
same subject are demonstrated in Figure 3 with the
same order arranged in Figure 2. As all of the MSC
values are less than 0.5 (see Figure 3(a)), it is
appreciated that no coherence is found in such case.
The results derived by FFT-based cross-spectrum
analysis are demonstrated in Figure 4 (natural
respiration case for the same subject). The utilized
method is Welch’s estimate of periodogram (Welch,
1970) with Hanning window of length 128, 256-
point FFT and 64-point overlapping. It can be
appreciated that the coherence is not evident as
using Fourier-based techniques. One primary reason
may arise from the limited frequency resolution of
FFT-based techniques.
4 CONCLUSIONS
This study utilized multi-channel AR spectral
estimation method to investigate the coherence
between the respiratory signal and PPG signal
acquired from pulse oximeter under different
respiratory status. The Morf’s algorithm (Morf et al.,
1978) was used for the computation of two-channel
AR parameters. The algorithm is summarized in
Table 1. The AR-based coherence analysis results
Table 1: Morf’s Algorithm.
model. AR bivariate oforder the and
]][ ][ ]2[ ]1[[Let
=
=
P
Nn xxxxX
""
⎩
⎨
⎧
==
===
,2,1 ][][][
:
00
00
N
Nn fornnn
Hbf
bf
XXPP
xee
tionInitializa
"
1
]1[][
1
]1[]1[
1
][][
1
0
:
2
2
2
+=
⎪
⎪
⎪
⎩
⎪
⎪
⎪
⎨
⎧
−=
−−=
=
≤
=
∑
∑
∑
+=
+=
+=
pp
nn
N
nn
N
nn
N
Ppwhile
p
N
pn
H
b
p
f
p
fb
p
N
pn
H
b
p
b
p
b
p
N
pn
H
f
p
f
p
f
p
eeP
eeP
eeP
nComputatio
()
()()
⎪
⎩
⎪
⎨
⎧
−=+
−=+
−
+
−
+
1
1
1
1
)1(
)1(
f
p
H
fb
pp
b
p
fb
pp
p
p
PPB
PPA
⎪
⎩
⎪
⎨
⎧
++−=
++−=
+++
+++
b
ppp
b
p
f
ppp
f
p
pp
pp
PABIP
PBAIP
)]1()1([
)]1()1([
111
111
end for
kppkk
kppkk
pkfor
pppp
pppp
)1()1()()(
)1()1()()(
1,2,1
11
11
⎩
⎨
⎧
−+++=
−+++=
−
=
++
++
ABBB
BAAA
"
le end whi
end for
npnn
npnn
Nppnfor
f
pp
b
p
b
p
b
pp
f
p
f
p
][)1(]1[][
]1[)1(][][
,2,1
11
11
⎪
⎩
⎪
⎨
⎧
++−=
−++=
+
+
=
++
++
eBee
eAee
"
are demonstrated in Figure 2(a) and Figure 3(a). The
results show that they are coherent (MSC greater
than 0.5) at the respiratory frequency. In addition,
the response delay in PPG induced by respiration is
also implied in the negative coherence phase (see
Figure 2(a)). The respiration induced component is
evident in the AR-based PSD of PPG signal, as
shown in Figure 2(b). The coherence analysis is also
specific to respiration. As the breath is in holding
status, no coherent peak was found (see Figure 3).
The coherent phenomenon cannot be observed by
the FFT-based cross-spectrum method (as shown in
Figure 4).
The existence of coherent peak is determined by
whether the corresponding pole inside the unit circle
is prominent or not. It has been shown that the
coherence spectrum is sensitive and specific to the
BIOSIGNALS 2010 - International Conference on Bio-inspired Systems and Signal Processing
172

respiration in this research, it may be possible to
acquire the respiratory information from the PPG
signal by single-channel AR method with the
consideration of poles around the respiratory
frequency. It may provide another attractive
approach to acquire the respiratory information from
PPG signal without the need of filtering. It also
implies the possibility to acquire the other
physiological parameters other than arterial oxygen
saturation form pulse oximeters. Besides, the two-
channel AR method introduced in section 2 can be
easily expanded to more than three channels. Such
multi-channel AR method may be an alternative
attractive tool for the coherent analysis among
respiration, central venous pressure (CVP), arterial
blood pressure (ABP) and PPG signal in the related
research, e.g. for the cases in intensive care unit
(ICU) or during surgical operation.
ACKNOWLEDGEMENTS
The author wishes to express the gratitude to the
National Science Council, Taiwan, for the financial
support on this research (under contract number
NSC 97-2221-E-035-001-MY3 and NSC 97-2221-
E- 035-053).
REFERENCES
Hertzman, A. B. and Spielman, C. R., 1937, Observations
on the finger volume pulse recorded photoelectrically.
In Am. J. Physiol., vol.119, pp.334-335.
Johansson, A., Öberg, P. Å. and Sedin, G., 1999,
Monitoring of heart and respiratory rates in newborn
infants using a new photoplethysmographic technique.
In J. Clin. Monit., vol.15, pp.461-467.
Johansson, A. and Öberg, P. Å., 1999a, Estimation of
respiratory volumes from the photoplethysmographic
signal. Part I: experimental results. In Med. Biol. Eng.
Comput., vol.37, pp.42-47.
Johansson, A. and Öberg, P. Å., 1999b, Estimation of
respiratory volumes from the photoplethysmographic
signal. Part II: a model study. In Med. Biol. Eng.
Comput., vol.37, pp.48-53.
Levinson, N., 1947, The Wiener RMS (root mean square)
error criterion in filter design and prediction. In J.
Math. Phys., vol.25, pp.261-278.
Morf, M., Vieira, A., Lee, D. T. and Kailath, T., 1978,
Recursive multichannel maximum entropy spectral
estimation. In IEEE Trans. Geosci. Electron., vol.16,
pp.85-94.
Nilsson, L., Johansson, A. and Kalman, S., 2000,
Monitoring of respiratory rate in postoperative care
using a new photoplethysmographic technique. In J.
Clin. Monit., vol.16, pp.309-315.
Nilsson, L., Johansson, A. and Kalman, S., 2003,
Macrocirculation is not the sole determinant of
respiratory induced variations in the reflection mode
photoplethysmographic signal. In Physiol. Meas.,
vol.24, pp.925- 937.
Webster, J. G. Ed., 1997, Design of Pulse Oximeters, IOP
Publishing, Bristol.
Welch, P. D., 1970, The use of the fast Fourier transform
for the estimation of power spectra. In IEEE Trans.
Audio Electroacoust., vol.AU-15, pp.70-73.
RESPIRATORY INFORMATION IN ARTERIAL OXYGEN SATURATION MEASUREMENT
173
