
HUMAN BREAST SHAPE ANALYSIS USING PCA
Giovanni Gallo, Giuseppe Claudio Guarnera
Dipartimento di Matematica ed Informatica, Università di Catania, Catania, Italy
Giuseppe Catanuto
Humanitas Centro Catanese di Oncologia, Catania, Italy
Keywords: PCA, Shape descriptors, Breast, MRI, 3D reconstruction.
Abstract: This paper introduces a parametric space to describe the shape of human breasts. The parameter space has
been obtained from a sample of about 40 patient’s MRI taken in prone position. The data have been cleaned
from noise and disturbances and has been dimensionally reduced using Principal Component Analysis. If
two references relative to extremal shapes (one of a reconstructed breast and one of a severely aged breast)
are taken, all the other shapes span a continuum space that provides an objective way to classify and
describe the variability observed in the common clinical practice.
1 INTRODUCTION
Clinical practice for breast surgery requires reliable
objective techniques that may complement the direct
inspection of the surgeon. The techniques should be
the least invasive and at reasonable cost.
Our proposal makes use of Nuclear Magnetic
Resonances Imaging (MRI). This is nowadays a
standard radiological test that is performed in most
of the hospitals. It provides good information about
internal breast structures. It also provides, at
practically no cost, precise numerical measurement
of the 3D external surface of a woman’s breast.
These data are especially valuable if the patient is
put in a standard prone position during the MRI
acquisition.
For this purpose a collection of MRI data
relative to about 40 patients have been acquired with
a homogeneous clinical protocol. Using this data set
we have the opportunity to explore the variability
space of the human breasts and to try to isolate few
numerical parameters able to describe the shape
variations observed in the women population.
We have pre-processed the collected MRI data to
obtain geometrical models of the breasts eliminating
from them most of the experimental noise. These
standardized surfaces have been in turn processed
with the Principal Component Analysis to obtain an
average shape and a small set of principal
orthogonal modes that are able to explain and model
most of the observed variation in the data.
Larger clinical assessment of the proposed
technique is going to be the next step of this
research. At this stage we are already able to present
an interesting way to objectively evaluate a patient’s
breast within a span between some extremal cases.
2 PREVIOUS WORK
The description of the human shape by mean of a set
of numerical parameters has a long history. Perhaps
the first to propose such a way to describe the
human body are the Renaissance artists (Leonardo
da Vinci, Albrecht Durer). Efforts to systematically
measure body shape parameters have been carried
out in military environments (Clauser et al, 1987).
These efforts have been perfected by the availability
of recent laser body scanning techniques.
CAESAR is a joint European and American
funded effort that has brought to the constitution of
publicly available, massive database of the whole
human body shapes (Robinette et al, 1999). Since
the conclusion of this project, studies about
anthropometric measurements based on these public
data have become abundant in the published
literature. Principal Component Analysis has been
used in order to embed the “space” of human body
163
Gallo G., Claudio Guarnera G. and Catanuto G. (2010).
HUMAN BREAST SHAPE ANALYSIS USING PCA.
In Proceedings of the Third International Conference on Bio-inspired Systems and Signal Processing, pages 163-167
DOI: 10.5220/0002691501630167
Copyright
c
SciTePress

shapes in some low dimensional geometric variety
(Allen et al, 2003).
As for specific organs of the human body
considerably less work have been done and
published. Regarding human breasts few
experimental approaches have been published both
from the point of view of industrial and clothing
applications (Lee et al, 2004) and of medical studies
(Catanuto et al, 2005), (Catanuto et al, 2008). For
breast evaluation, laser scanning techniques are not
yet sufficiently robust: typically scanning time is too
long and patient’s breathing interferes too much with
the quality of the final data. Moreover areas of the
female torso may remain occluded to the optical
laser ray (Farinella et al, 2006).
As for the use of a parametric model to describe
the shape of the human breast a seminal paper using
a super quadric approach is (Chen et al, 2000).
In this paper we follow the approach of (Allen et
al, 2003) applying the principal modes obtained with
PCA to the problem of describing the breast.
3 PROPOSED METHODOLOGY
3.1 The Dataset
46 MRI of women’s breasts have been acquired. In
all the resonances the patient was lying prone and
left the breasts free to hung down influenced only by
gravity within the instrument.
Both right and left breasts images were acquired
in this way. The volunteers varied in age from 21 to
76 years. The majority of the cases are relative to
healthy women, but some pathological typical cases
have been also included in the study. Care has been
taken not to include extremely aberrated or
incomplete shapes.
The whole volume of the resonance for each
patient is made of 100 slices (50 slices for each
breast).
The rough data present heavy noise and need to
be cleaned and registered in a unique reference
frame for further processing. To obtain acceptably
smooth surfaces we apply the processing pipeline
described in the following section.
3.2 Surface Smoothing with
Polynomial Fitting
Noise reduction at each MRI slice is the very first
and preliminary processing that has been performed
on the data. The hypothesis of additive white
Gaussian noise, with zero mean and variance σ
L
2
at
each slice L is assumed. This allows to separately
process each slice. To statistically evaluate the noise
variance σ
L
2
in a slice we sample a reasonably large
region R where, with high probability, there is no
tissue. A natural candidate for R is the corner of the
slice opposite to the breast. The knowledge of σ
L
allows to precisely tune a rotationally symmetric
Gaussian lowpass filter of size h.
This first smoothing still leaves some amount of
salt and pepper disturbances. A median filtering is
used to reduce this noise without affecting edges and
hence without perturbing the profile of the breast/air
interface.
The precise identification of the breast/air
interface is subsequently performed with a
binarization procedure. An adaptive threshold for the
binarization is found on each slice separately. The
threshold value is determined looking at the
histogram of the pixel values in the region R
considered above. R is relative only to the air and
should ideally appear totally black. For this reason
the natural choice for the threshold value is the
maximum observed non zero value in R. The
resulting binarized images still may present isolated
dark areas within the tissue region and isolate bright
spikes in the air region. These artifacts are
appropriately removed with standard filtering.
To naively follow the border between black and
white areas in the slice at this stage would produce a
very jagged contour while a more regular curve is
desiderable.
Regularization is achieved first applying some
morphological operators and hence fitting a
polynomial curve. More precisely a morphological
binary dilation, followed by a morphological erosion
with a 3x3 pixels square as a structuring element is
performed (morphological closing). Eventually a
local robust regression using weighted linear least
squares and a second degree polynomial model is
used to further regularize the curve. To ensure
robustness the regression weights are assigned in
such a way that probable outliers gets a lower
weight. Zero weight is assigned to data outside six
mean absolute deviations.
The curves resulting from the application of this
procedure on each slice are finally assembled
together in a surface model by mean of bicubic
interpolation. Figure 1 summarizes the overall
process.
BIOSIGNALS 2010 - International Conference on Bio-inspired Systems and Signal Processing
164
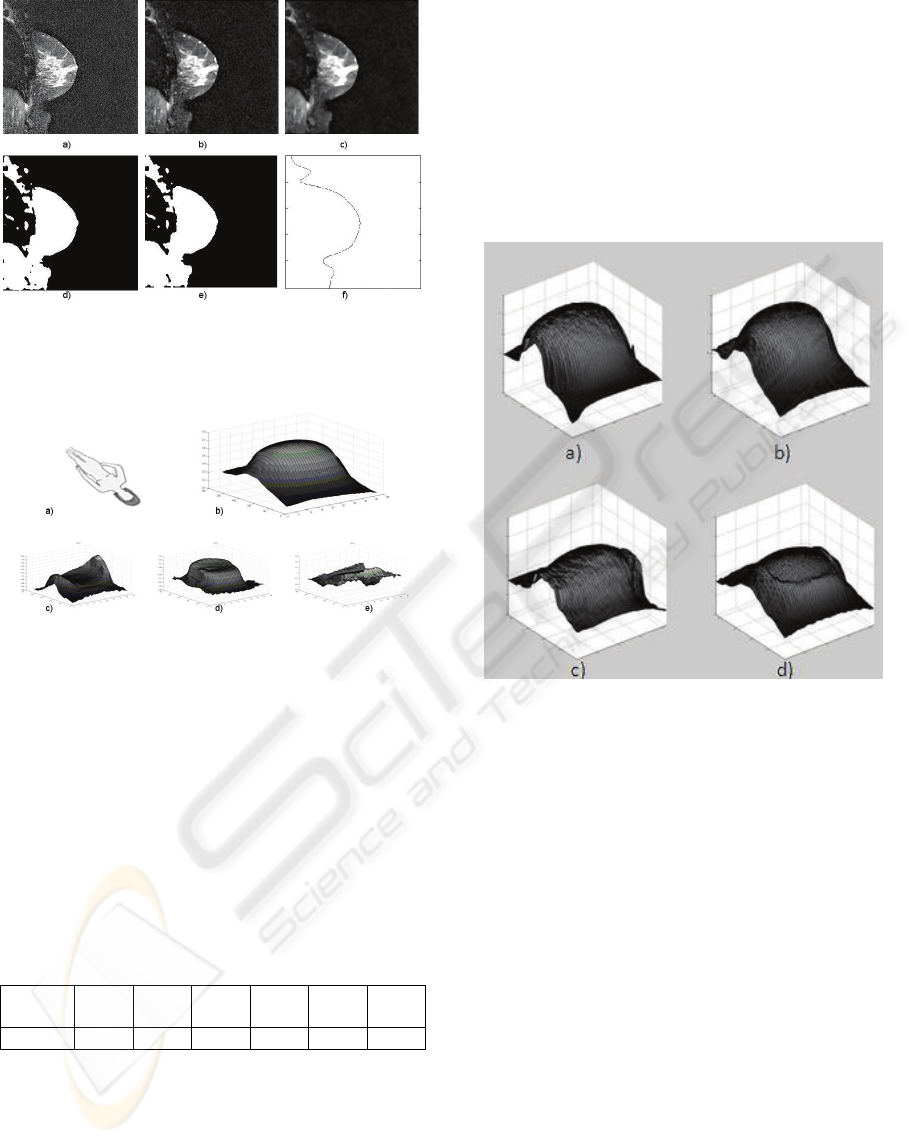
Figure 1: Steps of surface fitting. a) input slice; b) output
of Gaussian filter; c) output of median filter; d)
thresholding; e) morphological closing; f) local regression.
Figure 2: a) Figure orientation; b) average breast shape; c)
d) e) first three modes in order of relevance.
3.3 Principal Component Analysis of
Breast Shapes
Out of the complete data set we have set apart, for
further testing, ten randomly chosen breast shapes.
All the other smooth surface data (36 breast pairs)
have been processed using a standard
implementation of PCA analysis in MATLAB. The
average shape and the first three components are
reported in Figure 2.
Table 1: Eigenvalues of the covariance matrix.
Eigen
value
λ
1
% λ
2
% λ
3
% λ
4
% λ
5
% λ
6
%
λ
i
61.6 15 5.27 3.77 2.53 2.39
Table 1 reports the percentage relevance of the
six eigenvalues associated with the first six
components. In particular the first three components
explain about 82% of the total data variation. PCA
theory guarantees that the approximation error
introduced leaving the less significative modes out
of the reconstruction is mathematically bounded.
To experimentally confirm that the first six
components are sufficient to produce a fairly good
approximation of the real data even in the case of
extremely deformed shapes, we report the results of
the reconstruction of same real data using only the
first six modes both in the case of normal breast than
in the case of a severely deformed one. The
reconstructed models are shown in Figure 3. The
reader may visually appreciate the faithfulness of
both the reconstructions.
Figure 3: a) a normal breast and b) its reconstruction using
the first six modes; c) a deformed breast and d) its
reconstruction using the first six modes.
The knowledge of the average shape of the breast
together with the principal modes allows the
synthesis of new models. To enable the physician to
interactively explore the patient data and the
potentiality of the proposed modelling technique we
have implemented a graphical JAVA application.
The program makes use of the JAVA3D library to
interactively show a breast model. The model can be
moved in 3D with mouse gestures. A set of six
sliders provides the user with the possibility to
change the contribution to the final shape of each of
the six main modes. Changes in these weights are
immediately visible. Screenshots of the application
are shown in Figure 4a. The freely downloadable
JAVA code can be found at http://iplab.dmi.unict.it.
HUMAN BREAST SHAPE ANALYSIS USING PCA
165
4 RESULTS AND DISCUSSION
We have tested the proposed methodology in two
ways: reconstruction and guidance to qualitative
analysis.
As we mentioned above to test the expressive
power of the proposed shape descriptors we set apart
as control set a small number of randomly chosen
MRIs (10) for the modes extraction phase and we
reconstructed these left out breasts from the
computed orthogonal modes.
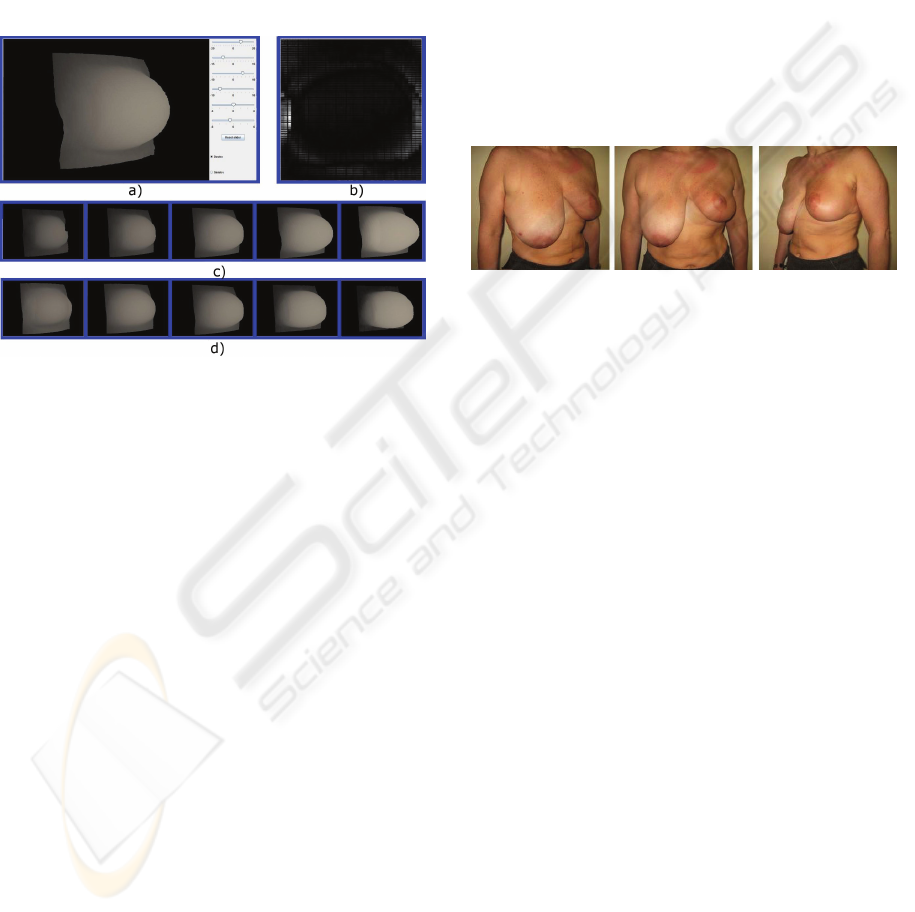
Figure 4: a) The graphical user interface of our JAVA
application; b) Typical reconstruction error distribution; c)
Variations induced by the first parameter; d) Variations
induced by the second parameter.
The control set included cases of fairly standard
breasts as well as cases of great deviance from the
norm. In all cases the reconstruction appeared to be
visually satisfactory although a degree of
approximation has been introduced. The mean error
distribution is shown in Figure 4b. Observe that
most of the error is localized only in peripherical
areas of the breast.
A relevant issue is if each mode may be
interpreted as a morphological macroscopic feature
with some clinical meaning. Although a precise
mapping of the proposed modes to common
properties like volume, roundness, concavity, etc is
unlikely, at least for the first two modes, some
correlation can be made. In particular the first mode
(whose associate eigenvalue weights 62%) induces
mostly volume variations (Figure 4c). As for the
second mode (whose associate eigenvalue weights
15%) it induces mostly variations in the degree of
protrusion of the breast in front of the sternum
(Figure 4d).
These observation suggested the construction of
a linear scale to qualitatively evaluate breast shapes.
Please note that the proposed scale is here just
exemplary: the construction of a well balanced and
universal scale is well beyond the scope of the
present research, but we believe that our approach
may be very helpful in this direction.
Keeping in mind the previous caveat we selected
two extremal breast shapes in our database. In
particular the doctors choose as a reference the case
of a patient whose photograph is shown in Figure 5.
The patient is a 48 aged woman whose left breast
has been surgically reconstructed after the resection
of a tumor, while the right breast has been only
subject to normal aging. These left and right breasts
constitute in a way two extremal cases. It is, in a first
hypothesis, reasonable to believe that all the breast
shapes may span between these two poles.
Figure 5: Reference case: woman whose left breast has
been surgically reconstructed after the resection of a
tumor, while the right breast has been only subject to
normal aging.
To check this idea we computed the “distance”
of the other breast shapes from the two extremal
cases. More precisely, the “distance” from shape A
to shape B is defined, in this context, as the
Euclidean distance in ℜ
d
between the normalized
first d coefficients in the PCA expansions of A and
B. We experimentally found visually clearer results
for d = 2.
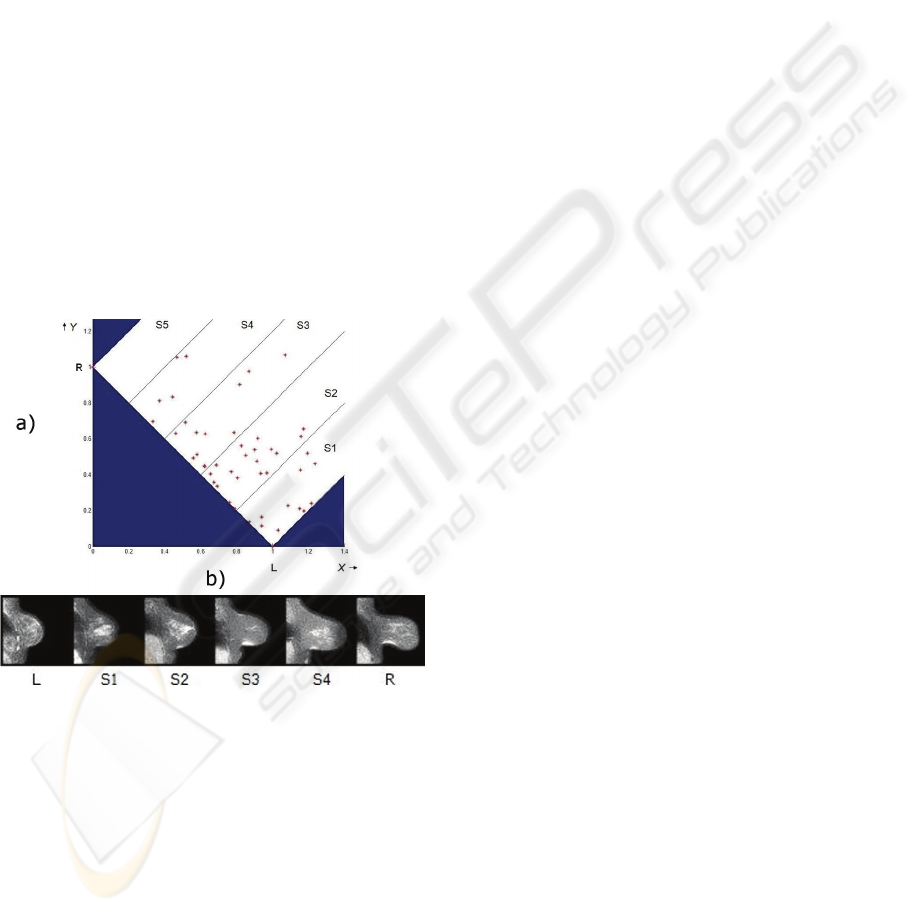
Figure 6a shows a plot of the breast shapes in a
X-Y plane. The X coordinate of each data point
represents the distance of the breast from the left
breast of Figure 5; the Y coordinate of each data
point represents the distance of the breast from the
right breast of Figure 5.
We partitioned the span between the two
extremal cases into 5 parallel strips (S1 – S5). For
each not empty strip we choose a central data point.
Figure 6b shows the central sections of the 4
selected shapes between the central sections of the
two reference breasts. As it is evident the
progression between the two extremal cases appear
to be gradual and of immediate clinical meaning.
BIOSIGNALS 2010 - International Conference on Bio-inspired Systems and Signal Processing
166
5 CONCLUSIONS AND FUTURE
WORK
In this paper we have presented an embedding of the
shape space of the human female breast into a low
dimensional linear parameter space. The proposed
parameterization has been experimentally obtained
from a set of purposely collected and properly
processed MRI data. The data have been processed
for noise removal and analyzed with the PCA
technique.
A first medical assessment of the model, done
using a 3D software especially developed for this
application, proved that this technique may be of
clinical relevance. A tentative qualitative scale for
breast evaluation has been proposed.
Future research to be done in this area will
include refinement and clinical evaluation of a
qualitative shape space, investigation of the
geometrical meaning of the principal modes and
assessment of the correlation between the PCA
expansion coefficients with other medical indeces of
common clinical usage.
Figure 6: a) The X coordinate of each data point represents
the distance of the breast from the left breast (L) of Fig.5;
the Y coordinate of each data point represents the distance
of the breast from the right breast (R) of Fig.5. b) Central
sections of the 4 selected shapes between the central
sections of the two reference breasts; strip S5 is empty.
REFERENCES
Clauser, C., et al., 1987. Measurer’s Handbook: U.S.
Army Anthropometric Survey 1987-1988. United
States Army Natick Res. Dev. And Eng. Center,
Natick Ma.
Robinette, K.M., Daanen, H., Paquet, E., 1999. The
CAESAR project: a 3-D surface anthropometry
survey. In: Proceedings of Second International
Conference on 3-D Digital Imaging and Modeling, pp.
380-386.
Allen, B., Curless, B., Popović, Z., 2003. The space of
human body shapes: reconstruction and
parameterization from range scans. International
Conference on Computer Graphics and Interactive
Techniques, pp. 587 – 594.
Lee, H.-Y., Hong, K., Kim, E. A. 2004. Measurement
protocol of women’s nude breasts using a 3d scanning
technique. In: Appl Ergon 35, pp. 353–360.
Catanuto, G., Gallo, G., Farinella, G.M., Impoco, G.,
Nava, M.B., Pennati, A., Spano, A., 2005. Breast
shape analysis on three-dimensional models. Third
European Conference on Plastic and Reconstructive
Surgery of the Breast .
Catanuto, G., Spano, A., Pennati, A., Riggio, E., Farinella,
G.M., Impoco, G., Spoto, S., Gallo, G., and Nava,
R. B., 2008. Experimental methodology for digital
breast shape analysis and objective surgical outcome
evaluation. Journal of Plastic, Reconstructive &
Aesthetic Surgery, vol. 61(3), pp. 314-318.
Farinella, G.M., Impoco, G., Gallo, G., Spoto, S. and
Catanuto, G., 2006. Unambiguous Analysis of
Woman Breast Shape for Plastic Surgery Outcome
Evaluation. In: 4th Conference Eurographics Italian
Chapter.
Chen, D. T., Kakadiaris, I. A., Miller, M. J., Loftin R. B.,
and Patrick, C., 2000. Modeling for Plastic and
Reconstructive Breast Surgery. Medical Image
Computing and Computer-Assisted Intervention,
MICCAI 2000, pp.146-162.
HUMAN BREAST SHAPE ANALYSIS USING PCA
167
