
Determining the Railway Track Condition
using the INS / GPS System
Emil Yonchev, Rossen Miletiev and Rumen Arnaudov
Technical University – Sofia, Sofia, Bulgaria
Abstract. The paper discusses the development of the “test vehicle” system for
preliminary test of the railroad. The test is accomplished on the basis of the own
developed systems for data storage based on the GPS receiver and inertial
sensors. All data are stored in the external energy independent memory
(FLASH) while the navigation data are sent to the navigation server via GPRS
network. The quality of the railway is determined according to the three axis
acceleration analysis while the GPS receiver defines the event position. The
experimental data are recorded on the selected part of the railroad and
furthermore are analyzed.
Keywords: Railway faults, GPS receiver, Accelerometer.
1 Introduction
Nowadays the railway geometry is measured by the high speed wagon measurement
tools like EM120 or EM250 [1]. These tools control the railway condition and
parameters, which are compared with the regulation technical data. The control is
performed according to the preliminary elaborated schedule while the time period
between two consecutive tests is defined as one year or higher. During this period it is
possible to emerge a digression at the railway geometry, which is a potential source of
an accident. This is the reason to develop a system, which may register the railway
places with increased risk to avoid the accidents during the exploitation time. This
system does not require any additional high – qualified personal or railway
equipment.
The “test vehicle” system is developed at [2]. The dangerous railway places are
recognized according to the effective values of the vehicle accelerations. Another
method is discussed at [3], where the proposed method for defect recognition is based
on wavelet transformations of the acceleration signals. This method requires a perfect
suspension state to guarantee the correct results. Another method for determination of
the railway deflection in the longitudinal direction is proposed at [4], which is based
on the acceleration of the vehicle terminal junction. Such type of test systems are also
proposed at [5] and [6] but their high cost limited their application in the railway
systems.
Yonchev E., Miletiev R. and Arnaudov R.
Determining the Railway Track Condition using the INS / GPS System.
DOI: 10.5220/0004463300710077
In Proceedings of the 3rd International Workshop on Enterprise Systems and Technology (I-WEST 2009), pages 71-77
ISBN: 978-989-674-015-3
Copyright
c
2009 by SCITEPRESS – Science and Technology Publications, Lda. All rights reserved
2 “Test Vehicle” System Description
The “test vehicle” system is realized with the measuring system, described at our
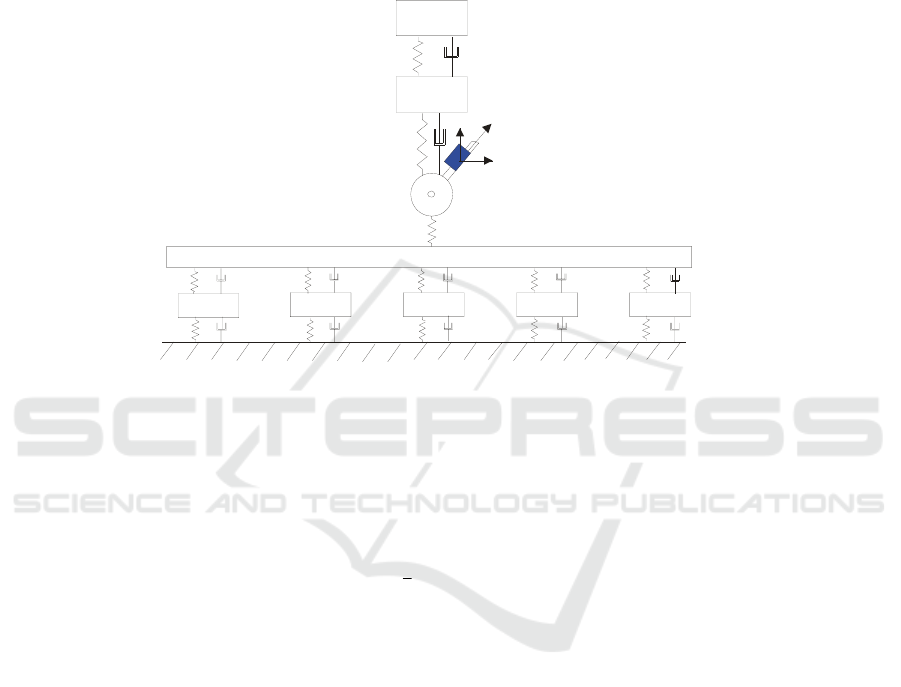
previous work [7] (Fig.1), which is installed on a locomotive traveled regularly on the
selected route. The measuring system is mounted on the locomotive reduction gear to
ensure the system will measure only accelerations originated from the rails.
Car body
GPS/INS device
X
Z
Y
Suspension
Suspension
Wheelset
Rail
Sleeper
Groun
d
Bogie
Fig. 1. Measuring system details.
The dynamics of the railway – locomotive interaction in the vertical direction may
be explained with the mathematical model shown at Fig.1. The frequency distribution
of the acceleration data vary from one axis to another. The maximum frequency of the
vertical and lateral fluctuations is limited from 0.5 to 1Hz. In the same time the
railway faults generate vibrations with a maximum frequency up to 2000Hz.
The force/translation (F/y) relation is described according to the equation:
2
3
.ycF
h
=
(1)
The connection between the wheel and the railroad is very tight, so the wheel
translation repeats the railway faults. If the railway quality is very good, the system
vibrations are provoked by the non – parallel rail position or rail defects.
The proposed system measures the accelerations of all three axes. The acceleration
data are recorded with the GPS navigation data as a data block per 1 second. One data
block contains 40 inertial data and 1 GPS message, so the time distance between the
inertial samples are defined as 0.025s. The traveled distance for each data block is
defined as follows:
vt
мин
..2
Δ
≥Δ
λ
(2)
72
where
мин
λ
Δ - traveled distance,
Δ
t – time interval and v - vehicle speed. If
the maximum speed is limited to 60km/h, the traveled distance is equal to
мин
λ
Δ =
0.833m.
The normative standards define the lateral acceleration maximum value. For
Bulgarian railway this value is set to 0.85m/s
2
. The maximum longitudinal
acceleration varies according to the vehicle speed, but its maximum value is set to
0.6m/s
2
. Esveld [8] defines the safety maximum accelerations of the French railway
company SNCF. These values are summarized at Table 1.
Table 1.
Transverse cart acceleration 6 m/s
2
Vehicle speed
V<350 km/h
Transverse crate acceleration 2.5 m/s
2
Vertical crate acceleration 3 m/s
2
These values may be used as recommended maximum values for inertial data
analysis.
3 Experimentation Results
The experiment is implemented for ten days while the test vehicle is driven on the
same route. The navigation and inertial data are recorded on MMC/SD memory card
and are simultaneously transmitted to the map server via GPRS network. Furthermore
the data are analyzed using MATLAB software tools.
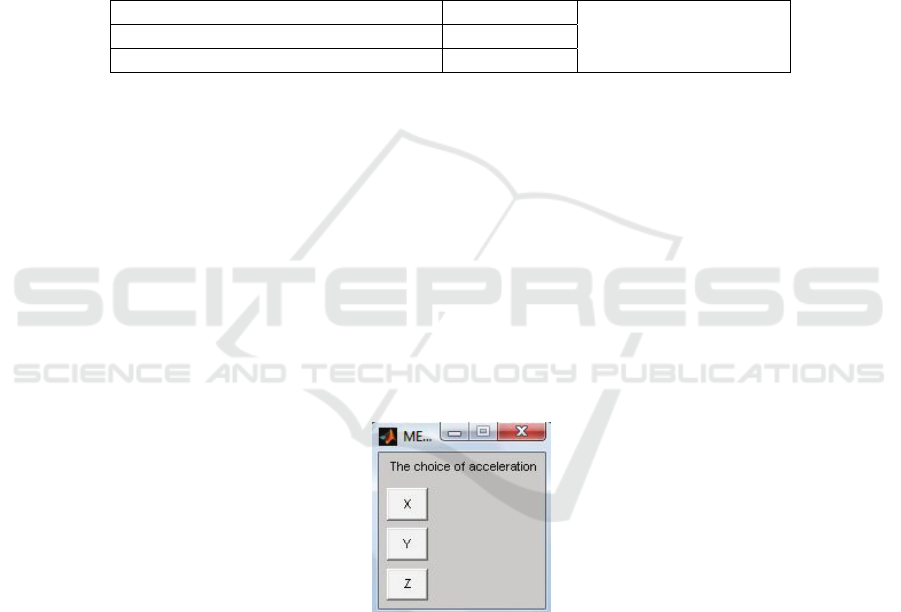
The developed software tool allows to select the desired maximum acceleration
limit and to find the places where the previously defined limit is overcome. This
choice is made through GUI (Graphic User Interface) menu (Fig.2).
Fig. 2. Graphic User Interface menu.
The MATLAB tool also allows to select one or more days using alternative menu
(Fig.3).
73
Fig. 3. Alternative menu.
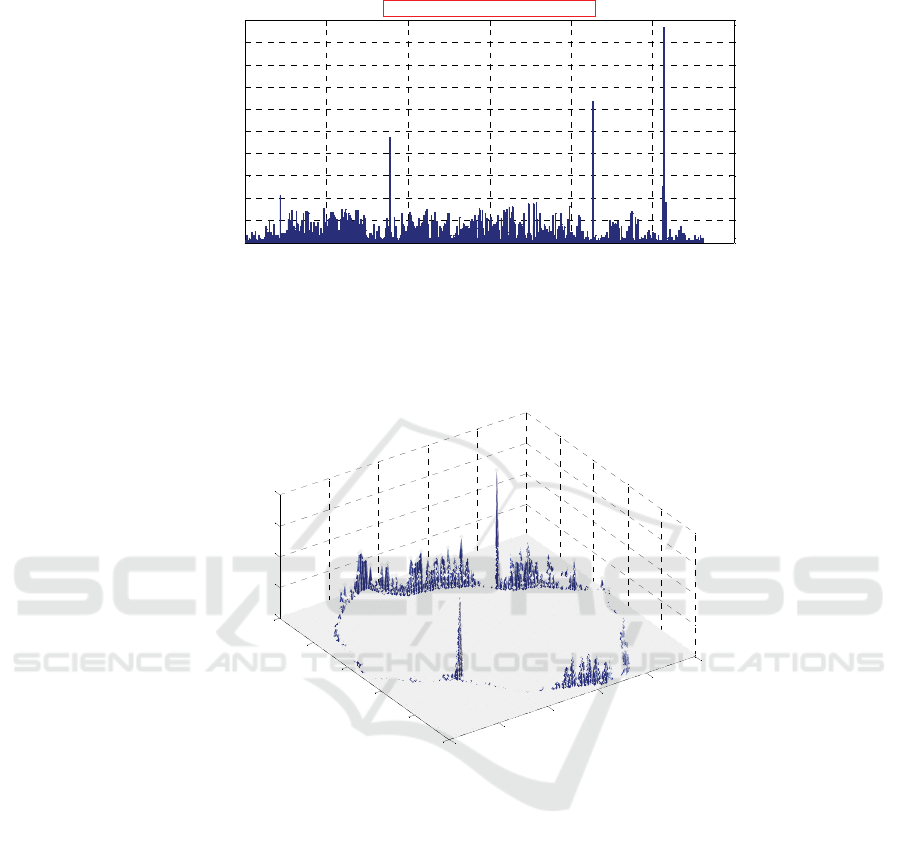
The basic criterion of the railway faults is based on the number of acceleration
values which overcome the selected maximum value. The analyzed railway length is
set to 80m. The distribution of the number of points where the acceleration exceeds
the limit is shown at Fig.4 (analyzed acceleration – X axis, maximum acceleration -
0.4m/s
2
).
Fig. 4.
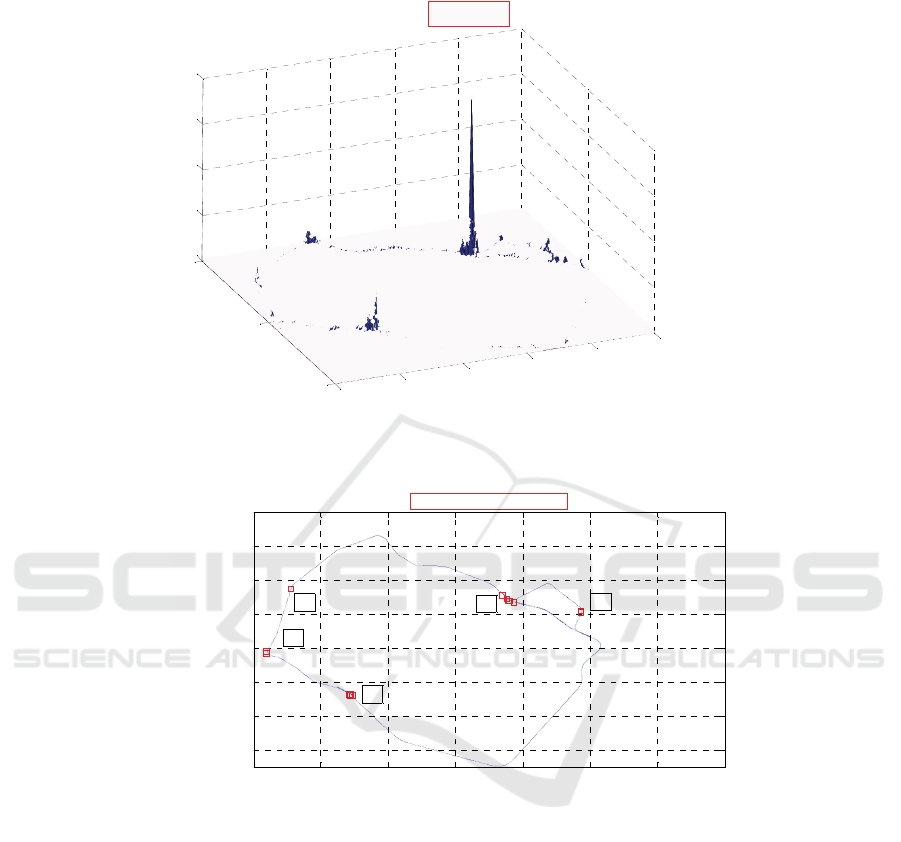
Figure 5 also represents the number of points with exceeded acceleration on 3D
map. At this figure the latitude and longitude regions are divided to 100 bars to create
3D map.
When the points of interest are determined the tool may print that points which
acceleration exceeds a given number. Figure 6 represents such distribution when the
number of points of interest for some region exceeds the limit of 110 coincidences.
74
0
20
40
60
80
100
0
50
100
0
500
1000
1500
2000
Latitude bar
Longitude bar
Hits
X= 0 . 4 m / s s
Fig. 5.
23.3 23.35 23.4 23.45 23.5 23.55 23.6 23.65
42.66
42.68
42.7
42.72
42.74
42.76
42.78
42.8
Longitude
Latitude
Lateral acceleration X=0.4m/ss
5
1
2
3
4
Fig. 6.
The Z axis is also analyzed to specify the railroad condition. The limitation
value is set to 4m/s
2
and the obtained distribution of Z accelerations which exceed the
selected limit is shown at Figure 7.
75
0 100 200 300 400 500 600
0
20
40
60
80
100
120
140
160
180
200
Code of the points with equal coordinates
Number of the matches for a point
Distrbution of the matches when Z=4m/ss
Fig. 7.
The same distribution with shown latitude and longitude bars in 3D graphic is
shown at Figure 8. At this figure the longitude and latitude regions are also divided to
100 bars.
0
20
40
60
80
100
0
20
40
60
80
100
0
50
100
150
200
Latitude bar
Longitude bar
Hits
Fig. 8.
The limit number of matched points is set to 45 and the number of points of
interest are estimated from Figure 7 and their position are shown at Figure 9.
76
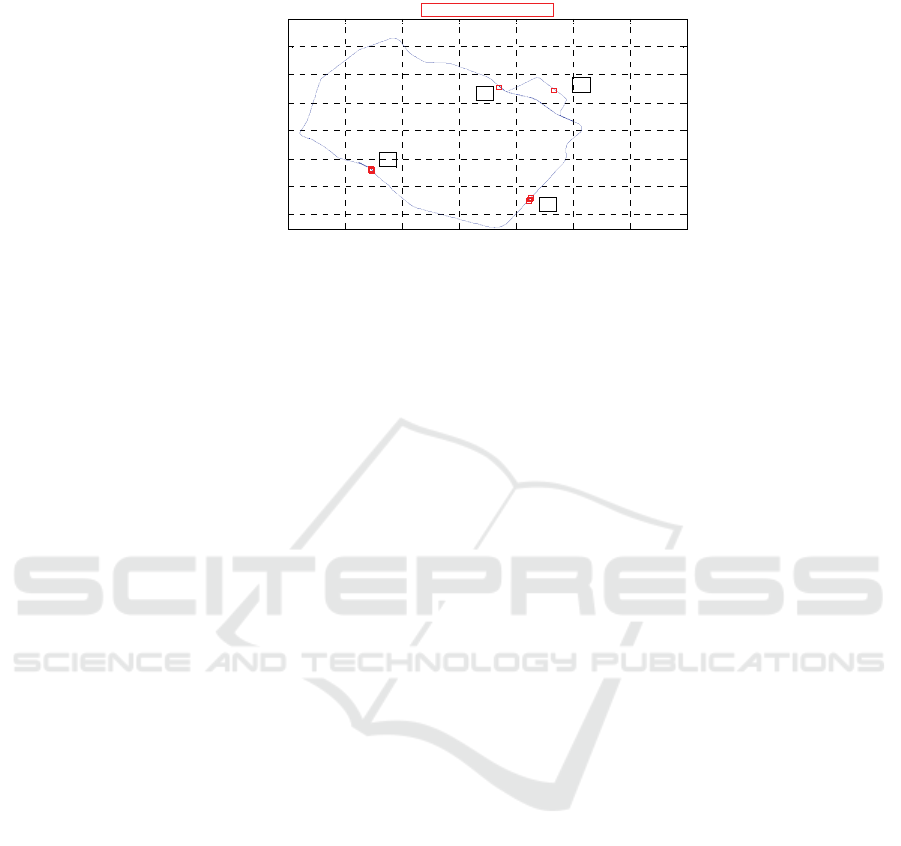
23.3 23.35 23.4 23.45 23.5 23.55 23.6 23.65
42.66
42.68
42.7
42.72
42.74
42.76
42.78
42.8
Longitude
Latitude
Vertically acceleration Z=4m/ss
1
2
3
4
Fig. 9.
4 Conclusions
The proposed “test vehicle” system may be used for preliminary test of the railroad
state to increase the safety level of the railways. As the system is permanently
installed on the locomotive, it constantly gives the actual information and may
warning for railway problems in a real time via GPRS network. When such condition
is found, the railway company may use standard measurement tools to establish the
real railroad state to increase the safety level.
References
1. Gerard Presle, Head, Track Engineering Division Austrian Federal Railways, The EM250
high-speed track recording coach and the EM-SAT 120 track survey car, as networked
track geometry diagnosis and therapy systems, Rail Engineering International, Edition
2000, Nr. 3.
2. H. Tsunashima, T. Kojima, Y. Marumo, A. Matsumoto, T. Mizuma, Condition monitoring
of railway track and driver using in – service vehicle.
3. Y. Hayashi, T. Kojima, H. Tsunashima and Y. Marumo , Real time fault detection of rail
way vehicles and tracks, Railway Condition Monitoring 2006, pp. 20-25, (2006).
4. Biswajit Basu, Dermot O’Dwyer and David Hegarty, Identification of track quality from
measured response data of the vehicle
5. K.P. Schwarz, H. E. Martell, N. El-Sheimy, R. Li, M.A. Chapman, D. Cosandier, VIASAT
- A Mobile Highway Survey System of High Accuracy, IEEE - IEE Vehicle Navigation &
Information Systems Conference, 0tta.wa - VNlS '93, pp. 476-481.
6. Ralph Glaus, Dr. M. Troller, The Swiss Trolley – A Modular System for Track Surveying,
Institut für Geodäsie und Photogrammetrie ETH Zürich, 2006.
7. Iontchev E. Iv. , Rossen Miletiev R. G., Event data recorder for land vehicles and cargo, pp
91-93, V International science - application conference “Trans–Mech–Art–Chem”,
Moscow Government University MIIT 2008.
8. Coenraad Esveld, Modern railway track, MRT-Productions, Duisburg, Germany, 1989,
pp.567.
77
