
CHARACTERIZING THE TRAFFIC DENSITY AND ITS
EVOLUTION THROUGH MOVING OBJECT TRAJECTORIES
Ahmed Kharrat, Karine Zeitouni, Iulian Sandu-Popa
PRiSM Laboratory, University of Versailles 45, Avenue des Etats-Unis - 78035 Versailles, France
Sami Faiz
LTSIRS, Ecole Nationale D’ingénieurs de Tunis, B.P. 37, 1002 Tunis-Belvédère, Tunisia
Keywords: Moving object databases, Spatiotemporal data mining, Similarity, Clustering, Density analysis.
Abstract: Managing and mining data derived from moving objects is becoming an important issue in the last years. In
this paper, we are interested in mining trajectories of moving objects such as vehicles in the road network.
We propose a method for discovering dense routes by clustering similar road sections according to both
traffic and topology in each time period. The traffic estimation is based on the collected object trajectories.
We also propose a characterization approach of the temporal evolution of dense routes by a graph
connecting dense routes over consecutive time periods. This graph is labeled by the degree of evolution. We
have implemented and tested the proposed algorithms, which have shown their effectiveness and efficiency.
1 INTRODUCTION
Managing the location of moving objects is an
important issue in several applications mainly in
transport. Some applications meant to monitor and
forecast the traffic use fleets of vehicles equipped
with GPS as probe vehicles, generating Floating Car
Data. In this paper, we focus on moving objects
(MO) that follows a (road) network - so-called
network constraint MO- predominant is real world.
An effective and scalable analysis of such large size
dataset is a great challenge today. This has
motivated research on spatio-temporal data mining
aiming at discovering meaningful knowledge from
this MO data. Trajectory clustering (Lee et al., 2007)
is part of these researches and is one subject of this
paper. The other part is the use of the clusters in
assessing the traffic density and tracking its
evolution over the time. Indeed, with the predictable
availability of trajectory databases, we believe this
could be a better alternative to the analysis of other
traffic sounders (such as under-the-road magnetic
field sensors). First, it covers all the roads. Second, it
does not require any installation or maintenance on
the road network and then has a minimal cost.
Some approaches exist for trajectory data mining
(Li et al., 2007). However, most of them do not
exploit the topology of the underlying network that
has an obvious impact of the density propagation.
Moreover, they do not account for the evolution of
the density over time. Highlighting this evolution
results in a meaningful knowledge – as far as we
know- has not been peered through before.
Our approach is based on two assumptions: the
first is that knowing the statistics on the traffic
density on the network would enable to orient the
grouping road sections by density resulting in dense
routes, then the second is that the dense routes
interact with each other in time, which may fully
describe the evolution of the network density.
In (Kharrat et al., 2008), we presented a
clustering algorithm applied to road sections in order
to discover dense routes, though without considering
the time aspect. As an extension of this algorithm,
we propose here a method to discover dense routes
by clustering nearby sections that show similar
traffic density for each time interval. The traffic is
assessed thanks to the collected spatiotemporal
trajectories. Moreover, we deal with the time
evolution of dense routes and characterize it through
a labeled graph.
Basically, the main contributions of this paper are
those mentioned below:
− We define some new similarity functions
319
Kharrat A., Zeitouni K., Sandu-Popa I. and Faiz S. (2009).
CHARACTERIZING THE TRAFFIC DENSITY AND ITS EVOLUTION THROUGH MOVING OBJECT TRAJECTORIES.
In Proceedings of the International Conference on Knowledge Discovery and Information Retrieval, pages 319-322
DOI: 10.5220/0002309403190322
Copyright
c
SciTePress

− We propose a method to cluster the road sections
based upon the network density statistics. Unlike
some existing work, this clustering takes into
account the orientation of the trajectory. Besides,
this method utilizes the network topology to create
relevant clusters.
− We propose a model to assess the evolution for
dense route pairs at two consecutive time intervals.
− We propose a graph conveying the evolution as a
mean to describe the information in a synthetic
manner and to question the evolution of the density
through the whole network.
The rest of the paper is structured as follows. We
describe a few preliminary concepts in section 2. In
section 3, we present the first step concerning the
clustering of road sections. The second step related
to the evolution graph construction is presented in
section 4. In section 5, we present the result of our
experimental study. Finally, section 6 concludes this
paper and sketches some future orientations.
2 PRELIMINARIES
The representation of the network is given by the set
of road sections. The road section is represented
through a graph NG (N, S). S is the set of directed
segments, where each one represents the smallest
unit of road section. N is the set of nodes, where
each one represents a road junction.
Besides, knowing the set of trajectories, we
compute a matrix of transitions for the road network
at each time interval. This tells how many times the
junction have been taken for each turning movement
(i.e. between each pair of adjacent sections), by
reporting the number of moving objects going from
one section to another at each time interval. This
matrix is denoted M and M(i,j) represents the
number of moving objects passing through S
i
to
section S
j
within the interval It
n
(n ∈ {1,…,k}, k
stands for the number of time intervals). We also
denote S
ij
the transition (or turning movement) from
S
i
to S
j
.
We adopt a symbolic representation of the
trajectories as in (Du Mouza C. and P. Rigaux,
2004), (Wan T., K. Zeitouni, 2005). In this model, a
moving object trajectory tr is described by an
identifier (tid) and a sequence of symbols where
each one refers to a road section (S
i
), followed by a
temporal identifier (t
i
) referring the time of entry of
the trajectory tid to S
i
:
tr = (tid , <(S
i1
t
j1
), (S
i2
t
j2
), …, (S
ik
t
jk
)>) with S
in
∈ S
The order of symbols in the sequence above shows
the movement direction.
Concerning the similarity measure adopted in
this work, we define the similarity (Trans_sim) at
the level of the network for two adjacent transitions
S
ij
and S
jk
as the difference of their density values:
While the similarity between nonadjacent
transitions is null:
Trans_sim (S
ij
, S
uv
) = 0 if i≠v and j≠u
(2)
We define another similarity measure between dense
routes (Route_sim). It allows comparing the dense
route. Two routes are considered similar (with a
similarity equal to 1) if they share at least one road
section that corresponds to two successive time
intervals. Otherwise, their similarity is null.
3 SECTION CLUSTERING
We call our proposed algorithm NETSCAN. It
carries out the clustering of dense sections and
incorporates them by forming dense routes. It is
inspired from the density based clustering principle
introduced with DBSCAN algorithm (Ester et al.,
1996), while applying it to road sections. It takes as
input the set of sections that constitute the road
network, the spatiotemporal transitions matrix
associated with each time interval, a density
threshold α and a similarity threshold ε between the
transition densities. NETSCAN finds firstly the
dense transitions, i.e. those having maximum value.
Afterwards, for each dense transition, it groups the
connected segments and transitions that have similar
densities, thus creating dense routes.
The process begins with the transition having the
maximal density. Then, it begins searching the
connected transitions in both ways in order to find
those with a density ε near to the maximal one. To
insure the non reuse of transitions that are included
in dense routes, they are marked at the first
assignment.
The extension of a dense route is done in both
ways if the constraints are verified, i.e., the
candidate transition is only marked if it respects the
α and ε thresholds. The obtained segment clusters
correspond to the densest routes in the network. This
procedure is performed again for each time interval.
The dense routes are represented as a sequence of
segments, the same as with the trajectories. Each
segment is identified by an associated symbol.
Trans_sim (S
ij
, S
uv
)= |M(i,j) – M(j,k)| (1)
KDIR 2009 - International Conference on Knowledge Discovery and Information Retrieval
320
4 DENSE ROUTE EVOLUTION
This section presents our second algorithm called
DENSITYLINK corresponding to discovered links
between dense routes on successive periods of time.
Algorithm DENSITYLINK allows characterizing
the evolution of the dense road network. For
example, to reveal displacement, extension,
reduction, appearance or disappearance of density
zones along time. It is based on the dense routes
obtained by NETSCAN algorithm, presented in the
previous section. The algorithm builds a graph G
that binds the dense routes. Two routes are directly
linked in this graph if they share the same route in
the network at consecutive periods. Thus, it is
possible to find the origin of a density zone (in order
to avoid it, for example) or to know its effects in
order to predict the future density. Formally, we
define the evolution graph as a labeled graph
G(C,E,W) where C is the set of nodes, each node is
a dense route (i.e. a cluster of road sections). E is the
set of edges where E = (c, c’) means an evolution
link from c to c’. W is a set of labels w that
represents the evolution weight of edge E.
The algorithm takes as input the set of dense
routes distributed on the different time intervals.
This part will be used to follow the evolution of
these routes during time. It will then seek for each
dense route in a time interval it
n
those that are
similar in the interval it
n+1
. This similarity is based
on the Route_sim definition given in section 2. The
final result is a density graph where each node
represents a state of a dense route at a given time
interval and each transition represents the passage
from a time interval towards the following interval.
Each transition is labeled by two measurements
concerning the evolution. The first represents the
decrease percentage of road sections, compared to
the previous state and the second is the increase
percentage of road sections. These measurements
indicate the degree of change of a dense route:
extension, reduction, displacement or absence of
change.
5 TESTS AND VALIDATION
The experimentation uses synthetic trajectory data
simulated on real map of a road network, which
have thanks to the data generator of Brinkhoff
(Brinkhoff, 2002). Based on the road network of
San Joaquin (24123 segments of roads and 18496
nodes) and that of Oldenburg (7035 segments of
roads and 6105 nodes), we produced various data
files of moving objects trajectories to these two
roads networks. To show the various densities over
time we divided the whole time interval into five
partitions. We calculated the density matrices for
each data file and each time interval. More precisely,
in each matrix, we count the occurrences of the
moving objects crossing it to calculate the transition
M(i,j). The NETSCAN algorithm was implemented
and tested according to various configurations. We
varied the number of moving objects between 1000
and 10000 for each city network.
We notice that the number of transitions having
a dense traffic (a high value of transitions) is very
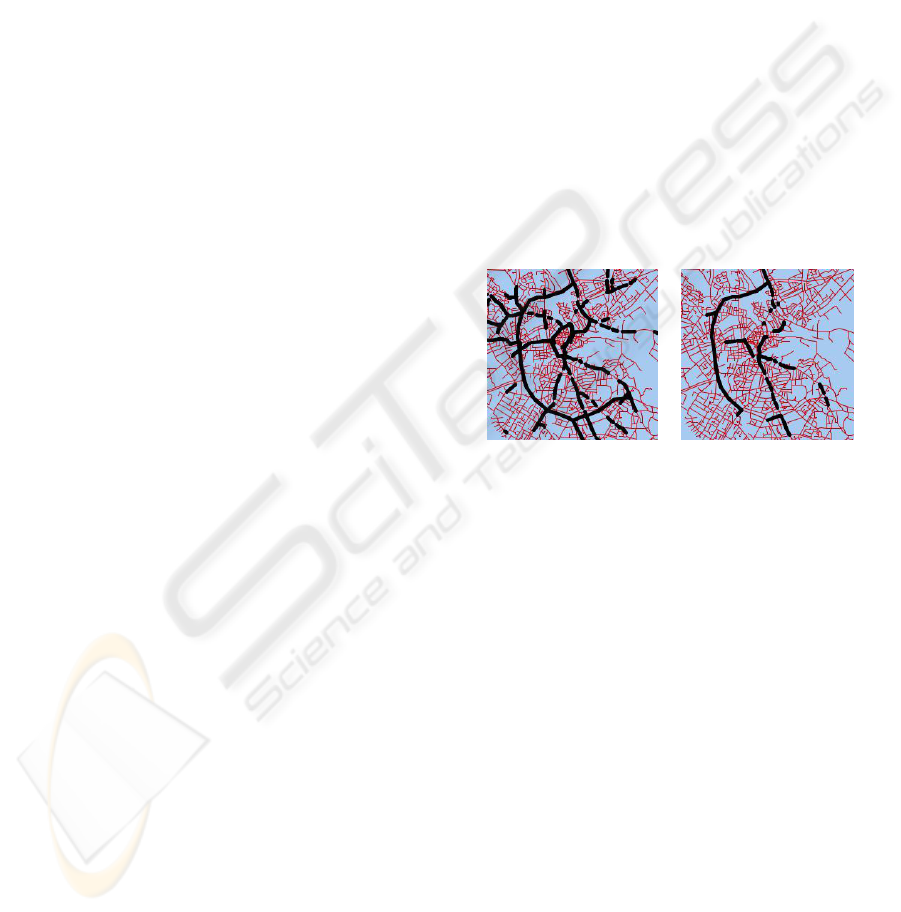
limited. Figure 1 shows the concentration of the
traffic road on the Oldenburg network for the first
and the last time intervals. The full number of
moving objects in this case is approximately 3500.
One can visually notice on the figure that the density
decreases while going from the first time interval to
the last one.
a – Time interval 1 e – Time interval 5
Figure 1: Density evolution on the Oldenburg network.
Generally, the density on the network is sensitive to
several criteria. First of all, the number of moving
objects on the network, then, the importance and the
shape of the network, we had to notice a difference
in density by taking the same number of moving
objects, but on two different networks. Indeed,
figure 2 shows that with 1000 trajectories, the
number of dense routes is completely different, in
Oldenburg city this number is 119 and in the San
Joaquin city this number is rather 55. Lastly, the
density also depends on the input parameters chosen
by the user, as shown in the figure 2b. The first
parameter α specifies the minimum required density
in a transition of a route and the second ε specifies
the maximum variation of density between
connected sections.
CHARACTERIZING THE TRAFFIC DENSITY AND ITS EVOLUTION THROUGH MOVING OBJECT
TRAJECTORIES
321
a – Impact of the network on the number of dense routes
b – Impact of parameter α on the number of dense routes
Figure 2: Sensitivity of the dense routes.
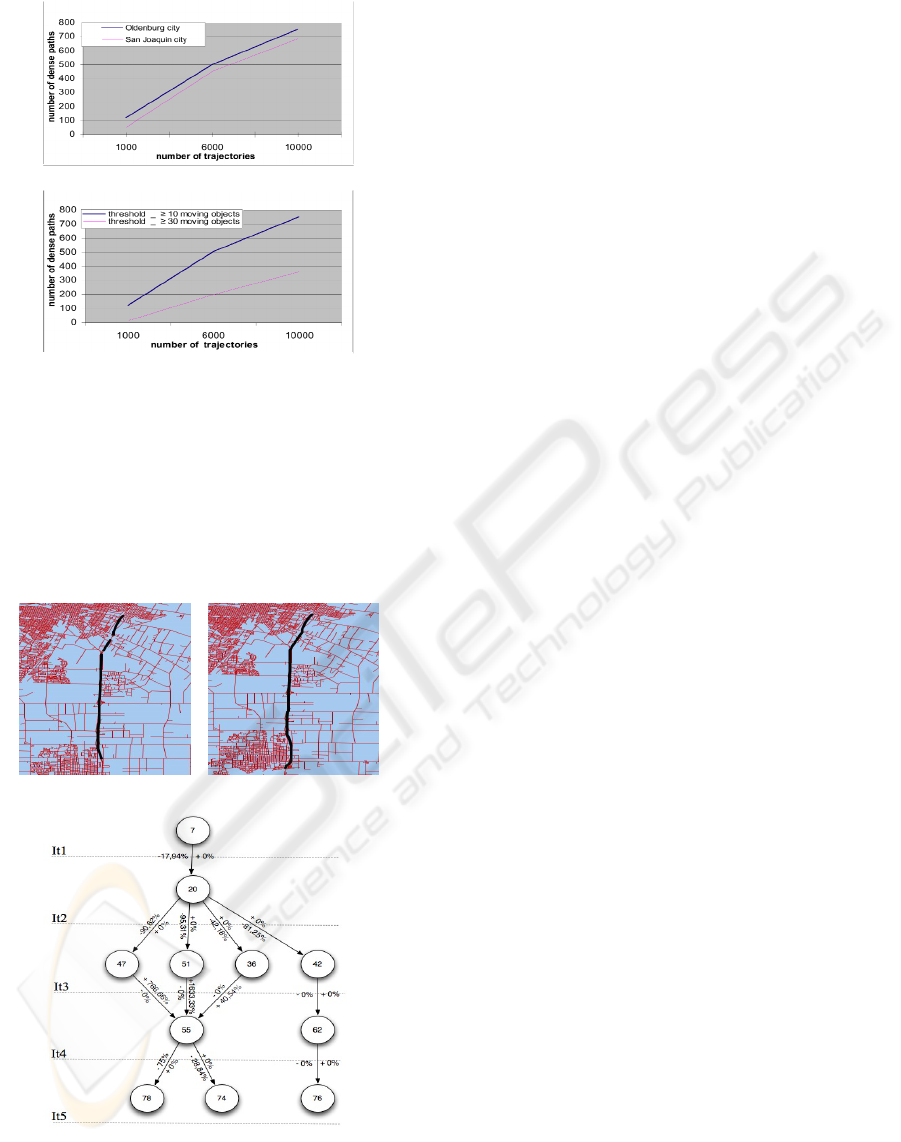
By using the same dataset for the two
algorithms, the obtained results in this
experimentation -represented in the form of graphs-
trace the evolution of a dense route through time.
Figure 3 shows the state of a part of the network San
Joaquin during the first (a) and the third (b) time
interval as well as the corresponding graph (c).
a- Time interval 1 b- Time interval 3
c- Evolution graph
Figure 3: Evolution graph starting from the dense route 7.
6 CONCLUSIONS
AND PERSPECTIVES
This paper proposes a new approach for
spatiotemporal data mining. More precisely, it
adapts the clustering density based technique to
network constraint moving objects and organizes the
clusters (dense routes) through a graph of temporal
evolution. This approach performs in two steps. The
first deals with the moving object statistics on the
road network and its topology in order to derive the
densest routes in predefined time intervals. The
second part compares the intersected dense routes in
order to organize them as a graph of density
evolution. In future, we will explore further analysis
of this graph, such as transitive closure to highlight
indirect impact of the density and its propagation in
the network over the whole day. Another issue is to
automatically partition data to relevant time
intervals, and to characterize the periodicity of the
density and its propagation.
REFERENCES
Brinkhoff T., A Framework for Generating Network-
Based Moving Objects, GeoInformatica, Vol. 6, No. 2,
Kluwer, 2002, pp. 153-180.
Du Mouza C. and P. Rigaux. Mobility Patterns. In Proc.
Intl. Workshop on Spatiotemporal Databases
(STDBM'04).
Ester M., H.-P. Kriegel, J. Sander and X. Xu (1996) A
Density-Based Algorithm for Discovering Clusters in
Large Spatial Databases with Noise. In Proc. 2
nd
Int'l
Conf. on Knowledge Discovery and Data Mining,
Portland, Oregon, pp. 226-231.
Lee J-G, J. Han and K-Y. Whang (2007) Trajectory
Clustering: A Partition-and-Group Framework. In
Proc. of SIGMOD'07, Beijing, China.
Kharrat A., K. Zeitouni, I. Sandu-Popa and S. Faiz (2008)
Clustering Algorithm for Network Constraint
Trajectories, In 13th International Symposium on
Spatial Data Handling, SDH, Montpellier, France, pp.
631-647.
Li X., Han J., Lee J. and Gonzalez H. (2007) Traffic
Density-Based Discovery of Hot Routes in Road
Networks. In Proc. of the 10th International
Symposium on Spatial and Temporal Databases
(SSTD), Boston, pp. 441-459.
Wan T. and Zeitouni K., An OLAP System for Network-
Constraint Moving Objects. In Proc. of the 22
nd
Annual ACM Symposium on Applied Computing
(SAC’07), Seoul, Korea, pp. 13-18.
KDIR 2009 - International Conference on Knowledge Discovery and Information Retrieval
322
