
USER SATISFACTION WITH SEARCH-DRIVEN ENTERPRISE
PORTALS
Ingunn Myrtveit
Norwegian School of Management, Nydalsveien 37, 0484 Oslo, Norway
Erik Stensrud
Det Norske Veritas Research & Innovation, Veritasveien 1, 1322 Høvik, Oslo, Norway
Keywords: User satisfaction, Enterprise search, Enterprise portals, Return on investment, Measurement instrument.
Abstract: Advances in new information technology have considerably changed the end user computer environment.
Therefore, it is appropriate to revalidate existing user satisfaction measurement instruments. Doll and
Torkzadeh (1988) developed an instrument that measured end user satisfaction with now 20-year old
information systems and which has been widely cited and used. This pilot study revalidates their
measurement instrument on a state-of-the-art, search-driven enterprise portal.
1 INTRODUCTION
There are huge, and increasing, investments in
information systems (IS) every year. However, more
than half of the software projects undertaken in the
United States fail, according to Standish Group,
wasting billions of dollars (Standish Group, 1995),
and we may assume that improving the success rate
of IS investments is therefore of vital interest to
organizations and society. It is not surprising, then,
that there is much research on topics like IS success.
However, what makes a software project
successful depends on your perspective. An IS has
many stakeholders, each with a different perspective
on IS success. From the end user’s perspective, a
successful system may be one that the user perceives
makes his job more fun and more efficient. The
software manager may feel successful when he
delivers the project on time and within budget. From
the purchaser’s or investor’s perspective, a
successful IS is one that contributes a positive return
on investment (ROI).
Our perspective is the investor’s perspective. We
would ideally like to measure ROI, that is, evaluate
IS based on its contribution to productivity
increases, revenue increases, cost reductions, and
improved decision making. However, this is
generally not feasible, and therefore surrogate
measures like end-user satisfaction must be used
(Doll and Torkzadeh, 1988).
User satisfaction is generally regarded as one of
the most important measures of IS success. There
has been considerable research devoted to
establishing a standard user satisfaction instrument
since the 1980s (e.g. Ives et al., 1983; Bailey and
Pearson, 1983; Baroudi et al., 1986; Benson, 1983),
when data computing in organizations moved from
data processing to end-user computing (EUC) (Doll
and Torkzadeh, 1988). Doll and Torkzadeh (1988)
developed and validated an End-User Computing
Satisfaction (EUCS) instrument. It included five
components: content, accuracy, format, ease of use,
and timeliness.
Since the development of the EUCS instrument,
there have been significant changes in information
technology, especially with the soaring growth of
the Internet and search technologies like Google®.
Internet search applications, exemplified by
Google® and Yahoo®, have undisputedly added
significant value to users in their quest for
information on the web. More recently, in
businesses, we see similar significant changes in
information technology like the emergence of
corporate systems that are enhanced by enterprise
search components. Businesses hope that enterprise
search will do for the business what web search has
37
Myrtveit I. and Stensrud E. (2009).
USER SATISFACTION WITH SEARCH-DRIVEN ENTERPRISE PORTALS.
In Proceedings of the 4th International Conference on Software and Data Technologies, pages 37-42
DOI: 10.5220/0002253200370042
Copyright
c
SciTePress

done for the web community. It is, however, still in
its early stages, but, looking to the web, it might
become an important technology for businesses, too.
In 2007, the search and discovery software market
reached more than $1.7 billion, a growth rate of
23.4%, and expecting to reach $3.1 billion in 2012
(IDC, 2008). Therefore, it is of interest to be able to
assess the user satisfaction of these new, enhanced-
by-search corporate systems by ensuring valid and
reliable measuring instruments.
Information is an important business asset and
making effective use of it is central to business
success (Ball and Harris, 1982; Brancheau et al.,
1987 and 1996; Niederman et al., 1991). Much
business information is unstructured data (e.g.
emails and documents). A widely touted IT factoid
states that unstructured data account for 80% of the
total information (Kuechler, 2007). The amount of
information is large and growing at a fast rate.
Information workers need seamless access to
information scattered across corporate systems as
well as the Web, and they need access to structured
as well as unstructured information. In order for
individuals to make the best business decisions,
deliver the greatest business impact, and be as
productive as possible, they must be able to find,
use, and share relevant business information quickly,
easily, and securely. Therefore, they do not just need
access but also aid in retrieving what is relevant
information.
We see a trend that corporate information
systems are adapting the best from web information
systems and deviating more and more from the
traditionally corporate information systems. The
differences we observe between traditional corporate
systems (TCS) and new corporate systems like
search-driven enterprise portals (SDEP) are several.
For example:
• TCS access information from one repository;
SDEP access information across repositories.
Thus, SDEP offers to juxtapose and compare
information and could be a better analytics tool
rather than just a portal.
• TCS mainly access structured data; SDEP
access structured as well as unstructured data.
SDEP provide the ability to intelligently and
dynamically, access, retrieve and analyze
information in real time, regardless of data
format, structure or location, e.g. email
archives, file servers with documents, and
presentations and databases.
• One output of TCS is traditional, static reports;
In SDEP, the concept of a report seems to
vanish at the expense of more ad hoc queries.
• TCS user interface mostly have static menu
structures with predefined categories; SDEP
offer dynamic menu structures where the
categories are created based on analysis of the
information content presented to the user
• The result sets in TCS small and often not
ranked; The result sets in SDEP are large and
therefore ranked and organized in logic way
before presented to the user
• TCS technology gave the users limited
possibilities to customize the user interface.
SDEA systems have put more and more
capabilities and power at the disposal of the
user, i.e. the systems opens for customizing of
individual user interfaces.
• TCS is isolated to one system; SDEP is
enterprise wide and integrated.
Because of these differences between TCS and
SDEP, and because the EUCS instrument was
developed to measure user satisfaction with TCS, it
is not appropriate to adopt the EUCS instrument to
measure user satisfaction without first examining the
validity and reliability of the instrument in the SDEP
context.
The rest of the paper is organized as follows.
Section 2 gives an overview of related work. Section
3 presents the data. Section 4 describes the research
method. Section 5 presents the results, and Section 6
discusses and proposes areas for further work.
2 LITERATURE REVIEW
User satisfaction has received attention in the
research literature since the 1980s. Much research
has concentrated on finding a valid measure for user
satisfaction. Among this research, Bailey and
Pearson (1983) developed a semantic differential
instrument, with 39 items measuring overall
computer user satisfaction. This was later revised by
Ives et. al., (1983) to a 13-item instrument. These
two instruments measure a combination of
satisfaction with the system as well as with the
services from the EDP staff. Baroudi et al. (1986)
and Benson (1983) also published user satisfaction
studies. Based on the instrument of Ives et al., Doll
and Torkzadeh (1988) therefore developed a 12-item
instrument, designed to measure the end-user
satisfaction with a specific application. It consisted
of five factors: information content, accuracy,
format, ease of use, and timeliness. It was later
confirmed to be valid and reliable as a standardized
measure of user satisfaction with a specific
application (Doll et al., 1994). Xiao and Dasgupta
ICSOFT 2009 - 4th International Conference on Software and Data Technologies
38

(2002) studied user satisfaction with web-based IS
and validated the instrument of Doll and Torkzadeh.
They found that with minor revisions the instrument
is still valid. The End User Computer Satisfaction,
EUCS, instrument developed by Doll and Torkzadeh
is still among the most used and cited instruments.
Doll and Torkzadeh’s 12-item EUCS instrument
comprised of 5 factors/components: content,
accuracy, format, ease of use, and timeliness. Ease
of use was not included in previous studies. Two
global measures of perceived overall satisfaction and
success were added to serve as criterion. The
construct was developed with five point Likert-type
scale (1=almost never, 2=some of the time, 3= about
half of the time, 4= most of the time and 5= almost
always). The two global factors were “Is the system
successful?” and “Are you satisfied with the
system?”
This research is based on the EUCS instrument
by Doll and Torkzadeh because it is a widely used
instrument, and has been validated through several
confirmatory analyses and construct validity tests.
After the exploratory study was completed in 1988,
two confirmatory studies with different samples
were conducted respectively in 1994 and 1997,
which suggested the instrument was valid (Doll et
al., 1994; Doll and Xia, 1997). A test-retest of
reliability of the instrument was conducted in 1991,
indicating the instrument was reliable over time
(Torkzadeh and Doll, 1991). The instrument is
widely accepted and adopted by other researchers.
McHaney and Cronan (1998, 2000) adopted it to
examining computer simulation success. McHaney
et al. (1999) adopted it in decision support systems
research. Chen et al. (2000) applied it to measure
user satisfaction with data warehouse and Xiao and
Dasgupta (2002) applied it to web-based information
systems.
3 DATA AND DATA
COLLECTION
We conducted a pilot study of an SDEP in a
multinational consulting company using their
employees as subjects and having them evaluate the
company’s internal enterprise portal which is an
SDEP. The questionnaire was the Doll and
Torkzadeh 12-item instrument (see Appendix). Data
were collected by distributing email with the
questionnaire implemented in the online tool
Confirmit. The questionnaire was distributed to all
the employees in the Norwegian branch (approx.
70). The response rate was approx. 50 %. As we
want to validate the Doll and Torkzadeh instrument,
we used the original, 12-item version of the
questionnaire. However, we introduced one new
feature as we gave the respondents the option to
answer N/A to each question. Also, we collected
data for the age and work category of respondents:
sales, administration, infrastructure consulting and
development consulting. The reason for making
these groups is that we hypothesize that the groups
use the portal for different purposes. For example,
infrastructure consultants are typically searching for
a general term or idea whereas programmers are
searching for code snippets or something very
specific such as an error code.
We found that development consulting
respondents were most likely to answer immediately
whereas the other groups seemed to hesitate. After a
second appeal, we ended up with equal response
from development and infrastructure consultants –
but no response from sales, and only two responses
from the administration. The average age was 32
years, spanning from 25 to 49.
4 METHOD
A literature review was conducted on related topics.
We found that the Doll and Torkzadeh instrument is
still among the most widely used and cited
instruments (with more than 700 citations on Scholar
Google). We want to examine whether the Doll and
Torkzadeh instrument is still valid for new
technologies like SDEP, or if it has to be revised. As
a first step, this pilot study replicates their original
research methodology with minor adjustments.
We applied the concepts and procedures
introduced by Doll and Torkzadeh, and which seem
to have been the custom in this stream of research.
Doll and Torkzadeh applied exploratory factor
analysis both to assess the construct validity of the
measure and to determine the underlying factors of
end-user satisfaction. However, this has not
generally been applied to the pilot studies as factor
analysis generally requires four to five times as
many observations as there are items to be studied.
(There is some disagreement regarding this ratio.)
Therefore, in this study, we copied previous studies
and mainly examined construct validity with
correlations between the total score and each item
score. In addition, we performed a factor analysis,
but due to the low number of observations the latter
results must be treated with caution.
USER SATISFACTION WITH SEARCH-DRIVEN ENTERPRISE PORTALS
39
Two global items of end-user satisfaction with
the SDEP were included in the survey. Thus, the
extent to which each item correlates with the global
items is indicative of its criterion-related validity.
The two-item global criterion were “Is the enterprise
portal successful?” and “Are you satisfied with the
enterprise portal?” (see Appendix). Correlation
between the overall user satisfaction and individual
item scores were calculated using Pearson’s
correlation coefficient.
Following Doll and Torkzadeh’s procedure, we
examined the correlation of score of each item with
the total score of all items. To avoid the spurious
part-whole correlation, we subtracted each item
score from the total score before conducting the
correlation. Therefore, we conducted correlation of
each item with the total of rest 11 items.
5 RESULTS
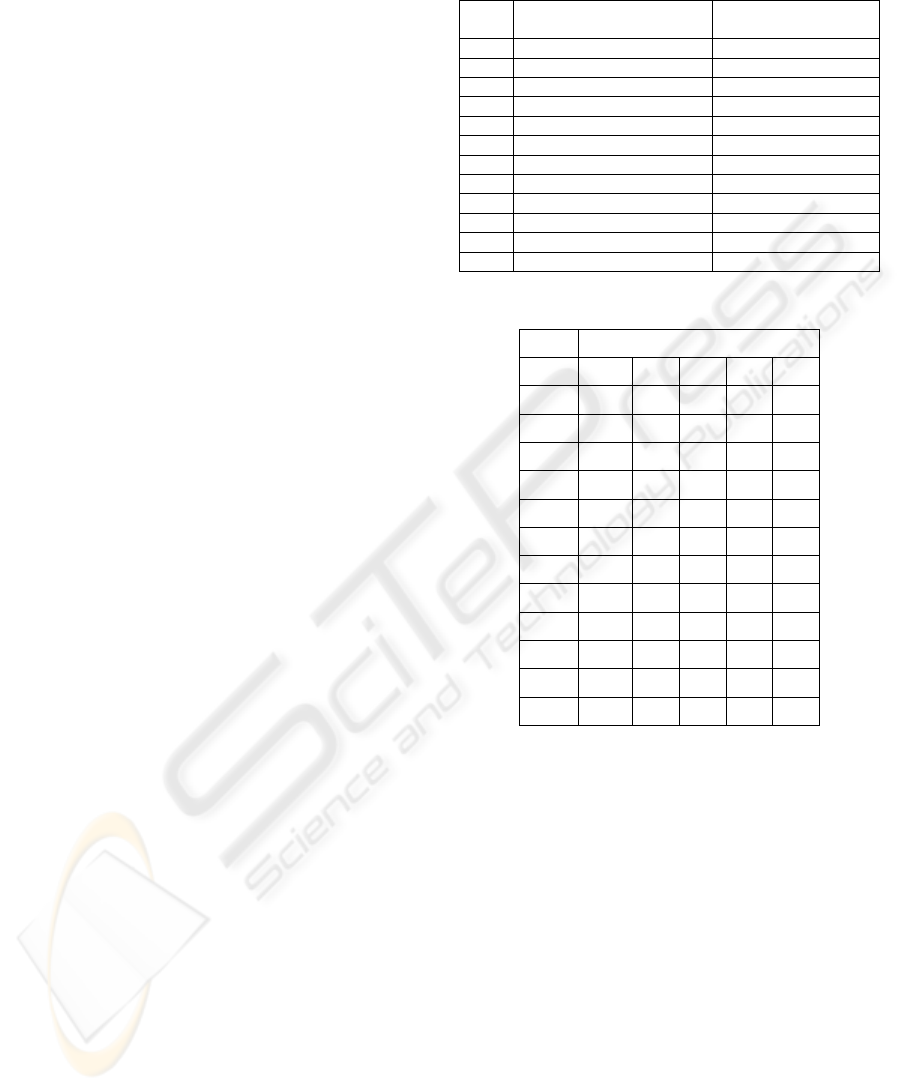
Table 1, column 2, presents the results of the
correlation assessment. According to Doll and
Torkzadeh, there is no accepted standard of cutoff
threshold, therefore they suggested (and it seems to
have become the custom in later studies) a cutoff
value of 0.5. All items are above the threshold of
0.5, except for the item F1 (“Do you think the output
is presented in a useful format?”) which is just
below.
In conducting the criterion-related validity
analysis, we examined the correlation of each item
with the score of the global satisfaction criteria G1
and G2 (items 13 and 14). As G1 and G2 were very
highly correlated, we only used one measure. As
Doll and Torkzadeh, we assume these measures to
be valid. Table 1, column 3, shows the results. The
cutoff threshold is 0.4 as in Doll and Torkzadeh. All
values were above the threshold except E2, which
was just below. Therefore all items are valid –
except maybe E2 (“Is the enterprise portal easy to
use?”) which could be reconsidered.
We did a factor analysis despite the low number
of observations. Principal Component Analysis was
used as the extraction technique and varimax was
used as the method of rotation. Without specifying
the number of factors, three factors emerged.
However, to be in line with Doll and Torkzadeh, we
forced the analysis to have five factors
(components). We used a threshold of approximately
0.7 for factor loading criterion.
Table 1: Reliability and Criterion-Related Validity of
Measures of End-User Satisfaction.
Item Corrected Item-Total
Correlation
Correlation with
Criterion
C1 0.724 0.856
C2 0.727 0.727
C3 0.518 0.585
C4 0.846 0.880
A1 0.587 0.611
A2 0.540 0.676
F1 0.472 0.414
F2 0.694 0.526
E1 0.548 0.457
E2 0.538 0.385
T1 0.710 0.574
T2 0.543 0.479
Table 2: Rotated Component Matrix(a).
Component
1 2 3 4 5
C1
.709
C2
.695*
C3
.931
C4
.690*
A1
.794
A2
.931
F1
.938
F2
.708
E1
.713
E1
.890
T1
.757
T2
.917
Extraction Method: Principal Component Analysis.
Rotation Method: Varimax with Kaiser Normalization.
a. Rotation converged in 7 iterations.
The result is presented in Table 2. We observe
that some results are similar to Doll and Torkzadeh,
but not all. “Timeliness” and “Format” seem to fit
with previous results, but it is hard to distinguish, for
example, between “Content” and Accuracy”.
However, due to the low number of observations in
this pilot study, we do not place much confidence in
these results.
6 DISCUSSION AND FURTHER
WORK
As stated in the Introduction, we would ideally like
to measure the return on investment (ROI) but
resorted to end-user satisfaction as a surrogate
ICSOFT 2009 - 4th International Conference on Software and Data Technologies
40

measure. In this pilot study, we have taken a first,
small step to investigate whether the End-User
Computer Satisfaction (EUCS) instrument
developed by Doll and Torkzadeh is still valid for
new technologies like search-driven enterprise
portals (SDEP). We found that the validity of the
instrument cannot be rejected. However, we have
become more skeptical regarding its use as a valid
surrogate measure of ROI. In addition, the
respondents commented that some of the factors
were unclear, in particular “Accuracy”.
Therefore, we now believe that user satisfaction
instruments may add more value when used to
gather user feedback for the purpose of improving
the IS, rather than as a surrogate measure for ROI. In
this case, other, more elaborate instruments must be
considered. An IS like an enterprise portal consists
of the quality of the system (delivered by the system
provider), and of the quality of the information
(delivered by the content provider, end-users
themselves, etc.). The perceived success depends on
both system and information quality. Therefore, to
enhance the success of the portal, we need to know
whether it is the system or the information that needs
to be improved. The EUCS instrument by Doll and
Torkzadeh does not make this distinction.
However, others, like DeLone and McLean
(1992, 2003) make an explicit distinction between
information quality (IQ) and system quality (SQ).
They argue that IS success is a multidimensional and
interdependent construct, where IQ and SQ are
antecedents of user satisfaction and use. A similar
separation is very common in marketing where
attribute satisfaction and information satisfaction are
antecedents of satisfaction. See e.g. Spreng et al.,
(1996).
While distinguishing between IQ and SQ may
not be widespread in empirical IS studies, such a
distinction is clearly very relevant for an enterprise
portal study as we may separate the content from the
content-delivery system. McKinney et al. (2002) did
a study of web-customer satisfaction. They
combined the perspectives from the user satisfaction
literature in IS and the customer satisfaction
literature in marketing and identified nine key
constructs for analyzing web-customer satisfaction.
Based on IS literature, they argue that measuring
web-customer satisfaction for information quality
and system quality provides insight about a
customer’s overall satisfaction with a web site. In
addition, they synthesize this with the expectation-
disconfirmation paradigm from marketing literature.
Web-user satisfaction is affected by their prior
expectations (formed by their prior experiences and
exposure to vendor’s marketing efforts), possible
discrepancies (e.g. disconfirmation) between such
expectations, and the perceived performance of the
web site.
Inspired by this work and input from behavioral
economics, Cheung and Lee (2005) studied the
satisfaction with an e-portal. Behavioral economics
claim that negative performance has a greater impact
on satisfaction than positive performance. They
examine the asymmetrical effects of negative and
positive web site attribute performance on
satisfaction. Their empirical findings are
inconclusive, but we regard the model as relevant for
future research.
Regarding future research, we find it relevant to
distinguish between SQ and IQ as the feedback from
users must be provided to software providers and
information providers, respectively. Thus, we want
to investigate DeLone and McLean’s model in this
respect. Furthermore, it will be very relevant to
investigate whether negative performance on one or
more factors influence user satisfaction dramatically
– or vice versa.
REFERENCES
Bailey, J.E. and Pearson, S.W. (1983) “Development of a
Tool for Measuring and Analyzing Computer User
Satisfaction”. Management Science, 29( 5), 530-545.
Ball, L. and Harris R. (1982) “SMIS members: a
membership analysis”. MIS Quarterly, 6(1), 19-38.
Baroudi, J. J., Olson, M. H. and Ives, B. (1986) “An
Empirical Study of the Impact of User Involvement on
System Usage and and Information Satisfaction,”
CACM, 29(3), 232-238.
Benson, D.H. (1983) “A Field Study of End-User
Computing: Findings and Issues” MIS Quarterly, 7(4),
35-45.
Brancheau, J.C., B.D. Janz, J.C. Wetherbe, (1996) “Key
issues in information systems: 1994-95 SIM Delphi
results” MIS Quarterly, 225-241.
Brancheau, J.C. and J.C. Wetherbe (1987) “Key issues in
information systems management” MIS Quarterly,
11(1), 23-45.
Chen, L., Soliman, K.S., Mao, E. and M.N. Frolick,
(2000) “Measuring User Satisfaction with Data
Warehouses: An Exploratory Study”, Information &
Management, 37, 103-110.
Cheung, C.M.K. and Lee, M.K.O. (2005) “The
Asymmetric Effect of Web Site Attribute Performance
on Web Satisfaction: An Empirical Study”, e-Service
Journal , Indiana University Press.
DeLone, W.H. and McLean E.R. (1992) “Information
System Success: The quest for the dependent
variable”, Information Systems Research , 3, 1, 60-95.
USER SATISFACTION WITH SEARCH-DRIVEN ENTERPRISE PORTALS
41

DeLone, W.H. and McLean E.R.(2003) “ The DeLone and
McLean Model of Information Systems Success: A
Ten-Year Update”, Journal of Management
Information Systems, 19, 4, 9-30 .
Doll, W. J. and Torkzadeh, G. (1988) “The Measurement
of End-User Computing Satisfaction”. MIS Quarterly,
12(2), 259-274.
Doll, W. J., Xia, W. and Torkzadeh, G. (1994) “A
Confirmatory Factor Analysis of the End-User
Computing Satisfaction Instrument”, MIS Quarterly,
453-461.
Ives, B., Olson, M. H. and Baroudi, J. J. (1983) “The
Measurement of User Information Satisfaction”.
CACM, 26 (10), 785-793.
Kuechler, W.L. (2007) “Business Applications of
Unstructured Text”, CACM, 50(10), 86-93.
McHaney, R. and Cronan, T.P. (1998) ”Computer
Simulation Success: On the Use of the End-User
Computing Satisfaction Instrument: A Comment”.
Decision Sciences, 29(2), 525-536.
McHaney, R. and Cronan, T.P. (2000) “Toward an
empirical understanding of computer simulation
implementation success”. Information and
Management, 37, 135-151.
McHaney, R. Hightower, R. and White D. (1999) “EUCS
test-retest reliability in representational model decision
support systems”, Information and Management, 36,
109-119.
McKinney, V, Yoon, K., Zahedi, F.M.(2002), “The
Measurement of Web-Customer Satisfaction: An
Expectation and Disconfirmation Approach”,
Information Systems Research , 13,3, 296-315.
Niederman, F., J.C. Brancheau, J.C. Wetherbe (1991)
“Information systems management issues in the
1990s”, MIS Quarterly, 15(4), 474-499.
Spreng, R.A., MacKenzie, S.B., and Olshavsky, R.W.
(1996), A reexamination of the determinants of
consumer satisfaction, Journal of Marketing, 60(3),
15-32.
Standish Group (1995), Chaos, Standish Group Report,
http://www.standishgroup.com/
Torkzadeh, G. and Doll, W. (1991) “Test-Retest
Reliability of the End-User Computing Satisfaction
Instrument”, Decision Sciences, 22(1), 26-37.
Xiao, L. and Dasgupta, S., (2002) “Measurement of User
Satisfaction with Web-based Information Systems: An
Empirical Study”, Eight Americas Conference on
Information Systems, 1149-1155.
APPENDIX: THE EUCS
MEASUREMENT INSTRUMENT
C1. Does the enterprise portal provide the precise
information you need?
C2. Does the information content meet your
needs?
C3. Does the enterprise portal provide reports
that seem to be just about exactly what you need?
C4. Does the enterprise portal provide sufficient
information?
A1. Is the enterprise portal accurate?
A2. Are you satisfied with the accuracy of the
enterprise portal?
F1. Do you think the output is presented in a
useful format?
F2. Is the information clear?
E1. Is the enterprise portal user friendly?
E2. Is the enterprise portal easy to use?
T1. Do you get the information you need in
time?
T2. Does the enterprise portal provide up-to-date
information?
G1. Is the enterprise portal successful?
G2. Are you satisfied with the enterprise portal?
ICSOFT 2009 - 4th International Conference on Software and Data Technologies
42
