
A TRAFFIC COHERENCE ANALYSIS MODEL
FOR DDOS ATTACK DETECTION
Hamza Rahmani, Nabil Sahli and Farouk Kammoun
CRISTAL Lab., National School for Computer Sciences, University campus Manouba,2010 Manouba, Tunisia
Keywords: Distributed denial of service, Probability distribution, Joint probability, Stochastic process, Central limit
theorem.
Abstract: Distributed Denial of Service (DDoS) attack is a critical threat to the Internet by severely degrading its
performance. DDoS attack can be considered a system anomaly or misuse from which abnormal behaviour
is imposed on network traffic. Network traffic characterization with behaviour modelling could be a good
indication of attack detection witch can be performed via abnormal behaviour identification. In this paper,
we will focus on the design and evaluation of the statistically automated attack detection. Our key idea is
that contrary to DDoS traffic, flash crowd is characterized by a large increase not only in the number of
packets but also in the number of IP connexions. The joint probability between the packet arrival process
and the number of IP connexions process presents a good estimation of the degree of coherence between
these two processes. Statistical distances between an observation and a reference time windows are
computed for joint probability values. We show and illustrate that anomalously large values observed on
these distances betray major changes in the statistics of Internet time series and correspond to the
occurrences of illegitimate anomalies.
1 INTRODUCTION
Distributed Denial of Service attacks, which aim at
overwhelming a target server with an immense
volume of useless traffic from distributed and
coordinated attack sources, are a major threat to the
stability of the Internet (D. Dittrich). But, for four
reasons, it is difficult to detect an ongoing DDoS
attack: Firstly, because a DDoS attack has to be
detected on-line, there is little time to detect and
confirm an ongoing DDoS attack. Normally the
system administrators or security experts have to
ascertain the attacks or trace back the attackers in
less than one hour. Secondly, some Internet worms’
propagation may also directly result in DDoS, which
makes DDoS detection much more complex.
Thirdly, normal defence measures such as rate-
limiting, packet-filtering, tweaking software
parameters or equipping more servers are all useful
but limited in their capabilities. Finally, the exact
distinction between DDoS attacks and flash crowds
remains an open issue. It is essential that we be able
to detect DDoS attacks fast, accurately and in real
time. DDoS attacks exhaust host resources or the
network bandwidth. It is consequently important to
detect resource usage changes and reduce the
detection time. Such abnormal changes could be
detected statistically. For example, the entropy
method in (L. Feinstein, D. Schnackenberg, 2003)
uses frequency-sorted distributions of selected
packet attributes in a time window to compute
entropy and use the entropy changes to indicate the
anomalies. (C. Manikopoulos, S. Papavassiliou,
2002) Demonstrates how Aderson-Darling statistical
method is used to detect network traffic changes.
The adaptive sequential and batch sequential
methods in (R. B. Blazek et al., 2002) employ
statistical analysis of data from multiple layers of
network protocols to detect very subtle traffic
changes. On the other hand, recent results obtained
in modelling by different projects of metrology have
however allowed envisaging new intrusion detection
strategies. Even if still in the course of development,
the published results using statistical characteristics
are nevertheless very interesting. Hence, for
example, Ye proposed a Markovian model for the
temporal behaviour of the traffic (N. Ye, 2000) and
generating alarms when the traffic gets significantly
distant from the model. Other authors (J. Yuan and
K. Mills, 2004) showed that DoS attacks augment
148
Rahmani H., Sahli N. and Kamoun F. (2009).
A TRAFFIC COHERENCE ANALYSIS MODEL FOR DDOS ATTACK DETECTION.
In Proceedings of the International Conference on Security and Cryptography, pages 148-154
DOI: 10.5220/0002231901480154
Copyright
c
SciTePress

the correlation in the traffic; which may represent a
robust detection technique. Hussain et al. use the
spectral power density to identify the signatures for
different attacks (A. Hussain et al., 2003). Li and
Lee used wavelet-based system to calculate energy
distribution. They noticed that this distribution
presents peaks in the traffic which contains attacks
that do not exist in regular traffic (L. Li et G. Lee,
2003). Finally, A. Scherrer et al. proposed a
detection approach based on a non Gaussian and
multiresolution traffic modelling (A. Scherrer et al.,
2007). Anomalously large values observed on
calculated distances correspond to the occurrences
of illegitimate anomalies such as DDoS attacks.
The method proposed in this paper is also a
statistics-based method that utilizes traffic modelling
for DoS/DDoS detection. We aim at analyzing the
impact of anomalies on the statistical traffic
characteristics and to bring to evidence the traffic
characteristic signals containing legitimate and
illegitimate anomalies. We propose a bi-level study
of Internet traffic based on the couple packet IP,
address IP. By measuring the degree of coherence
between the number of packets and the number of IP
connexions first obtained in regular traffic, then in
traffics presenting a large variety of anomalies
including mainly legitimate anomalies, we can
differentiate traffic changes caused by legitimate
actions or by illegitimate actions. It will be shown
that the evolution of the estimated model’s
parameters allow to differentiate the traffic with or
without anomalies which minimises false alarms.
Other, our proposal does need to inspect only the
source IP address fields of each packet. This makes
it simpler and more practical for real-time
implementation.
The remainder of this paper is organized as
follows. Section 2 presents the real traffic traces
used in this work. Section 3 illustrates the theoretical
basis of a traffic coherence analysis model for DoS
detection. In section 4 we propose a stochastic
modelling of Internet traffic used to calculate the
degree of coherence. Section 5 discusses the
performance of our proposal. Finally concluding
remarks and future work are presented in Section 6.
2 CAIDA DATA COLLECTION
It is very hard to obtain anomaly-causing data
mainly when these flows are sensible and
susceptible to be used in real attacks as is the case
with DoS attack. The most part of works dealing
with DoS attacks use flows realized in laboratories
by means of traffic generator or by DDoS tools.
All along this work, we used a variety of real
Internet traffic traces collected in 2007. The DDoS
traces are issued from “The CAIDA Backscatter-
2007 Dataset” (https://data.caida.org/datasets/secu-
rity/backscatter-2007/). This collection groups the
backscatter datasets that were created from the
massive amount of data continuously collected from
the UCSD Network Telescope. These backscatter
datasets contain traces with packet headers for
unsolicited TCP and ICMP response packets sent by
denial-of-service attack victims. When a denial-of-
service-attack victim receives attack traffic with
spoofed source IP addresses, the attack victim
cannot differentiate between this spoofed traffic and
legitimate requests, so the victim replies to the
spoofed source IP addresses. These spoofed IP
addresses were not the actual sources of the attack
traffic, so they receive responses to traffic they never
sent. By measuring this backscatter response traffic
to a large portion of IP addresses (in our case,
roughly a /8 network), it is possible to estimate a
lower bound for the overall volume of spoofed
source denial-of-service attacks occurring on the
Internet. The normal traffic traces are issued from
“The CAIDA Anonymized 2007 Internet Traces
Dataset” (https://data.caida.org/datasets/passive-
2008/) This dataset contains anonymized passive
traffic traces from CAIDA's AMPATH monitor on
an OC12 link at the AMPATH Internet Exchange
during the DITL 2007 measurement event. Figure1
shows examples of network packet arrival process
for legitimate and illegitimate traffics. We can notice
a great variance in the aggregate traffic in
accordance with time. In figure (b), we signal an
important augmentation in the number of packets.
This is legitimate and is caused by a strong
augmentation in the number of IP connexions.
However, in the figure1 (c) the large scale
augmentation is illegitimate and is caused by DoS
attack using one sole zombie. The peak at the second
6500 corresponds to the appearance of a second
zombie.
3 DETECTION SYSTEM
Our detection system is based on the following
hypothesis: a permanent large scale augmentation in
the number of packets received by a network is the
consequence of the augmentation in the number of
IP connexions. An IP connexion corresponds to an
A TRAFFIC COHERENCE ANALYSIS MODEL FOR DDOS ATTACK DETECTION
149
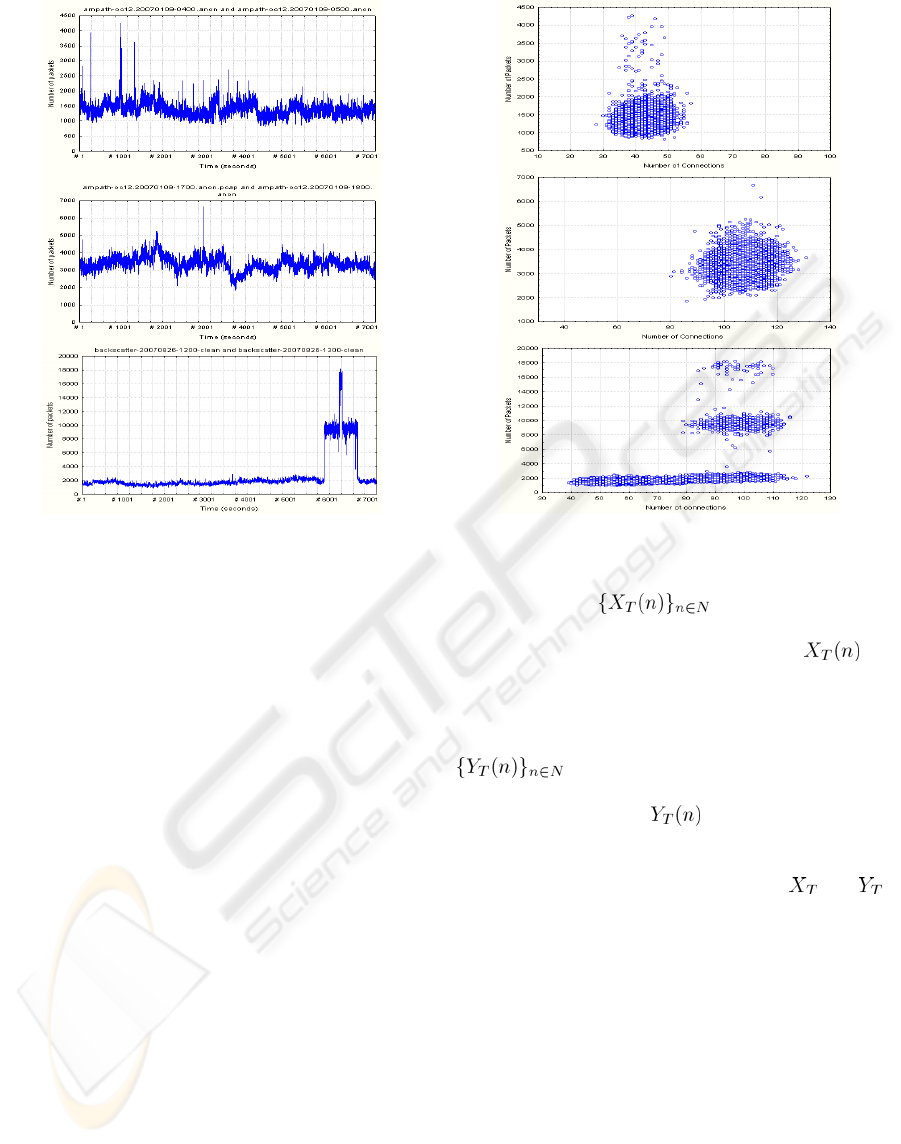
Figure 1: Packet arrival process for (a) normal traffic (b)
legitimate traffic at large scale (c) DoS traffic.
IP traffic exchanged between two IP addresses
during a period of time T. Knowing the objective of
attackers to saturate as soon as possible the
resources of the target, this would engender a
disproportion between the number of received
packets and the number of IP connexions. However,
in the case of flash crowd, the augmentation of the
number of packets is always accompanied by an
augmentation in the number of IP connexions. In
this situation the flow keeps coherence between the
aggregated debit and the number of IP connexions.
The main goal of this work is to detect in real time a
DDoS attack by measuring the degree of coherence
between the total number of packets received by the
network and the number of IP connexions. This task
subdivides into three main parts:
to study the network characteristics by
generating the histogram of the number of
packets sent by one sole IP address during a
time interval T
;
Integrate the result in a statistical model
allowing to measure the degree of coherence
between the number of IP connexions and the
received traffic volume
;
U
se a statistical distance to calculate the
divergence between the traffic target and a
normal traffic prototype
.
Figure 2: Scatterplot graph for (a) normal traffic (b)
legitimate traffic at large scale (c) DoS traffic.
We define as the stochastic
process of the number of IP connexions in
successive time windows of the size T.
is
then the random variable that defines the number of
IP addresses that transmitted at least one packet to
the target network and the instant of arrival which is
comprised between nT and (n+1)T. We also define
as the stochastic process of the
number of packets transmitted in the successive time
windows of the size T.
is then the number of
packets whose arrival instant is contained between
nT and (n+1)T. In this paragraph, we try to establish
a type of relation linking the time series
and
for different types of traffic (regular, DDoS and
flash crowd). Given that the aggregated flow of the
Internet traffic is very variable (the variance being
very often superior to the mean), it is very difficult
to establish a simple relationship (linear,
quadratic…) between these scales. To study this
relation, we used scatterplot graphics. The x-axis
indicates the number of IP addresses and the y-axis
indicates the number of IP packets. Figure2 (a) and
figure2 (b) show that during normal traffic the
scatterplot stretches on a compact sphere
representing the field of coherence. This is not the
case in the presence of DDoS attacks and the figures
(c) show clearly that the scatterplot is divided into
spheres corresponding respectively to the normal
SECRYPT 2009 - International Conference on Security and Cryptography
150
traffic and to DDoS traffics. The first sphere
represents the coherence domain while the other
spheres correspond to different levels of attack. The
more the attack is strong, the more the spheres are
distanced from the domain of coherence. These
different distances translate a disproportion that is
growing between the processes
and .
To quantify statistically the degree of coherence,
we used the joint density of probability between
processes
and . That is the probability so
that x IP addresses transmit to the target link y IP
packets within the time interval T:
(1)
To calculate
we proceed as follows. We
first define
as the stochastic process
of the number of packets received by various IP
address during time window of the size T. Thus WT
(n) is random variable of the number of IP packets
that were transmitted by the nth IP address during
time window of the size T. YT is therefore the
aggregation of the XT process of the type WT. The
time series
, and
are then related by the
following relation:
(2)
The random variables
are independent
identically distributed (IID). The equation (1) turns:
(3)
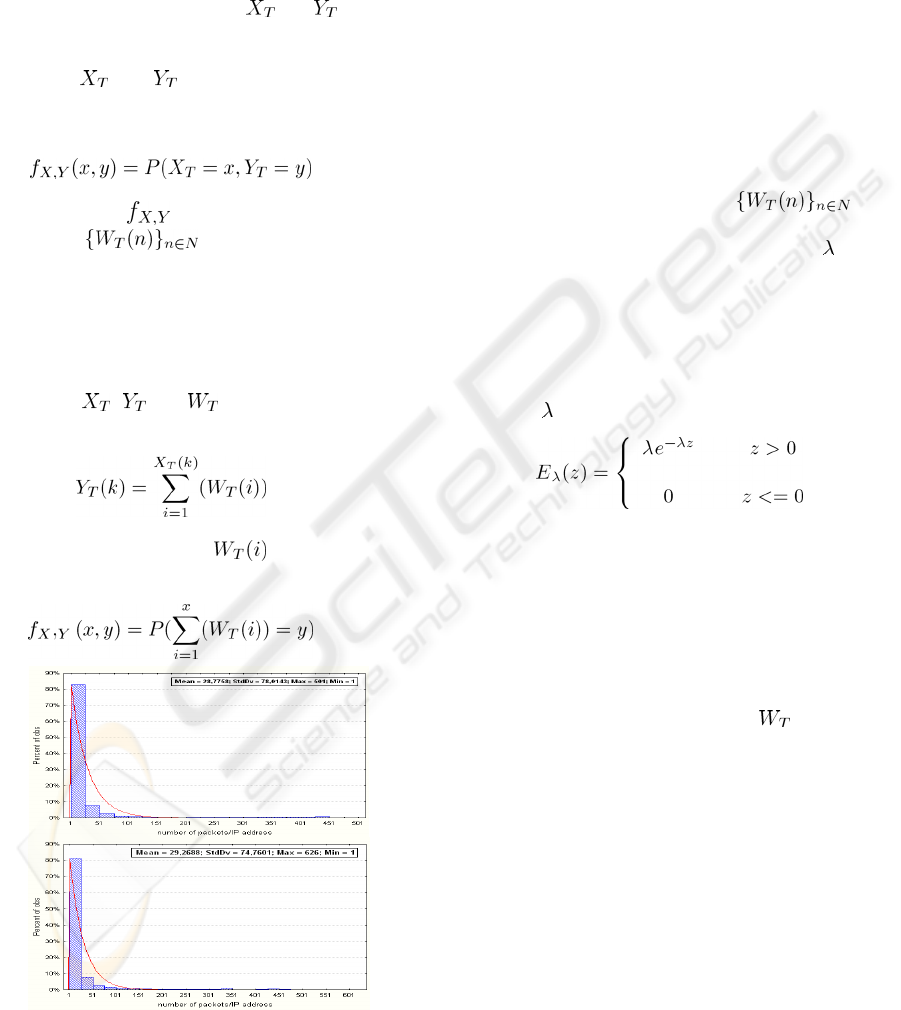
Figure 3: Exponential modelling for traffic marginals (a)
normal traffic (b) legitimate traffic at large scale.
4 TRAFFIC MODELLING
A central question in the modelling of Internet
traffic resides in the choice of a pertinent level
aggregation T. All along this work, we have worked
with aggregation level T equal to one second. This
choice allows us, on the one hand, to represent well
the granularities of the traffic and on the other hand
an acceptable time of detection. Similar results were
obtained for T ranging from the millisecond up to
the second.
4.1 Exponential Distribution
To model the stochastic process we
propose to use a stationary process following an
exponential distribution of the parameter
. The
exponential distributions are a class of continuous
probability distributions. They describe the times
between events in a Poisson process, i.e. a process in
which events occur continuously and independently
at a constant average rate. The probability density
function of an exponential distribution with rate
parameter
is:
Figure3 illustrates the results obtained on the
trace “ampath-oc12.20070109.dag0.20070110-
1200.anon”
and “ampath-oc12.20070109.dag0.20070109-
1700.anon”. Identical conclusions were found for all
the other analyzed traces. They superpose the
empirical marginals to the exponential theoretical
distribution for real data. These figures show that the
exponential distribution describes in a very
satisfactory way the marginals of the
process. In
fact, the adjustment of the empirical histograms is
very satisfactory. Similar results were obtained on
all the flows considered and for a large range of
aggregation levels. We observed that the modelling
is valid for T ranging from the millisecond up to the
second .This model offers then a valid and flexible
modelling for a large range of aggregation levels.
We note that our hypothesis concerning the stability
of the size of the flow is fully justified. Figure3 (b)
shows that during legitimate anomaly the
distribution of the flow size is almost identical
despite a large increase in the total volume of traffic.
Note also that during DoS attack distribution will
change drastically despite the number of flows
involved in the attack is low. The expected value
and the variance of the of IP-flow size process
A TRAFFIC COHERENCE ANALYSIS MODEL FOR DDOS ATTACK DETECTION
151

before and after the attack are very different. These
results are completed by those of the following
section within the framework of anomalies’
detection.
4.2 The Gamma Distribution
The objective of this paragraph is not to model the
aggregated traffic by the gamma distribution but to
calculate the value on every time T interval. The
gamma distribution is a two-parameter family of
continuous probability distributions. It has a rate
parameter
and a shape parameter . If is an
integer (Erlang distribution) then the distribution
represents the sum of
independent exponentially
distributed random variables, each of which has a
mean of
. That explains the fact that the gamma
distribution is very used to describe the Internet
aggregated traffic [9, 10, 11]. The density
probability of gamma distribution takes the form:
where is the standard Gamma function. The
equation (3) becomes then:
(4)
4.3 The Central Limit Theorem
However, in the practical case when the number of
IP connexions is big enough (the shape parameter
)
it is impossible to calculate the density probability of
a gamma distribution. To resolve this problem, we
used the central limit theorem.
Let n independent and identically distributed
random variables each having finite values of
expectation and variance . The central limit
theorem states that as the sample size n increases,
the distribution of the sample average of these
random variables approaches the normal distribution
with a mean
and variance irrespective of the
shape of the original distribution. The equation (3)
becomes:
(5)
5 RESULTS AND DISCUSSION
Building on the experimental results described in the
previous section, a detection method of DDoS
attacks is put at work, known as follows. The trace is
cut in adjacent blocks of the size
. A bloc is
equal to NT (T is the chosen aggregation level) and
represents a minimal time detection. For the nth
block (beginning at
), we calculate first the
number of IP connexions
and the number of
received packets
on each interval iT (i varies from
1 to N). This very operation is applied on a reference
window that is a block of
minutes (taken
before attacks and that can be therefore assimilated
to a regular traffic). For every block
, we
calculate the parameter of the exponential
distribution
, the value of expectation and the
standard deviation
( . Then, as
previously explained, we calculate the joint density
of probability
of the time series and for
the block reference and for the real traffic by using
either the density probability of the gamma
distribution or the central limit theorem.
For every block ∆, we calculate the distance
between measured statistics on the block of
reference and the same statistics calculated on the
considered block (figure4). That distance can then
be thresholding so to detect the abnormal behaviour
and set an alarm. Different distances can be used to
obtain a score that translates the proximity or the
divergence of two distributions. The interested
reader can see the article (M. Basseville, 1989)
which proposes a good review of the different
existing distances. We used the mean square error
(MSE), defined as follows:
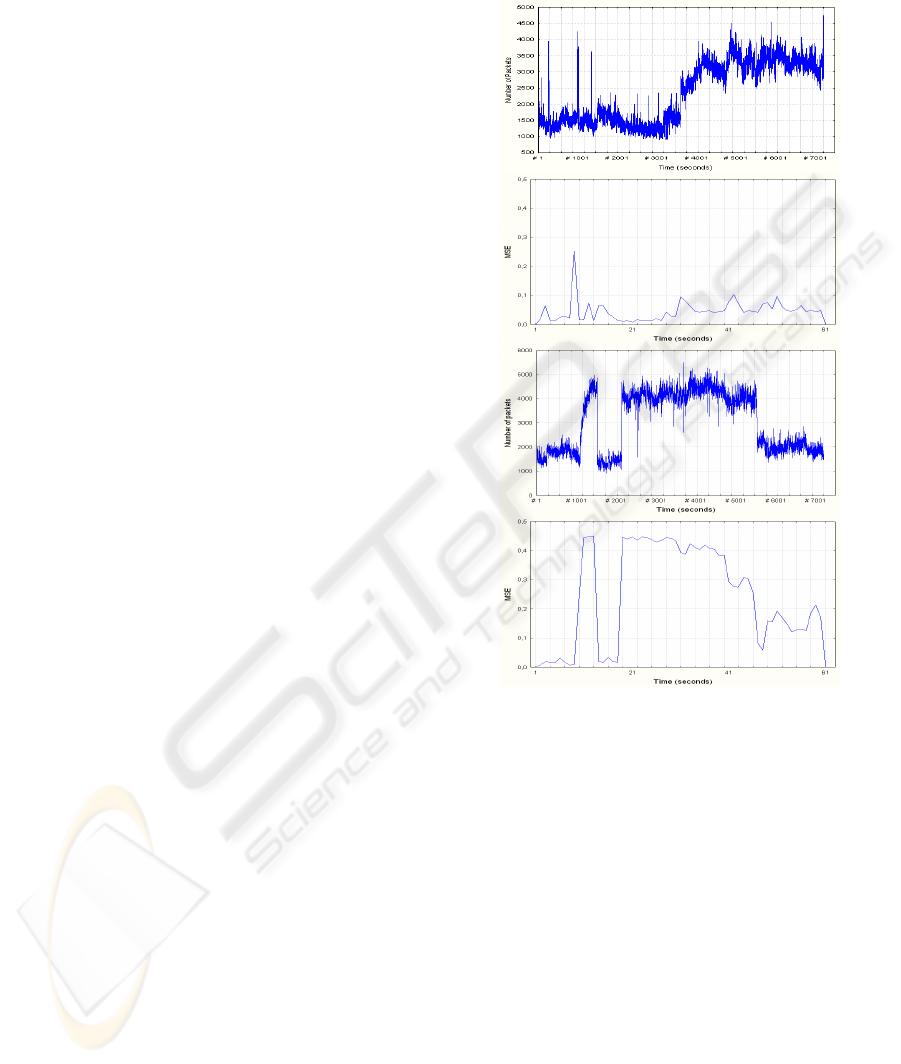
The analyses made use of a time detection ∆
equal to one minute
. The reference is fixed
by using 10 minutes of traffic taken sometime before
the anomaly. Figure4 indicates that a legitimate
anomaly can not be detected through the above-
mentioned detection method even when it is large-
scale. However, even a low-scale attack causes a
significant increase in the calculated distance. The
distance D(n) on every time window does not show
an augmentation during legitimate anomaly because
the distribution of IP connexions size is very close to
that of a normal traffic. The difference observed for
the
values between the situation of DDoS
attack and the legitimate anomaly results in the fact
SECRYPT 2009 - International Conference on Security and Cryptography
152
that the size of a small proportion of IP connexions
far exceeds those of a normal traffic.
False positives and source address spoofing are
serious concerns for DoS attack detection. Since the
potency of DoS attacks does not depend on the
exploitation of software bugs or protocol
vulnerabilities, it only depends on the volume of
attack traffic. As a result, the DDoS attack traffic
will look very similar to legitimate traffic. This
means that any detection scheme has a high risk of
mistaking legitimate traffic as attack traffic, which is
called a false positive. These false positives are
mainly due to two factors: (1) a large increase in the
number of IP connexions; (2) a wide variation in the
type of IP connexions and therefore in the IP
connexions features (mainly IP connexions size
distribution). Reduce the number of false positives
returns to take into account these two factors. As the
number of IP connexions and the total volume are
largely dependents, our approach detects the
occurrence of DDoS attack in the dependence
(coherence) variation between these two sizes as a
function of time, while updating the distribution the
size of the IP connexions and using the number of IP
connexions to calculate the degree of coherence.
This enabled us to reduce the number of false
positives which is the basic purpose of this work.
Finally, attackers frequently use source address
spoofing during the attack: they fake information in
the IP source address field in attack packet headers.
One benefit attackers have from IP spoofing is that it
is extremely difficult to trace the agent machines
(compromised machines). This, in turn, brings
several dire consequences. Since agent machines run
a very low risk of being traced, information stored
on them (i.e., access logs) cannot help to locate the
attacker himself. This greatly encourages DDoS
incidents. Furthermore, hiding the address of agent
machines enables the attacker to reuse them for
future attacks. Thus, an effective DDoS detection
approach must take into consideration the factor IP
spoofing, which is the case of our approach. Firstly,
when agent machines send IP-flow with spoofed
source IP address, the total number of IP connexions
is unchanged, as does the distribution of the size of
IP connexions. Secondly, when one or more agents
machine send spoofed IP traffic and constantly
changing IP addresses, the number of connexions
becomes very large and the distribution of incoming
traffic is drastically changed since the average value
of the IP connexions size decreases radically. This
will generate a large statistical break between
normal traffic and attack traffic. However, the main
purpose of this work is not IP spoofing detection;
there are several mechanisms to prevent against IP
spoofing. Interested readers may refer to (Zhenhai
Duan et al., 2008).
Figure 4: (a) Packet arrival process for large scale
legitimate traffic (b) MSE for large scale legitimate traffic
(c) Packets arrival process for low scale DoS attack (d)
MSE for low scale DoS attack.
6 CONCLUSIONS AND FUTURE
WORK
In this paper, we have proposed statistical approach
for DDoS attacks detection. Our experiments were
made on a real traffic flow issued from a “CAIDA
data collection” collected in 2007. Our proposed
approach is based on the evaluation of the degree of
coherence between the received traffic volume and
the number of IP connexions per time interval with
the aim of thresholding calculated distances between
a current observation window and a given reference.
The main contribution of this paper is that our
proposal model allows us to identify DDoS attacks
A TRAFFIC COHERENCE ANALYSIS MODEL FOR DDOS ATTACK DETECTION
153

regardless of the traffic volume size. A legitimate
augmentation at large scale will not be detected
through this method which minimises false alarms.
The second contribution is that our proposal does
need to inspect only the source IP address fields of
each packet. This makes it simpler and more
practical for real-time implementation.
This work will be continued by a statistical study
of Internet traffic using “The CAIDA Anonymized
2008 Internet Traces Dataset”
(https://data.caida.org/datasets/passive-2007/) and
“The CAIDA Backscatter 2008 Dataset”
(https://data.caida.org/datasets/security/backscatter-
2008/) which contains traffic traces more
representative of current Internet traffic. Our
objective is first to apply our approach on a wide
range of traffic with different types of anomalies
such IP spoofing and different types of networks,
then to identify and isolate the IP addresses involved
in DDoS attack.
REFERENCES
D. Dittrich, "Distributed denial of service attacks/tools
page" , http://staff.washington.edu/dittrich/misc/ddos/
L. Feinstein, D. Schnackenberg, April 2003. "DDoS
Tolerant Network”. Proceedings of the DARPA
Information Survivability Conference and Exposition.
C. Manikopoulos, S. Papavassiliou, October 2002.
"Network Intrusion and Fault Detection: A Statistical
Anomaly Approach". IEEE Communication
Magazine.
R. B. Blazek, H. Kim, B. Rozovskii, A. Tartakovsky, June
2002. "A Novel Approach to Detection of Denial of
Service Attacks Via Adaptive Sequential and Batch-
Sequential Change-Point Detection Methods".
Workshop on Statistical and Machine Learning
Techniques in Computer Intrusion Detection.
N. Ye, June 2000. “A markov chain model of temporal
behavior for anomaly detection”. Workshop on
Information Assurance and Security, West Point, NY.
J. Yuan and K. Mills, 2004.” DDoS attack detection and
wavelets”. Technical report, National Institute of
Standards and Technology.
A. Hussain, J. Heidemann, 2003, and C. Papadopoulos, “A
framework for classifying denial of service attacks,”
Proc. ACM SIGCOMM.
L. Li et G. Lee, August 2003. “DDoS attack detection and
wavelets”. International Conference on computer
communications and networks.
A. Scherrer, N. Larrieu, P. Owezarski, P. Borgnat, P.
Abry, January-March, 2007. “Non Gaussian and long
memory statistical characterization of Internet traffic
with anomalies”. IEEE Transaction on Dependable
and Secure Computing, Vol. 4, No. 1, pp 56-70,
S. Kim, J. Y. Lee, and D. K. Sung, Mar 2003. "A shifted
gamma distribution model for long-range dependent
internet traffic". IEEE Communication. Letters. vol. 7,
pp. 124--126.
Z. Liu, J. Almhana, V. Choulakian, and R. McGorman,
Aug. 2006 “A Long-Range Dependent Model for
Internet Traffic with Power Transformation”. IEEE
Communication Letters, vol. 10, no. 8, pp. 632-634.
M. Basseville, 1989. Distance measures for signal
processing and pattern recognition. Signal Processing,
18 :349–369.
Zhenhai Duan, Xin Yuan, and Jaideep Chandrashekar,
January-March 2008. "Controlling IP Spoofing
Through Inter-Domain Packet Filters", IEEE
Transactions on Dependable and Secure Computing
(TDSC). Volume 5, Number 1 pp 22 - 36.
https://data.caida.org/datasets/security/backscatter-2007/
https://data.caida.org/datasets/passive-2008/
https://data.caida.org/datasets/security/backscatter-2008/
https://data.caida.org/datasets/passive-2007/
SECRYPT 2009 - International Conference on Security and Cryptography
154
