
OBSTACLE DETECTION USING STRUCTURED BACKGROUND
Ghaida Al Zeer, Adnan Abou Nabout and Bernd Tibken
Chair of Automatic Control, Faculty of Electrical, Information and Media Engineering
University of Wuppertal, Rainer-Gruenter-Str. 21, 42119 Wuppertal, Germany
Keywords: Image Processing, Mobile Robotics, Path Planning, Obstacle Detection.
Abstract: The paper presents an obstacle detection method for mobile robots using a structured background. This
method is based on differences of appearance between obstacles and the background in the camera images.
The basic idea is to cover the ground of the workspace with a known structure. If part of this structure is
obscured, this can be detected and indicates the existence of an obstacle. The method uses a reference
symbol, chosen to exhibit certain features, to construct a reference image of the structured background. To
detect possible obstacles we calculate the Fourier descriptors (FD) of all contours included in a given image
and compare them with those of the stored reference symbol. This enables us to recognize all reference
symbols which are not obscured by obstacles. We then determine the positions and dimensions of all
existing obstacles by calculating the occupied symbol areas. The method is implemented as part of a robot-
vision system for fully automated stockkeeping. In this paper the results are shown using a MATLAB
implementation.
1 INTRODUCTION
Obstacle detection is an important and essential task
in a system with mobile robots (Al Zeer, Nabout and
Tibken, 2006) and (Al Zeer, Nabout and Tibken,
2007). The method of detection depends on the
available information about the obstacles and their
environment.
There are various methods of obstacle detection,
based on different approaches (Simmons, 1996) and
(Sabe, Fukuch, Gutmann, Ohashi, Kawamoto and
Yoshigahara, 2004). Two different types of
strategies are distinguished. The first strategy is
called range-based obstacle detection. This method
is based on the measurement of the distance between
the obstacle and an implemented sensor, such as an
IR-Distance Sensor. The second method is called
appearance-based obstacle detection, in which the
obstacles, e.g. in a color picture, are separated from
the background and classified using their appearance
properties (Ulrich and Nourbakhsh, 2000).
Within our work an extended appearance-based
method for obstacle detection has been developed,
which does not use the appearance of an obstacle,
but the appearance of the background. This method,
obstacle detection using structure background, was
developed for our robot-vision system (Al Zeer,
Nabout and Tibken, 2007) and allows a reliable
detection and localization of obstacles. Grayscale
images are available as part of a robot-vision system.
These grayscale images are acquired by a camera
system mounted on the ceiling of the workspace
area. Therefore the calculation of the obstacle
positions will be carried out by image evaluation.
Objects in the workspace at the time of image
acquisition are considered as static obstacles and
they are taken into account in the calculation of
collision-free routes. Objects that inter the
workspace after the image acquisition are considered
as dynamic obstacles (Borenstein and Koren 1990).
These obstacles can be detected by the distance
sensor which is mounted on the vehicle.
Encountering a dynamic obstacle causes the vehicle
to stop immediately and to provoke a re-imaging to
calculate a new route. Several implementations of
the new method will be described in detail and then
their realization will be further illustrated.
The paper consists of four sections. In section 2
the principle of the method “obstacle detection using
structured background” is explained. Section 3 is
concerned with the selection of a suitable reference
symbol. In section 4 some results related to the
MATLAB implementation are shown and discussed.
439
Al Zeer G., Nabout A. and Tibken B. (2009).
OBSTACLE DETECTION USING STRUCTURED BACKGROUND.
In Proceedings of the 6th International Conference on Informatics in Control, Automation and Robotics - Robotics and Automation, pages 439-444
DOI: 10.5220/0002209004390444
Copyright
c
SciTePress

2 OBSTACLE DETECTION
The basic idea of this method is to cover of the
ground in the workspace with a known structure. If
part of this structure is obscured by an obstacle, this
can be detected. The structure can be generated by
distributing reference symbols in a regular pattern in
the workspace of the mobile robot. The distribution
of symbols results in a regular and known pattern of
contours in every picture of the workspace. Thus,
the distribution of the center positions for the
reference symbols comprises a matrix structure,
similar to the pixel matrix of a bitmapped image.
The use of a symbol pattern as reference feature
of the ground leads to an extension of the conceptual
specifications of the developed robot-vision system.
The implementation of a new strategy of obstacle
detection in the robot-vision system was necessary,
because it was observed that a guaranteed
identification of obstacles through direct detection of
objects is not possible because of lighting errors.
The condition that the ground has to be covered with
a symbol pattern is not an especially unrealistic
burden, e.g. in the case of automated stockkeeping.
To cover the floor of a warehouse with custom-
patterned tiles, painted- or pasted- on symbols is a
relatively simple requirement that does not involve a
great effort or a high cost. Moreover, in the case of a
robot-vision system, this requirement does not
violate the principles or change the basic idea of the
system.
To verify the results, using the robot-vision
system, the extended method was implemented in
Matlab and was tested under real conditions. Only
common Matlab functions were used in the
implementation. The obstacle detection using
structure background is based on the following
assumptions:
First, an appropriate symbol pattern has to be
applied to the workspace floor. The symbol
used to generate the pattern must be suitable
for accurate detection. The shapes of the
symbol must differ greatly from the shapes of
expected objects and also from possible
shapes caused by noise and other errors.
All symbols must be identical, i.e. they all
have to be the same shape and size, and they
must be arranged in a regular pattern with pre-
defined distances to each other.
The symbols must be large enough for the
camera to render their shape and contours with
sufficient accuracy. This depends on the
resolution of the camera used and the distance
between camera and ground.
The symbols should not have reflective
surfaces, so they will not cause reflection
noise under bright lighting.
In order for the symbols to comprise a regular
pattern on the ground, they have to be applied so that
their centers form a regular grid, i.e. the distance
between the centers of the symbols must be equal. In
the following the individual steps of the newly
developed method will be described in detail.
2.1 Creating a Reference Symbol
The reference symbol is used as a basis of
comparison for the detection system, so its Fourier
descriptors (FDs) are detected and saved (Nabout,
1993).
Figure 1 shows an example for such a symbol.
Here "h" is the height, "b" the width, and "c" the
center (center of area) of the symbol. The symbol
orientation is chosen in suitable way to cover the
maximum area of the workspace.
Figure 1: Reference symbol.
The center of gravity of the symbol area can be
calculated according to the following general Eq. (1)
(Nabout, 1993)
∑
∫
∑
∫
=
=
+
+
=
=
n
1i
x
x
2
c
n
1i
x
x
c
1i
i
1i
i
dxy
F2
1
Y
dxyx
F
1
X
(1)
Here,
(
)
cc
Y,X
are the coordinates of the center
of the symbol, whose contours were approximated
by a polygon with n vertices.
The contour features of the symbol are computed
using the contour extraction methods described in
(OKE) (Nabout, 1993). Consequently, the original
grayscale image is first converted to a binary image.
Then the contours of the reference symbol are
extracted using the OKE method. Freeman-code is
used to describe the contours (cf. Figure 2 and
Figure 3).
ICINCO 2009 - 6th International Conference on Informatics in Control, Automation and Robotics
440
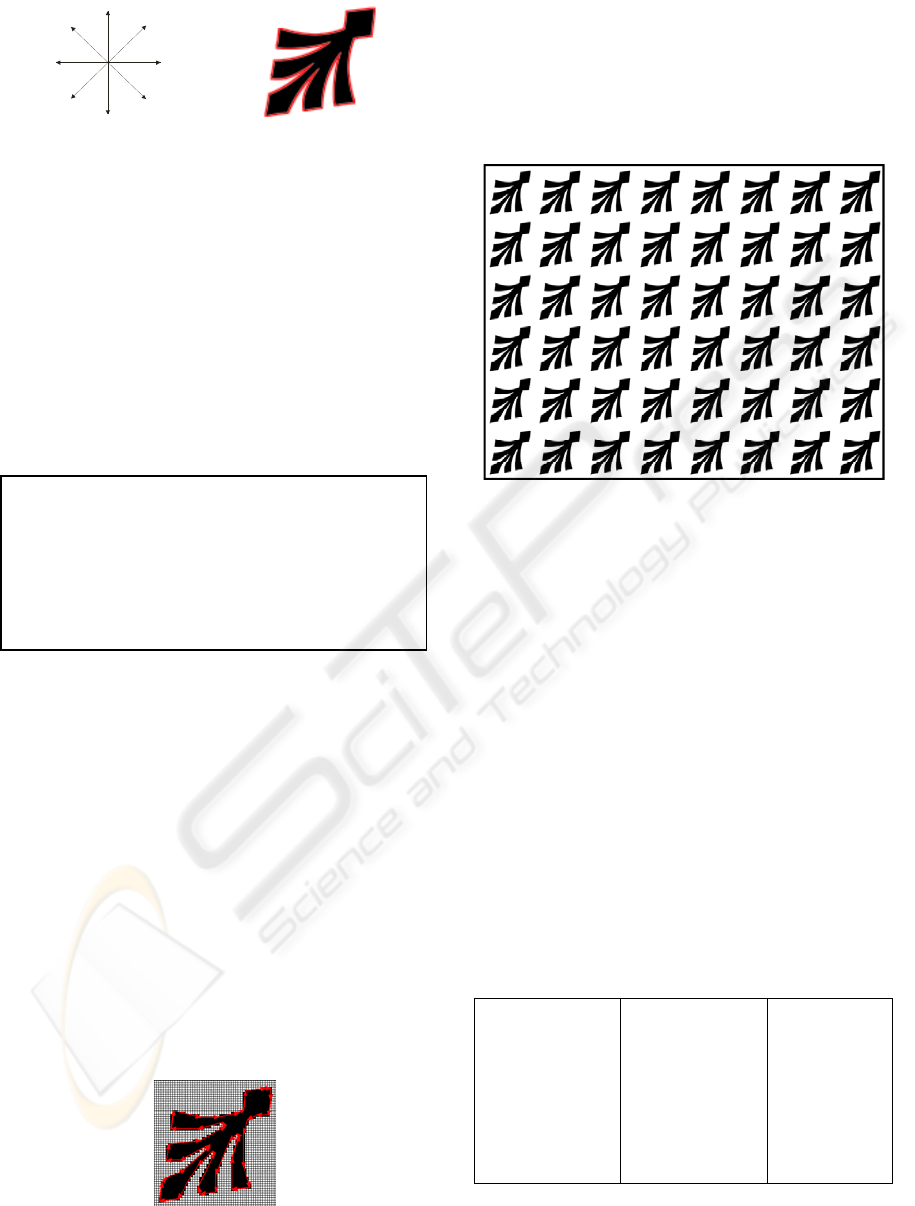
Figure 2: Freeman-Code.
Figure 3: Contours of the
reference symbol.
The OKE method consists of the following steps:
1. Segmentation of the image into overlapping
2*2 or 4*4 windows.
2. Evaluation of these windows according to the
extraction rules in time with the image sample
rate (extraction of basic contour elements).
3. Sorting of the contour elements to generate
closed contours.
For the reference symbol used here (Fig. 3), the
following Freeman chain was obtained using the
MATLAB implementation.
The starting point of the Freeman-chain is in this
example (86, 10). The extracted contour is shown in
figure 3.
To approximate the contour of the reference
symbol the KKA method (cf. Nabout) is used. The
KKA method is carried out as follows:
1. Segmentation of the chain of contour elements
into partial sequences that satisfy certain
conditions.
2. Detection of noise chains and merging them
with neighboring chains.
3. Sorting of partial chains, approximation of
curved contour parts.
After these steps, the FDs of the reference
symbol are calculated by a Fourier-analysis and are
saved in a data structure. Fig. 4 shows the symbol
after contour approximation.
Figure 4: The approximated contour of the symbol of
Fig.1.
2.2 Creation of a Reference Image
To create a reference image, the workspace floor is
covered with symbols forming a grid structure as
described above. Then an image of the empty
workspace without obstacles is acquired (Figure 5).
Figure 5: Workspace floor with reference symbols.
The reference image should be created under real
conditions. The acquisition parameters are set so that
all the symbols in the picture are completely visible.
Since a camera-acquired image always contains
other contours in addition to the symbols (noise,
errors, etc.), as a first step all the contours in the
picture are extracted and approximated using the
OKE and KKA-methods and saved in the form of
polygonal approximations. To remove the contours
created by noise we adopt a length filter using an
upper and lower threshold for the contour length.
Subsequently, the FDs and centers of area gravity
for the symbol polygons are computed. In our
example, the reference image contains 48 symbols.
By comparing the FDs of the extracted polygon with
the FDs of the reference symbol, all existing
symbols in the reference image can be detected.
Their centers then determine the grid structure
(Figure 6).
[ 47, 45
146, 45
247, 45
346, 45
445, 45
544, 45
644, 45
744, 45
:
:
47, 138
:
:
744, 138
47, 229
:
:
744, 229
47, 322
:
:
744, 322
47, 413
:
:
744, 413
47, 506
:
:
744, 506]
Figure 6: Coordinates of center of area gravity in reference
image with 8*6 symbols.
2
31
40
57
6
00000066656666666566666654444445444455665665666656666666
66666666666666766667666766764544444445444222222222222222
22221222221222212221223556556556565665656656665666566666
65666664445444445432222221222122121212121211235555555556
55655565655656565665444444544444542222122221222210101010
10110110110111111111113455455454545454454444454434221222
22122001000000001000100010010010101010110110113454454445
44445444444454444444444444443222122222222007007000070000
70000000000000000000100001000101012222221222220000100000
001
OBSTACLE DETECTION USING STRUCTURED BACKGROUND
441
In our case, a grid with 8*6 symbols is
detected. Since the identification of the symbols by
comparison the shape of the extracted contours with
the shape of the reference symbol is the key to a
reliable detection of all symbols, it is necessary to
use a reference symbol whose shape (represented
through its FDs) differs greatly from those of other
occurring objects or possible noise. To choose the
reference symbol as a circle, for example, would
result in confusion with all circular contours that
arise due to lighting errors. Such a reference symbol
is not suited for the present application.
For this reason, the following strategy to select
a suitable reference symbol was used in this work.
3 SELECTION OF A SUITABLE
REFERENCE SYMBOL
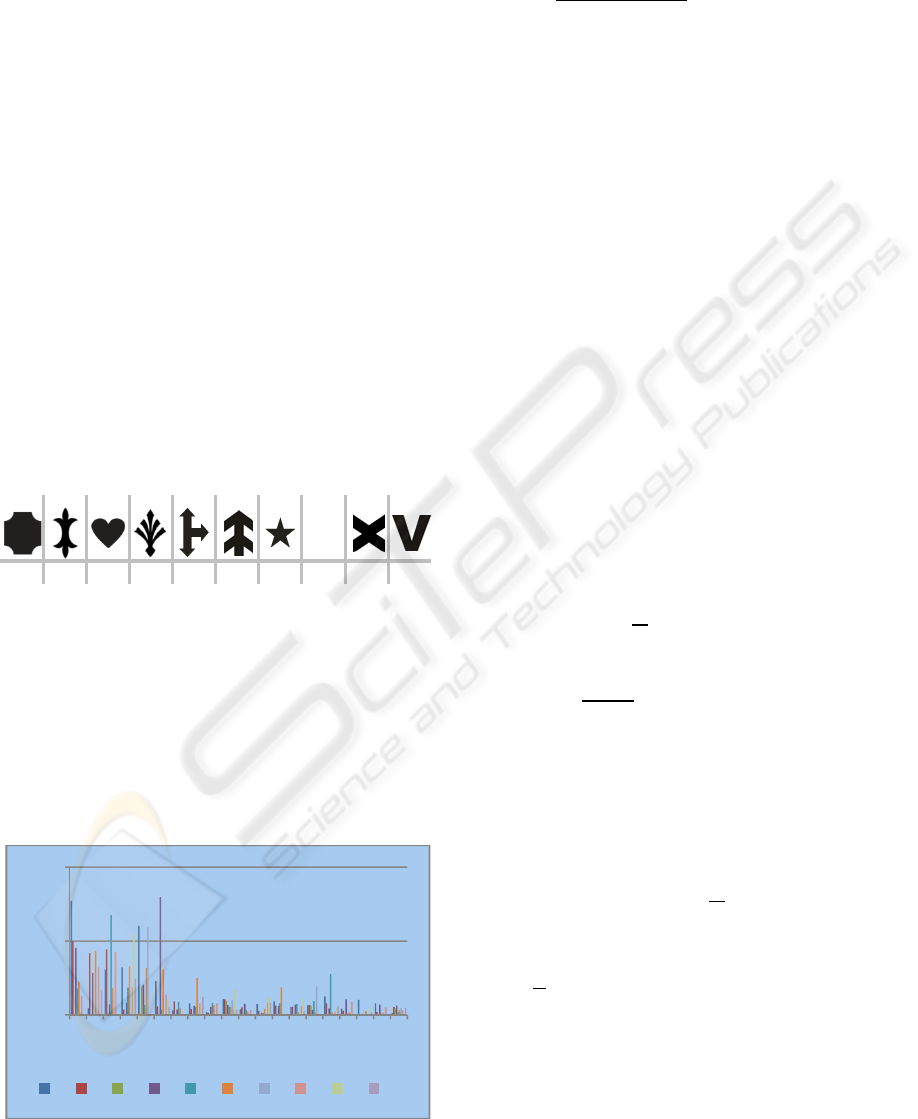
Within this work, a total of 30 symbols were
investigated in order to select the most suitable
symbol for generating the grid structure. Figure 7
shows 10 of those symbols.
T
(1) (2) (3) (4) (5) (6) (7) (8) (9) (10)
Figure 7: Some representatives of the symbols considered
for the generation of a symbol pattern.
The goal here is to find a symbol which gives
the smallest confusion risk with other contours that
may occur. For this reason, the FDs of all considered
symbols were calculated and compared using the
minimum distance method (Nabout, 1993). Figure 8
shows for example the first 20 FDs of the above
given symbols in a graphical comparison.
Figure 8: The first 20 FDs for the symbols of Fig.7.
The Euclidean distances
between every two
symbols were calculated, according to Eq. (2).
A
ik
A
jk
2
n
k1
;,
1,…,30
(2)
: Euclidean distance between object i and j
: Number of Fourier descriptors
,
: Amplitude spectrum of object contour i, j
The most suitable symbol, with the smallest
confusion risk, is that one which fulfills the
following three conditions:
1. The chosen symbol must have big distances
to all other symbols. This is fulfilled for that
symbol i with the maximum mean value
of the Euclidean distances d
,:1,…,30.
2. The symbol must have approximately equal
distances to all other symbols. This is
fulfilled for that symbol i with the minimum
variance v
i
of the Euclidean distances.
3. The chosen symbol must have partially
regular contour rather than irregular to
contrast to noise contours.
The means
and the variance v
i
are determined
for every symbol i according to Eq. (3).
1
M
d
ij
M
j1
v
i
1
M1
d
ij
d
j
2
M
j1
(3)
Here, M is the number of considered symbols.
Finally, the symbol i with the maximum mean
value and the minimum variance is selected
according to Eq. (4).
i
argmin
v
i
d
i
(4)
To fulfill the third condition we calculated all
values
and sorted them according to their values
from small to large in a list (L). Then we chose the
first symbol in the list (symbol 2) which shows
partially regular contour shape. The following two
Figures show the mean value and the variance for
the objects of Fig.7.
0,00
1,00
2,00
1234567891011121314151617181920
1 2 3 4 5 6 7 8 9 10
ICINCO 2009 - 6th International Conference on Informatics in Control, Automation and Robotics
442
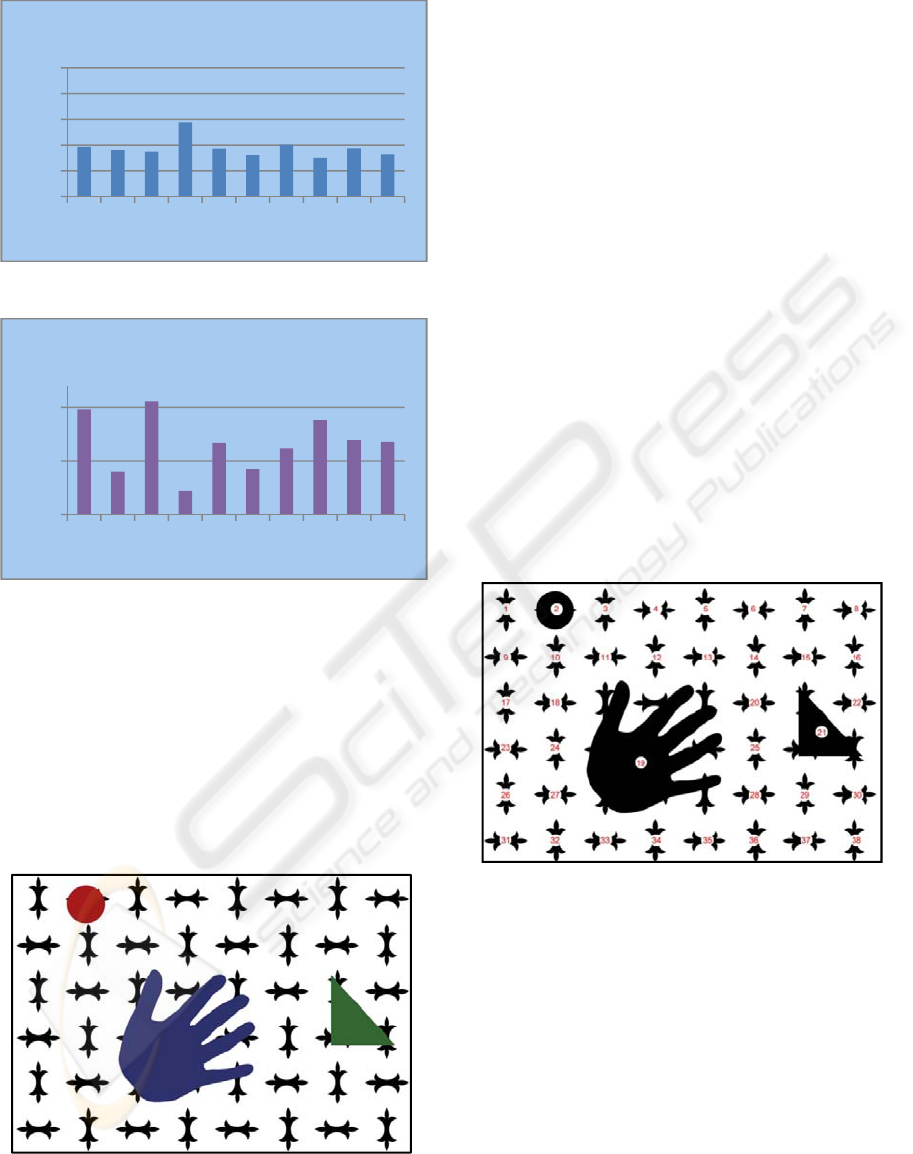
Figure 9: Mean for each symbol (10 symbols).
Figure 10: Standard variance for each symbol (10
symbols).
4 DETECTION OF OBSTACLES
To detect the obstacles, first a picture of the
workspace is taken. This picture contains the
reference symbols on the structured floor, as well as
a certain number of obstacles. Figure 11 shows an
image with simulated obstacles.
Figure 11: Reference image with obstacles.
To evaluate this image, the following steps were
executed:
1. Contour extraction using OKE method
2. Contour approximation using KKA method
3. Computation of FDs
4. Determination of the centers of all detected
reference symbols in the image.
After performing these steps and comparing the
FDs to those of the reference symbols by the
minimum distance method we received for the given
example 35 detected reference symbols. The
detection occurs, if the computed minimum distance
value between a considered object and the reference
symbol is smaller than a specified threshold. In our
case, the threshold was determined a priori and set
to the value 0.5.
If the minimum distance is greater than this
threshold, the considered object is designated as an
obstacle. To locate the positions and sizes of existing
obstacles the centers of found symbols in the current
image are compared with the centers of the symbols
in the reference image. The centers of the detected
symbols and the centers of the symbols in the
reference image must be identical, within a certain
tolerance value. For our example, we obtain the
following results (Fig. 12).
Figure 12: Binary image with numbered objects.
Here, there are 13 symbols obscured by
obstacles, whose centers are also known.
The calculation of the positions and sizes of the
obstacles to determine the region occupancy is
illustrated in the following section.
4.1 Mapping the Obstacles into the
Workspace
In an X-Y coordinate system, whose origin is
situated in the upper left corner of the workspace (cf.
Fig.11), each symbol S
is represented by the
position of its center x
,y
. For two adjacent
symbols on a horizontal line, the distance between
0,0
1,0
2,0
3,0
4,0
5,0
12345678910
Mean value
0,0
0,5
1,0
12345678910
Variance
OBSTACLE DETECTION USING STRUCTURED BACKGROUND
443
the centers of these two symbols is dx. Similarly, for
two adjacent symbols, which are arranged vertically,
it is dy.
Figure 13: Center of a macro pixel with horizontal and
vertical distance to its neighbours.
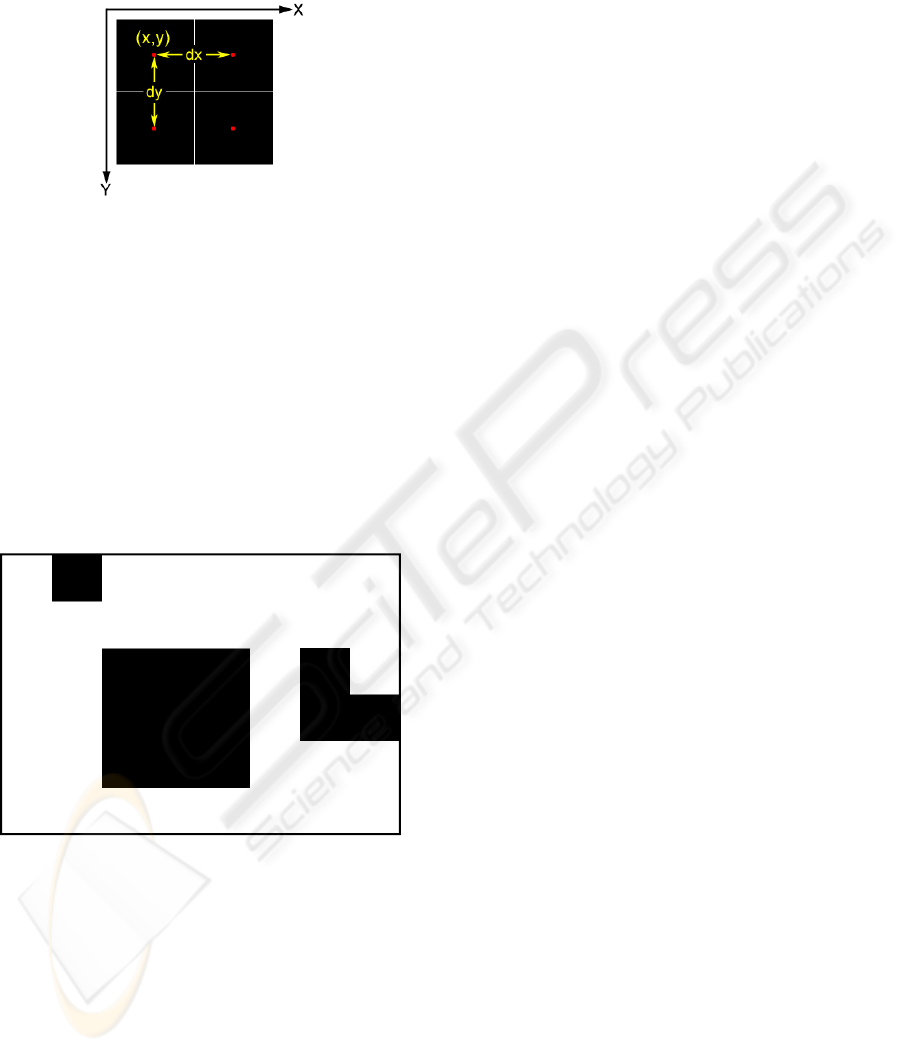
In order to detect the positions and size of the
existing obstacles in the workspace, a binary image
with the same resolution as the original grayscale
image is generated. The image is then divided into
regular blocks, where M is the number of
columns and N is the number of rows in the symbol
grid. All pixels within one block are assigned as "0"
(black), if the symbol represented by this block is
obscured by an obstacle, otherwise, the pixels are
assigned the value "1" (white). Figure 14 shows the
binary image generated for the example of Figure11.
Figure 14: Binary image showing occupancy of obstacles.
As the picture shows, there are three black areas,
which represent the positions of the obstacles. In
order to determine the size of the obstacles, the
contours of the areas are described as polygons. For
these polygons the Minimum Area Rectangles of the
obstacle regions (MAR) are then calculated
(Al Zeer, Nabout and Tibken, 2008). These regions
represent the workspace area occupied by the
present obstacles.
5 CONCLUSIONS
With the obstacle detection method presented here,
it is possible to detect existing obstacles in the
workspace of mobile robots. This method uses
grayscale images and a specially chosen reference
symbol. The results show that symbols with
irregular contour shape are not qualified to be used
as reference symbol, since the recognition process
leads to confusion with possible lighting errors and
other noise. The paper shows how to choose a good
reference symbol using a mathematical formula.
The method was developed for the detection of
obstacles in a robot vision system which is part of a
fully automated stockkeeping application. In this
context the results of the obstacle detection
described in this paper were also used for path
planning using auxiliary corners.
REFERENCES
Al Zeer, G., Nabout, A., Tibken, B., Path Planning for
Mobile Robots by Means of Approximate Routes,
2007 IEEE International Conference on Control and
Automation, Guangzhou, CHINA, May 30 to June 1,
2007, pp. 2468-2473.
Al Zeer G., Nabout, A., Tibken, B., Hindernisvermeidung
für Mobile Roboter mittels Ausweichecken, 52nd
Internationales Wissenschaftliches Kolloquium,
Technische Universität Ilmenau, 10.–13. Sep. 2007,
pp. 437-442.
Al Zeer, G., Nabout, A., Tibken, B., Extended Method for
Path Planning Using Auxiliary Corners, the 3rd IEEE
International Conference on Information &
Communication Technologies: from Theory to
Application, ICTTA'08, 7-11 April 2008, Damascus –
Syria.
Borenstein, J., Koren, Y., Real time obstacle avoidance for
fast mobile robots in cluttered environments. IEEE
Conf. Robotics and Automation, pp. 572-577, 1990.
Nabout A., Modulares Konzept und Methodik zur
wissensbasierten Erkennung komplexer Objekte in
CAQ-Anwendungen, 1993.
Simmons. R., The Curvature-Velocity Method for Local
Obstacle Avoidance. In Proc. IEEE Conf. Robotics
and Automation, 1996.
Sabe, K., Fukuch, M., Gutmann, J., Ohashi, T., Kawamoto
K., Yoshigahara, T., Obstacle Avoidance and Path
Planning for Humanoid Robots using Stereo
Vision.Proceedings of the International Conf. on
Robotics and Automation, ICRA'04, New Orleans,
April 2004.
Ulrich, I., Nourbakhsh, I., Appearance-Based Obstacle
Detection with Monocular Color Vision, Proceedings
of the AAAI National Conference on Artificial
Intelligence, Austin, TX, July/August 2000.
ICINCO 2009 - 6th International Conference on Informatics in Control, Automation and Robotics
444
