
OPTIMIZING PRICE LEVELS IN E-COMMERCE
APPLICATIONS
An Empirical Study
Burkhardt Funk
Leuphana Universität Lüneburg, Scharnhorststraße 1, 21335 Lüneburg, Germany
Keywords: Electronic commerce, Pricing strategy, Price optimization, Price tests, Price dispersion, Non-interactive
prices, Demand curve, Posted prices.
Abstract: Price dispersion in the Internet is a well studied phenomenon. It enables companies to adjust prices to a
level appropriate to their strategy. This paper deals with question how Internet retailers should do so. The
discussed method optimizes short-term profitability by determining the exact demand curve. The method
involves the application of empirical price tests. For this purpose visitors of an Internet retailer are divided
in statistically identical subgroups. Using the A-B testing method different prices are shown to each
subgroup and the conversion rate as a function of price is calculated. We describe the organizational
requirements, the technical approach, and the statistical analysis applied to determine the price optimizing
the per-order profit. A field study carried out with a large Internet retailer is presented and shows that the
company was able to optimize a specific price component and thus increase the contribution margin per
order by about 7%. We conclude that the discussed method could be applied to answer further research
questions such as the temporal variation of demand curves.
1 INTRODUCTION
Over the last years the pricing of products and
services in the online channel has attracted
significant attention from the research community
(Chernev 2003, Daripa 2001, Kannan 2001, Spann
2004). Due to data availability most work has been
done on interactive pricing schemes and auction
theory with respect to Internet business models
(Roth 2002). While interactive pricing schemes
mostly apply to consumer-to-consumer scenarios
(e.g. eBay) they are rarely used in business-to-
consumer scenarios in which fixed prices
(sometimes referred to as posted prices) dominate
successful business models. In the area of fixed or
non-interactive prices some work has gone into the
study of price dispersion (Baye 2004, Brynjolfsson
2000) and price discrimination in different
circumstances, for example under consideration of
privacy issues (Böhme 2007, Odlyzko 2003).
Brynjolfsson and Smith (Brynjolfsson 2000)
have shown empirically that the Internet cannot be
considered to be a frictionless market but that price
dispersion can be observed for a wide range of
products (e.g. prices for books differ by an average
of 33%). They argue that, with respect to prices,
competition in a specific market and brand as well as
trust in a specific company remain a source of
heterogeneity among Internet retailers.
This result leaves room for companies to adjust
their price level for specific products and services to
the profit maximizing level. Empirical price tests
have been suggested as the appropriate means for
finding optimal "one-for-all" fixed prices (Baker
2001). To do so we apply the A-B testing method
(Patzer 1996) and show that for standardized goods
and services this approach supports price
optimization.
The contribution of this paper is twofold. First, a
method for optimizing fixed prices in e-commerce
applications is proposed and discussed in detail for
the first time in the scientific literature. Even though
the potential of the method has been pointed out
before, there has been no such detailed discussion.
Second, results of and issues encountered during a
field study carried out with a large German Internet
retailer are presented.
The paper is organized as follows: in the next
chapter we review related work, focusing on aspects
of non-interactive pricing. In chapter 3 we describe
37
Funk B. (2009).
OPTIMIZING PRICE LEVELS IN E-COMMERCE APPLICATIONS - An Empirical Study.
In Proceedings of the International Conference on e-Business, pages 37-43
DOI: 10.5220/0002186700370043
Copyright
c
SciTePress

the method and the basic assumptions of our work.
Chapter 4 deals with the environment of the field
study and the organizational and technical
implementation. The results section (chapter 5)
presents sanitized data from the field study, shows
how to derive the optimal price level and discusses
the implications with respect to the average cost per
acquisition. The conclusion briefly summarizes the
major ideas of the paper and directs attention to
where further research is needed.
2 RELATED WORK
With the advent of e-commerce it was assumed that
the Internet would reduce consumer search costs and
switching costs and that this would finally lead to
more competition and lower prices. This argument
was expected to take markets closer to the
theoretical model of perfect competition (Daripa
2001). However, price dispersion is observed not
only for heterogeneous products but also for
homogeneous ones like books and DVDs.
This phenomenon has often been studied (see the
paper from Baye et al. (Baye 2004) and for an
overview (Bock 2007)) and a number of possible
reasons have been suggested. Product differentiation
among retailers is one explanation. Differentiation
can happen along features, qualities, and services
thus softening price competition. In addition the
brand of a company and the loyalty of customers to
it play an important role in avoiding price
competition.
Furthermore, searching and comparing offerings
of identical products from different sites is
associated with costs. Hann and Terwiesch (Hann
2003) define these frictional costs as “the disutility
related to learning to navigate through websites, the
disutility of keying in order and payment
information, the cognitive costs of comparing
different offerings, and the opportunity cost of time
for the online transaction”.
Price dispersion in the Internet enables (and
forces) companies to set their own prices while
taking into account their strategic goals. There is a
large body of knowledge on how this can be
accomplished in the offline world (Simon 1996).
Setting prices is based on a customer’s willingness
to pay, the cost structure of the company under
consideration and the pricing policies of relevant
competitors. In some cases “strategic” dumping
prices or communication reasons (e.g. being
perceived as a high quality provider) are involved
when setting prices. More often prices are set in
order to optimize short or medium-term profit. To do
so the demand as a function of price has to be
determined. Different methods have been employed
to determine the demand curve: (i) customer and
expert interviews, (ii) market observation, and (iii)
lab and field experiments. Field experiments have
two major problems in the offline world: (i) menu
costs forbid changing prices often, thus reducing the
possible granularity of price tests, (ii) price tests are
carried out either at different locations at the same
time or at the same location at different times –
therefore, interpreting results requires taking into
account potentially different environments. Online
price tests can overcome these difficulties and lead
to accurate and realistic demand curves, which can
then be used to find the optimal prices with respect
to profit maximization.
3 METHODOLOGY
3.1 Assumptions and Limitations
Visitors of an e-commerce site form a heterogeneous
group in terms of characteristics such as age, sex,
education, purchasing power, and, what is important
for our work, the willingness-to-pay for a given
product or service. However, provided that the group
of all visitors is sufficiently large, dividing visitors
randomly into subgroups (not necessarily of the
same size) leads to these subgroups having identical
characteristics as the base group. That means that for
example the fraction of persons between 20 and 30
years old is – within the margin of statistical error –
the same for each subgroup. To generate subgroups,
visitors are assigned to one of the subgroups
randomly (e.g. on a rolling basis) when they enter
the e-commerce site. This facilitates the application
of A-B tests for several purposes, e.g. the
optimization of click-through rates for different
landing pages.
The method works for standardized goods only
and assumes that the price sensitivity of customers
remains constant over time. It is obvious that this is
a simplifying assumption which should be examined
in more detail. Furthermore, the method requires the
e-commerce site to have enough visitors and
transactions (what ‘enough’ means is defined below)
as well as to offer enough technical flexibility to
vary posted prices. It should be emphasized that we
do not address or propose price discrimination and
visitor/customer segmentation based on accessible
properties such as the internet service provider, the
technical configuration of the browser, or the
ICE-B 2009 - International Conference on E-business
38

referrer URL, even though A-B tests could also
serve this purpose.
3.2 Method Description
An e-commerce service involves several price
components such as the prices for the product
ordered, a service charge, an express shipping fee, a
fee for using specific payment methods but also
posted discounts on all these components. At the
beginning of a study, using the method described in
this paper, it has to be decided what price
component should be observed and optimized and
what the appropriate price range for this component
might be. The price range may depend on e.g.
competitor’s prices and own cost structures.
During the study, customers from each subgroup
are provided with different (discrete) prices chosen
from the above price range. Then conversion rates –
that is the ratio of buyers to visitors – are calculated
for each subgroup. This allows us to find the
demand curve, which does not calculate the absolute
amount as a function of price as is usually done, but
instead the conversion rate as a function of price. If
we disregard temporal changes of the demand curve
due to, for example, seasonal or weather related
fluctuations (see assumptions and limitations) we
can determine the conversion rate with as much
precision as desired, with the only limit being the
statistical error which is related to the number of
visitors and buyers in each subgroup. Given a range
of prices to be tested the number of subgroups
corresponds to the granularity of the price test. The
number of possible subgroups in turn depends on the
number of visitors and buyers in the period of time
of the price test and the desired precision of the
conversion rate.
Online price tests overcome the two major
problems stated in the previous chapter: (i) once the
proposed method in this paper is technically
implemented the menu costs, and thus the cost of
changing prices, decrease substantially, (ii) since the
different prices are displayed virtually at the same
time in (with respect to their characteristics)
identical subgroups there are no differences between
the environments.
In principle this approach is able to optimize the
interplay of price components and use insights from
studies like the one by Hamilton and Srivastava 0.
For example, the interplay between the product
price P
i
and a standard service charge S
j
and how
these prices are perceived by customers might be
studied.
Table 1: P
i
und S
j
represent the different prices charged in
the price test. CR
i,j
is the observed conversion rate at
prices P
i
und S
j
. The price test involves using 16
subgroups.
P
1
P
2
P
3
P
4
S
1
CR
1,1
CR
1,2
CR
1,3
CR
1,4
S
2
CR
2,1
CR
2,2
CR
2,3
CR
2,4
S
3
CR
3,1
CR
3,2
CR
3,3
CR
3,4
S
4
CR
4,1
CR
4,2
CR
4,3
CR
4,4
This involves offering the subgroups a number of
combinations regarding the individual price
components and calculating the conversion rate
(Table 1). This also allows the study of price-
dependent substitution effects between products.
These studies are only limited by the number of
visitors and buyers per subgroup needed for a
statistically valid statement, and so the number of
possible subgroups.
3.3 Phases
The price test is carried out in three phases (see
figure 1). In the first phase we fix the price
component to be studied, the range containing the
expected profit-maximizing price and the duration of
the test needed for statistical validity. In addition the
technical (generating subgroups, providing them
consistently with different prices, collecting data)
and organizational requirements (communication
policies, customer service training) have to be taken
care of. The second phase, which we call the live
phase, is subdivided into two time periods. In the
first period all visitors are assigned to one of the
subgroups at their first visit and are shown the
respective price for the subgroup. Alternatively, for
high traffic sites only a fraction of all customers are
selected to participate in the price test (as in the field
study), since this fraction is already large enough to
allow for valid conclusions. In the second period of
the live phase the changed prices are only shown to
those visitors who already visited the site during the
first period of the live phase (how visitors are
identified is discussed in the next chapter). Visitors
who ‘enter’ the store for the first time in the second
period are shown a standard price. This procedure
allows recording the effect of changed prices on the
customer retention rate. The third phase concerns
data analysis and interpretation.
OPTIMIZING PRICE LEVELS IN E-COMMERCE APPLICATIONS - An Empirical Study
39

Figure 1: Overview of the actions in the three main phases, the time periods refer to the field study.
4 IMPLEMENTATION
4.1 General Aspects
The kind and scope of technical changes required for
the price test depend on the technical system being
used in the front- and backend and its flexibility
The two most important technical requirements
for a successful price test consist of the reliable
identification of visitors (as far as possible) as well
as a consistent communication of the specific price
per subgroup based on their identification. These
requirements have to be fulfilled for both the front-
and the backend. In the frontend cookies and URL
encoded session IDs can be used for the
identification of visitors and their assignment to a
subgroup, in the backend only customers are
handled and thus, the identification is easy. Visitors
that does not permit persistent cookies should be
excluded from the price test and be showed a
standard price. If visitors delete cookies regularly
they may be quoted different prices for the same
product in consecutive visits. An alternative
approach to using cookies for identifying subgroups
is to use a so-called fingerprint, which is generated
based on the technical configuration of a visitor’s
browser (user agent, operating system, version,
resolution). This approach is robust against cookies
being deleted, but may lead to subgroups not being
identical in their characteristics. For example Firefox
users could share a greater willingness to buy a
given product than users of Internet Explorer and so
influence the conversion rate independently of the
price. To avoid displaying different prices to a
visitor who uses different computers is almost
impossible and would require the visitors to identify
themselves by login before seeing prices, which is
uncommon in B2C systems.
Besides ensuring the re-identification of visitors
the system must guarantee that the posted prices are
the ones that are actually processed in the financial
system and that a customer is charged accordingly.
The posted prices also have to be taken into account,
both in electronic (confirmation email, FAQs) and in
paper-based (invoice) communication with the
customer. Ensuring these technical requirements are
fulfilled can, depending on the technical platform
being used, involve considerable expense.
4.2 Field Study
We will illustrate the technical implementation of
the price test using our field study (Knoop 2004).
The research site is a German e-commerce site with
an annual revenue of about 100 million euros at the
time of the study. The site offers a large number of
products (>10,000), whose individual prices vary
only slightly between the company’s and its
competitors. The technical platform is a Java-based,
proprietary web application which is operated,
maintained and further developed by the IT
department of the company. The backend system
was also individually developed for the company.
In the preparatory phase (outlined in section 3),
we decided at the beginning of the project that rather
than test individual product prices we would study
the optimization of the service charge collected with
each order. With respect to the technical
implementation we decided to use cookies to
identify users participating in the price test. When a
visitor arrived on the web site during the live phase
it was checked whether he already had a cookie
related to the price test. If not, a cookie was set
containing information about which subgroup the
visitor had been assigned to. If there was already a
“price test cookie”, it was used to show the
appropriate service charge for the subgroup. In
addition to the cookie, a session ID was generated
that contained an ID referring to the appropriate
ICE-B 2009 - International Conference on E-business
40
subgroup (SGID). Since the shop system supported
URL rewriting (hence URLs contained the SGID),
users who bookmarked the site and deleted the
cookies could still be identified as belonging to a
particular subgroup. Furthermore the SGID was used
to communicate and use prices consistently
throughout the shopping process of the visitor, even
when cookies were not enabled by the user.
The first time the visitor saw the service charge
was in the electronic basket. Therefore the
conversion rate for each subgroup was not
determined as the plain ratio of buyers to total
visitors but as the ratio of buyers (with a certain
SGID) to visitors (with the same SGID) who entered
the electronic basket at least once during their
session and so were able to see the service charge (in
the following chapter this value is referred to as
CR
Basket
).
The first phase (including project set-up,
software design and implementation as well as
internal communication and preparation) took about
six weeks. The first part of the live phase took about
6 days, the second part about 3 weeks. Results were
presented 3 months after the beginning of the
project.
Alongside the technical requirements there are
also organizational ones. Obviously price tests
should be managed by the department/ people
responsible for price management in the company
taking into account what the limits with respect to
strategic positioning and competitors are.
Furthermore, before starting the price test employees
who actively enter into contact with customers of the
website (especially service staff) or who are
contacted by customers need to be informed and
trained in how to deal with price enquiries by
telephone and email, canceling orders and possible
complaints about different prices caused by the price
test. In the latter case the service staff was asked to
communicate the display of different prices as a
technical error and to apologize by sending out a €5
gift certificate to the complaining visitor/ customer.
As long as the number of gift certificates sent out is
small it does not impact the price test.
5 RESULTS
Before the price test the service charge was €2.50
per order. At the beginning we decided to investigate
the price range between €0.00 and €7.50. In order to
be able to reach valid conclusions after a short
period of time it was decided to test four values for
the service charge (€0.00/ €2.50/ €5.00/ €7.50).
Following basic statistics with respect to the
necessary sample size, the required time period for
the test can be estimated by:
()
2
1
B
in Basket Basket
Test
B
CI
NCRCR
e
T
V
⎛⎞
−
⎜⎟
⎝⎠
≈
where N
Bin
is the number of subgroups (=4), CI is
the chosen confidence interval (=1 σ),
e
is the
allowed error (=1%), CR
Basket
is the ratio of buyers to
visitors who have seen the electronic basket (~40%,
as an approximate value before the price test was
carried out), and V
B
is the number of visitors seeing
the electronic basket per day (=1,500 per day, here
only a fraction of all visitors to the website
participated in the price test). A calculation using
company data from the field study leads to necessary
time period for the study T
Test
of 6.4 days. The price
test was carried out on 6 consecutive days and
yielded the following results.
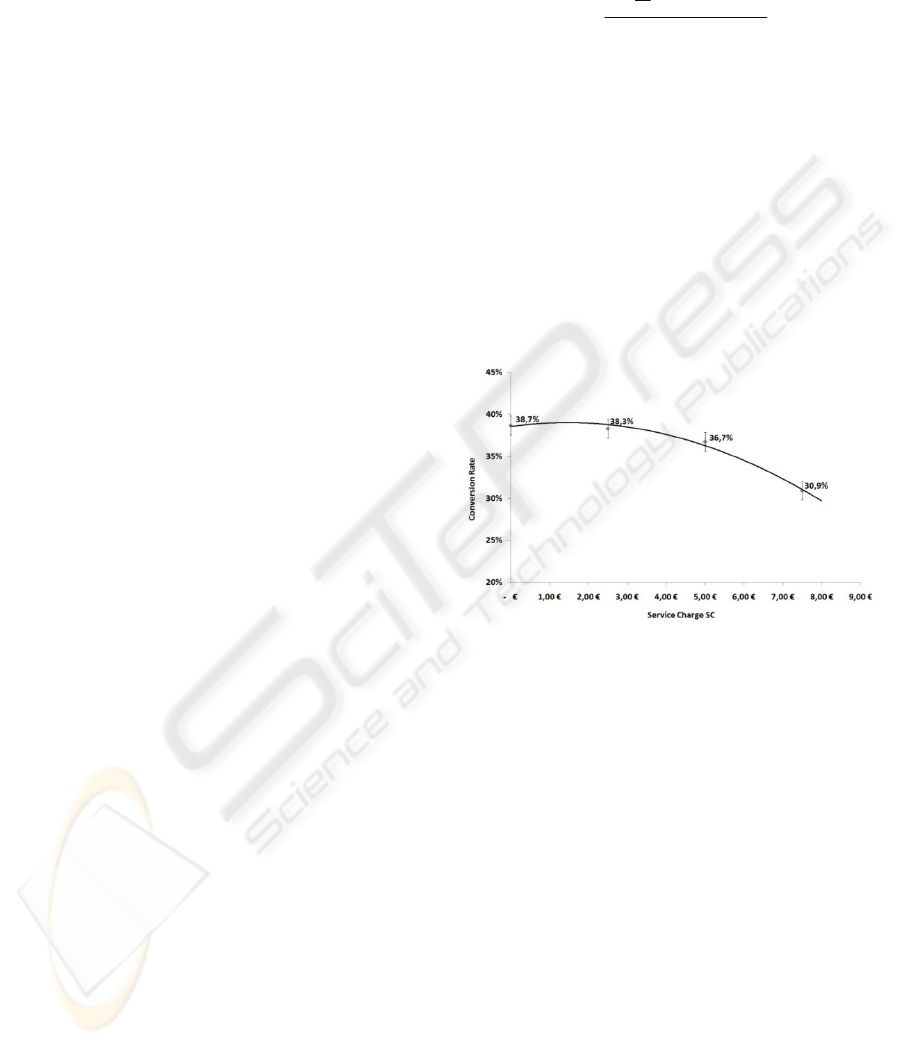
Figure 2: For each of the 4 subgroups there is one data
point shown in the figure above covering the range from
€0.00 to €7.50. The sample size is about 1,900 for each
data point and so the error is about +/- 1.1%, slightly
above the planned value of 1.0%, which is due to the fact
that the sample size turned out to be a bit lower than
expected.
5.1 Interpretation
Figure 2 shows the dependency of the basket
conversion rate CR
Basket
as a function of the service
charge SC. As expected, the conversion rate
decreases (statistically significant) with the service
charge, indicating the customer’s decreasing
willingness to pay the increasing service charge. It
should be emphasized that each data point (and the
corresponding samples) consists of sales with a wide
variety of products and a wide range of prices.
Nevertheless, allowing for standard deviation the
samples are identical. At this point the exact
functional dependency is not important for the
argument and thus we decided not to use theoretical
OPTIMIZING PRICE LEVELS IN E-COMMERCE APPLICATIONS - An Empirical Study
41

functions from microeconomics. For practical
purposes, in the field study the empirical data were
fitted using a second order polynomial function
CR
fit
:
32 3
( 2.2 0.6) 10 (6, 2 5.1) 10 (0, 385 0.008)
fit
CR SC SC
−−
=− ± ⋅ • + ± ⋅ • + ±
In order to find the optimal service charge the full
economics of the company under consideration had
to be taken into account. In this paper we initially
make the following simplifying assumptions (more
realistic assumptions would not change the main
results of the study): the service charge should be set
in such a way that it maximizes the average
contribution margin of a visitor who has seen the
electronic basket. We assume that the contribution
margin of a single order is given by CM
prod
+ SC –
C
S
, where CM
prod
is the average contribution margin
of the products sold in an average order and C
S
(=
€3.00) is the internal order fulfillment cost
(including e.g. postage, wages, machines). For our
analysis CM
prod
(= €18.00) is assumed to be
independent of SC, even though the average revenue
in a subgroup per visitor (and thus the contribution
margin) might be positively correlated with SC,
since it is likely that the willingness to accept a
higher service charge will rise with increasing
revenue. Formally, the problem is to find
:max
visitor
SC ACM
(
)
()
visitor fit prod S
A
CM CR SC CM C SC=−+
where ACM
visitor
is the average margin
contributed by each visitor who sees the electronic
basket at least once during his visit. Applying the
above values the optimal service charge is about
€5.50 compared to a service charge of €2.50 at the
beginning of the field study. By setting the service
charge to €5.50, the average contribution margin per
visitor ACM
visitor
could be increased by 7% from
€6.78 to €7.25.
5.2 Long-term Impact
The procedure described above optimizes the
contribution margin of an individual visitor with
respect to his first order. As an indicator for the
long-term impact on customer retention we use the
repeat buyer rate (what fraction of customers comes
back after their initial order?) for the respective
subgroups. It should be emphasized that the repeat
buyer rates were calculated only for the test period.
Figure 3: For each subgroup the fraction of buyers that
bought again during the test period is determined.
Figure 3 shows only a slight dependency of the
repeat buyer rate on the service charge. The slope of
the linear function in fig. 3 is 0.27 ± 0,31 % per
EUR and thus not significantly different from 0.
More data would be needed to prove or exclude such
a dependency. A negative correlation between the
repeat rate and the service charge would indicate
that some customers are willing to buy once at a
higher service charge but subsequently use
alternative offerings. In order to optimize long-term
profit this relationship would have to be taken into
account in future studies.
5.3 Customer Complaints
During the study there were less than 10 complaints
from customers by email and telephone related to
the observation of different prices. The majority of
these complaints came from existing customers who
knew the original service charge and first noticed the
supposed increase after ordering. These customers
were not told the reason for the change but instead
received a €5.00 gift certificate. The overall
complaint rate was lower than that expected at the
beginning of the field study and had no influence on
the outcome.
6 CONCLUSIONS AND FURTHER
WORK
This paper deals with one of the fundamental
questions in economics: what is the optimal price of
products and services? The method described in this
paper enables e-commerce companies to determine
the exact demand curve represented by the
conversion rate as a function of price. The accuracy
of this method is only limited by statistical means.
The field study shows that employing the method
ICE-B 2009 - International Conference on E-business
42

involves only limited expense and effort while
significantly increasing the profitability of the
company under consideration.
There is a large body of research around the
topic of price dispersion in the Internet but only a
limited amount of work has gone into studying what
are the resulting degrees of freedom for companies
and how they should use them. This paper opens
substantial opportunities for future studies on this
topic. Research questions include for example: (i)
How does the demand curve change over time? (ii)
What impact do the brand awareness of a company
and the uniqueness of its products have on the
demand curve? (iii) What kinds of reciprocal
dependencies are there between price components of
an order (Hamilton 2008)? (iv) Can user groups be
identified that demonstrate varying degrees of
willingness to pay? (v) Do we have to take customer
life time value into account when optimizing the
long-term profitability?
This paper is meant as a starting point for
discussion and further research related to optimizing
prices in e-commerce by determining the exact
demand curve for products and services in different
circumstances.
ACKNOWLEDGEMENTS
The comments from the unknown referees are
gratefully acknowledged.
REFERENCES
Baker, W. L., Lin, E., Marn, M. V., Zawada, C. C.,
Getting prices right on the Web, McKinsey
Quarterly, no. 2, p. 54-63, 2001
Baye, M. R., Morgan, J., Scholten, P., Price Dispersion in
the small and in the large: evidence from an internet
price comparison site, Journal of Industrial
Economics, vol. 51, no. 4, p. 463-496, 2004
Böhme, R., Koble, S., Pricing Strategies in Electronic
Marketplaces with Privacy-Enhancing Technologies,
Wirtschaftsinformatik, vol. 49, no. 1, p. 16-25, 2007
Bock, G. W., Lee, S.-Y. T., Li, H. Y., Price Comparison
and Price Dispersion: Products and Retailers at
Different Internet Maturity Stages, International
Journal of Electronic Commerce, vol. 11, no. 4, p.
101, 2007
Brynjolfsson, E., Smith, M. D., Frictionless Commerce? A
Comparison of Internet and Conventional Retailers,
Management Science, vol. 46, no. 4, p. 563-585, 2000
Chernev, A., Reverse Pricing and Online Price Elicitation
Strategies in Consumer Choice, Journal of Consumer
Psychology, vol. 13, no. 1, p. 51-62, 2003
Daripa, A., Kapur, S., Pricing on the Internet, Oxford
Review of Economic Policy, vol. 17, p. 202-216, 2001
Hamilton, R. W., Srivastava, J., When 2 + 2 Is Not the
Same as 1 + 3: Variations in Price Sensitivity Across
Components of Partitioned Prices, Journal of
Marketing Research, vol. 45, no. 4, p. 450-461, 2008
Hann, I.-H., Terwiesch, C., Measuring the Frictional Costs
of Online Transactions: The Case of a Name-Your-
Own-Price Channel, Management Science, vol. 49, no.
11, p. 1563-1579, 2003
Kannan, P.K., Kopalle, P., Dynamic Pricing on the
Internet: Importance and Implications for Consumer
Behavior, International Journal of Electronic
Commerce, vol. 5, no. 3, p. 63-83, 2001
Knoop, M., Effective pricing policies for E-Commerce
Applications – a field study, internal thesis, University
of Applied Science Lüneburg, 2004
Odlyzko, A., Privacy, economics, and price
discrimination on the Internet, in Proceedings of the
5th international conference on Electronic commerce,
ACM, p. 355-366, 2003
Patzer, G. L., Experiment-Research Methodology in
Marketing: Types and Applications. Westport,
Connecticut: Quorum/Greenwood, 1996
Roth, A. E., Ockenfels, A., Last-Minute Bidding and the
Rules for Ending Second-Price Auctions: Evidence
from eBay and Amazon Auctions on the Internet, The
American Economic Review, vol. 92, no. 4, p. 1093-
1103, 2002
Simon, H., Dolan, R. J., Power Pricing: How Managing
Price Transforms the Bottom Line, The Free Press,
New York, 1996
Spann, M., Skiera, B., Schäfers, B., Measuring individual
frictional costs and willingness-to-pay via name-your-
price mechanisms, Journal of Interactive Marketing,
vol. 18, no. 4, 2004
OPTIMIZING PRICE LEVELS IN E-COMMERCE APPLICATIONS - An Empirical Study
43
