
IDENTIYING HOMOGENOUS CUSTOMER SEGMENTS FOR
LOW RISK EMAIL MARKETING EXPERIMENTS
George Sammour, Benoît Depaire, Koen Vanhoof and Geert Wets
Transportation Research Institute, Hasselt University, Wetenschapspark 5 bus 6
3590 Diepenbeek, Belgium
Keywords: Email marketing, Permission marketing, Response rate, Click rate.
Abstract: Research in email marketing is divided into two broad areas spam and improving response rate. In this
paper we propose a methodology which allows companies to experiment with their email campaigns to
increase the campaigns’ response rate, This methodology is particularly suited for companies that are
reluctant to experiment with their customer’s data fearing a drop of the response rate due to unsuccessful
changes of the email campaign. The goals of this research have been achieved in two steps. Firstly,
homogenous groups of customers are identified, eliminating largely any hindering heterogeneity. Secondly,
customers that are not clicking and/or having a low click rate within their homogenous groups are identified.
1 INTRODUCTION
Although practitioners and academics have
identified key success factors and key barriers to the
development of an effective email campaign, few
have attempted to apply existing theories and
models. Similarly, although email marketing studies
have been conducted either by online surveys, by in-
depth interviews, by controlled experiments or by
tracking behaviour patterns such as click-through
links and the visiting patterns, few research have
investigated the effects of email characteristics on
consumer attitudes and behavioural intentions.
There are two types of research in email
marketing. The first includes focus specifically at
reducing spam from a wide range of perspectives.
The second includes studies from the marketing
literature that examine factors which affect and
improve response rates, open rates and click rates for
email marketing campaigns. The focus of this
research will be situated in the second stream of
email marketing research.
The context of this research falls in the first
category of email marketing, which is improving
response rate as we will analyze data of email
campaigns sent to customers to increase response
rate.
There exist some research which builds models
to improve response rate by using individual
preferences to personalize email newsletters through
collecting and analyzing such information.
Marketing campaigns and products can be
customised to appeal better to groups of customers,
or the individual. Recent studies look specifically at
email communication. For example, a model of
online clicking behaviour by Ansari and Mela,
attempts to predict and improve response rates for
email communications (Ansari and Mela, 2003).
Another proposed technique is permission
marketing (Godin, 1999), which seeks permission in
advance from consumers to send marketing
communications. Consumers provide interested
marketers with information about the types of
advertising messages they would like to receive. The
marketers then use this information to target
advertisements and promotions. The aim is to
initiate, sustain and develop a dialogue with
customers, building trust and over time stimulating
the levels of permission, making it a more valuable
asset (Kent & Brandal, 2003). Permission marketing
has three specific characteristics that set it apart
from traditional direct marketing (Godin, 1999)
Anticipation, Personalization and Relevance.
With email marketing, using preferences stated
by customers to select email content can be
straightforward and based on common sense.
However, there might be other customer-related
factors, besides content matching stated preferences,
which have an influence on the customer’s open and
click behaviour. However, most companies are
reluctant to experiment with their email campaigns
because they fear that the response rate will drop due
89
Sammour G., Depaire B., Vanhoof K. and Wets G. (2009).
IDENTIYING HOMOGENOUS CUSTOMER SEGMENTS FOR LOW RISK EMAIL MARKETING EXPERIMENTS.
In Proceedings of the 11th International Conference on Enterprise Information Systems - Software Agents and Internet Computing, pages 89-94
DOI: 10.5220/0001987200890094
Copyright
c
SciTePress

to wrong experimenting. What we need is a
methodology which allows experimenting with
email campaigns yielding a high potential of
increasing response rate levels while at the same
time lowering the risks of detrimental effects due to
unsuccessful experimenting. In this article we
propose such methodology.
2 METHODOLOGY
The main idea is to identify homogenous groups of
customers which are not/low responding to email
campaigns. Because of their current low response
level, these groups of customers have a high
potential to increase the overall response rate, at the
same time, experimenting with these groups has a
low risk of decreasing the response rate if
experiments fail, Identification of such groups is
achieved in two steps:
• Find homogenous groups of customers based on
socio-demgraphic or other type of customer
information.
• Segment customers within each homogenous
group based on their response/open/click rates.
Both steps are accomplished through the use of
data mining techniques. Data mining can be defined
as the nontrivial process of identifying valid, novel,
potentially useful and ultimately understandable
patterns in large amounts of data (Fayyad et al,
1996). Depending on the objective of the research,
two major categories of data mining can be
recognized predictive and descriptive techniques.
For the first step of finding homogenous groups
of customer we opted for the descriptive data mining
technique of cluster analysis. This technique seeks to
separate data elements into groups or clusters with
similar characteristics, such that both homogeneity
of elements within clusters and the heterogeneity
between clusters are maximized (Hair et al, 1998).
This step is important because heterogeneity can
hide real effects: applying changes to marketing
campaigns for a heterogeneous group of customers
might work for some part while be detrimental to
another part resulting in a zero net result.
Cluster analysis has been applied in a wide
variety of fields, (Everitt et al, 2001). According to
Fraley and Raftery (2002) cluster analysis is based
on heuristics that try to maximize the similarity
between in-cluster elements and the dissimilarity
between inter-cluster elements. These similarity-
based clustering techniques use a specific distance
function for elements with qualitative features. For
elements consisting of both continuous and
qualitative features, a mapping into the interval (0,1)
can be applied such that a distance measure can be
used. Among the similarity-based techniques, two
major approaches can be detected, namely the
hierarchical approach (i.e. Ward’s method, single
linkage method) and the partitional approach (i.e. K-
means. Following the maximum likelihood
approach, the unknown parameter vector is often
estimated by means of the expectation-maximization
algorithm. Outliers are handled by adding one or
more classes, representing a different multivariate
distribution for outliers (Fraley and Raftery, 2002).
After finding homogenous groups of customers
based on customer-related information, we analyse
each cluster in search for non-clicking or low-
clicking customers segments. This is done by means
of Decision Trees (DT). Decision trees are mainly
used for classification of unknown cases, but in the
scope of this research we used DT as a segmentation
technique to segment existing known cases
according to the criteria defined by the class
variable, which will be Click criteria.
Decision tree learning is a method for
approximating discrete-valued target functions, in
which the learned function is represented by a
decision tree. It performs many tests and then tries to
arrive to the best sequence for predicting the target.
Each test creates branches that lead to more tests,
until testing terminates in a leaf node. The path from
the root to the target leaf is the rule that classifies the
target. The rules are expressed in if-then form (J.
Quinlan, 1992).
Decision trees have obvious value as both
predictive and descriptive models. Prediction can be
done on a case-by-case basis by navigating the tree.
More often, prediction is accomplished by
processing multiple new cases through the tree or
rule set automatically and generating an output file
with the predicted value or class appended to the
record for each case.
Given the properties and nature of classification
of decision tree algorithms and the nature of our
data, as discussed in the next section, we decided to
use the C4.5 decision tree algorithm. C4.5 is not
restricted to binary splits and it produces a tree of
more variable shape. C4.5 algorithm uses the fact
that each attribute of the data can be used to make a
decision that splits the data into smaller subsets.
It should be noted that decision trees are mainly
used for classification of unknown cases, but in the
scope of this research we used DT as a segmentation
technique. DT will segment the set of known
customers into groups with similar values for the
class variable, which will be any response-related
criteria. It should also be noted that due to our
exploratory use of DT, we are less interested in the
generalisation power of the learned model. The DT
model will merely allow us to identify once again
ICEIS 2009 - International Conference on Enterprise Information Systems
90
homogenous groups of customers with a low
response level to email campaigns.
3 DATA
The data collected contains information on 32
weekly electronic newsletters during the period from
June 2007 until the end of January 2008, from a
customer of Ideaxis that is using the ADDEMAR®
platform. The content of the newsletters is divided
on the basis of six areas of interest; these areas of
interest are wine, Recipes, new products,
promotions, health & bio- products and member
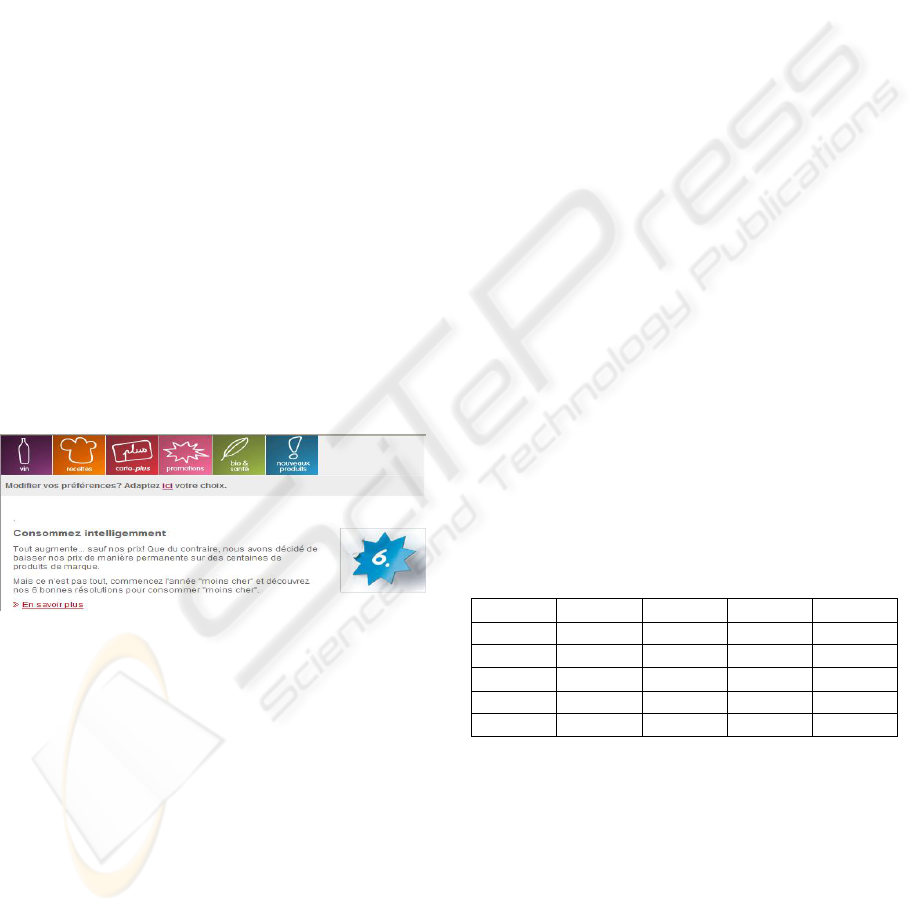
cards. The layout of the newsletter is depicted in
Figure 1, as shown on top of the newsletter the six
areas of interest are listed and for each consumer
only the areas he has chosen will be enabled. On
registration, subscribers can choose the relevant
areas of interest.
The content of the newsletter is automatically
personalized for each recipient. Also, it is possible
for consumers to choose the format of the newsletter
so the subscriber has the choice of a simple text
email or an HTML email. The downside to text
emails is that they are not measurable in terms of
open rate (Walrave, 2004), so the open rate will not
be considered in this study with regards to
customers.
Figure1: Campaign newsletter layout.
The number of contacts is 31,385 whose 19,609
of them is Dutch-speaking (NL) and 11,776 are
French-speaking (FR) customers. In the scope of this
study only the Dutch speaking customers are studied
for the sake of homogeneity in the data, and that the
Dutch speaking customers are almost 63% of the
overall contacts, furthermore after analyzing those
customers we found out that not all of them received
the same number of newsletters since some
consumers subscribed late, so we filtered out
customers who received all 32 campaigns, which
result in a 1172 customers (n=1172). For each
customer we collected information such as, gender,
email format, interests, number of interests, total and
total emails clicked, after that we calculated the click
rate for each customer, furthermore, for
segmentation purposes, we categorized the click
rates to non-click, low-click and high-click rates.
4 EXPERIMENTS AND RESULTS
As stated in our problem statement, the focus of this
study is to identify homogenous segments of
customers which are not responding and/or having a
low-click profile to the email newsletters.
4.1 Cluster Analysis
As outlined in the methodology, we start with
performing a cluster analysis to remove big parts of
heterogeneity in our data. We performed a Latent
Cluster Analysis by means of the software
LatentGold®, version 2.0.9, and used the values of
BIC, AIC and CAIC to choose the optimal number
of clusters. These statistical figures measure the
model fit, and alongside correct for the model’s
complexity (a lower score is better).
Customers’ interests were used as indicators or
attributes for clustering customers into homogenous
groups, choosing 2-6 clusters. We summarize the
results in Table 1, the results shows that the values
of BIC, AIC and CAIC first goes down when adding
more clusters, but at a certain points starts to
increase. For all three statistics, the minimum is
reached at the 3-cluster model. So, as the values of
BIC, AIC and CAIC suggest, the 3-cluster model is
the best model. It has the best trade off between
model complexity and model fit.
Table 1: Cluster analysis results comparing BIC, AIC and
CAIC values.
Model
L² (LL) BIC AIC CAIC
2-cluster
236.874 -116.406 136.874 -166.406
3-cluster
121.673 -182.148 35.6732 -225.148
4-cluster
121.657 -132.704 49.6579 -168.704
5-cluster
28.4444 -176.458 1989.76 2195.99
6-cluster
18.6379 -136.805 1993.95 2242.64
Next, we want to identify each cluster as a
specific type of customer. To define each cluster we
used the 50% rule. If customers have a probability
larger than 50% of having a specific interest, we
state that customers of that cluster are interested in
the related topic. Table 2 shows that the first cluster
or group of customers is interested in receiving
newsletters related to recipes, the second group is
interested to receive newsletters with topics about all
6 topics, and the third group are interested in all
topics except promotions and member cards.
IDENTIYING HOMOGENOUS CUSTOMER SEGMENTS FOR LOW RISK EMAIL MARKETING EXPERIMENTS
91
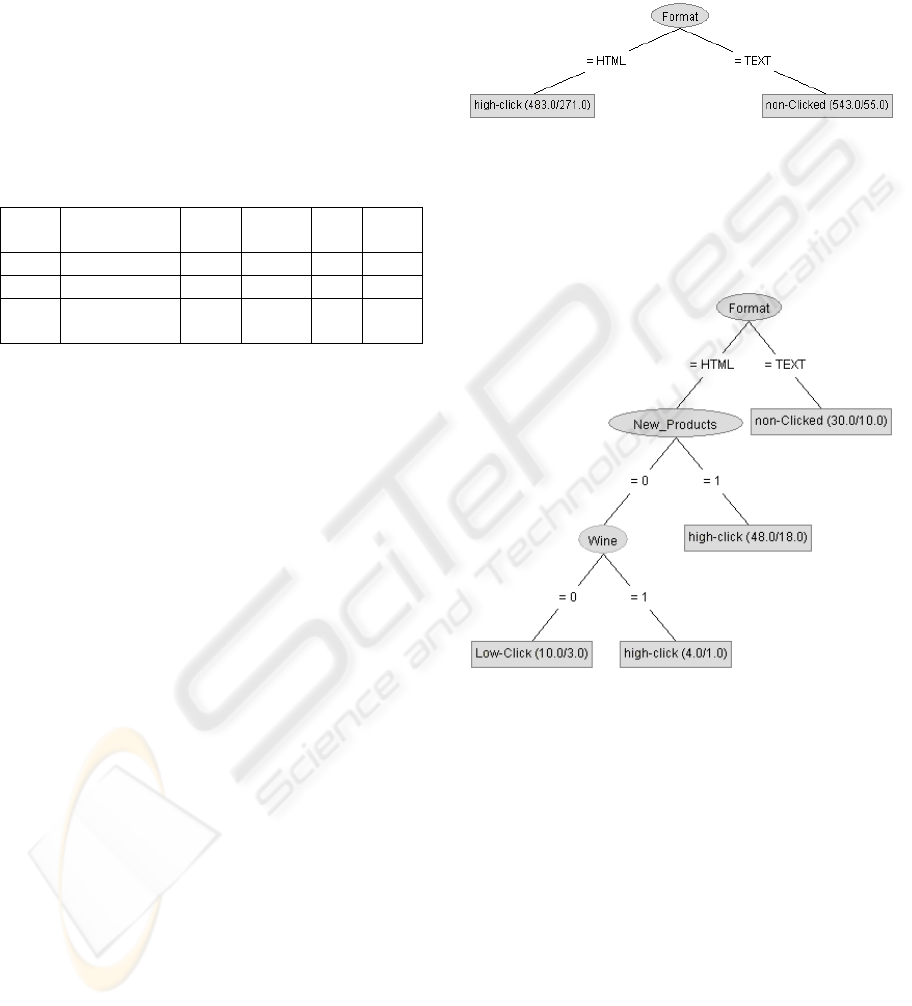
Table 2 summarizes the distribution of
customers across the clusters with some extra
statistical information about the distribution of our
areas of study within groups of customers. As we
can see the majority of customers are in the first
cluster. Furthermore, an interesting figure in table 2
is the distribution of email format (HTML and
TEXT). More than half of customers in cluster 1
prefer a text-formatted email, while customer in
cluster 2 and 3 prefer an HTML formatted email.
Table 2 also reveals that customers of cluster 1 have
a much lower click rate than customers of cluster 2
and 3.
Table 2: Statistical information of customers in Clusters.
The fact that customers of cluster 1 are only
interested in 1 single topic, indicate that these
customers are most likely less or not interested in
email marketing. Unluckily for this company, this is
the largest cluster. Therefore, these results on its
own already provide useful information for the
company with regards to their current email
marketing campaign. It’s clear that they should
focus on customers of cluster 1 in the first place.
4.2 Decision Tree Analysis
The second step of our methodology performs a
decision tree analysis for each cluster in order to find
homogenous segments of customers with a low/non
clicking profile. To this end, we categorized the
click rate into three categories, i.e. non-click, low-
click and high click and we will use this
categorized variable as the DT class variable. Click
rate was categorized as follows: customers who have
click rate evaluated to zero have a non-click criteria,
customers who have a click rate less than 10% are
categorized as low-click, and finally customers
having a click rate more than 10% are categorized as
having a high-click profile. Besides, having the click
criteria as the class variable, we used the gender,
email format, interests, and the period of time the
customer opened the emails variables as attributes to
build the decision trees.
Figure 2 shows the decision tree for customers of
cluster 1 (customers interested in recipes) and
illustrates that these customers can be divided into
two groups, i.e. a first group of 543 customers which
chose to receive TEXT format emails and a second
group of 483 customers which preferred an HTML
email. It also shows that 488 out of 543 customers,
who preferred a TEXT email, are not responding to
emails, while the other 55 customers are low-
clicking customers (note that this can’t be seen on
the figure).
Figure 2: Decision Tree for cluster 1.
This segment of customers is perfect to
experiment with. In the worst case you could turn 55
customers from low-clicking into non-clicking, but
in the best case, you could turn 488 customers into
low or even high clicking customers.
Figure 3: Decision Tree for cluster 2.
Figure 3 shows the decision tree for customers
belonging to the second cluster, which forms almost
8% of all customers. The DT shows two customer
segments which are good candidates for
experimenting with. Firstly, there is the group of
customers which preferred a TEXT email; this group
of 30 people have 20 customers which are not
responding to emails, while the other 10 have low-
click behaviour. Secondly, there is a group of
customers which prefer HTML emails and have no
interest in information about new products or wine.
This group of 10 customers contains 7 low clicking
customers are interested in receiving newsletters
related to recipes identified by clustering.
Finally, for cluster 3, there are three candidate
groups for experimenting. In contrast with the
previous two clusters (Figure 4), we can now
Cluster
No.
Description percent HTML
TEX
T
Click
Rate
1 Rrecipes 87% 47% 53% 6.1%
2 All Categories 8% 67% 33% 16.7%
3
Promotions and
member cards
5% 74% 26% 9.9%
ICEIS 2009 - International Conference on Enterprise Information Systems
92
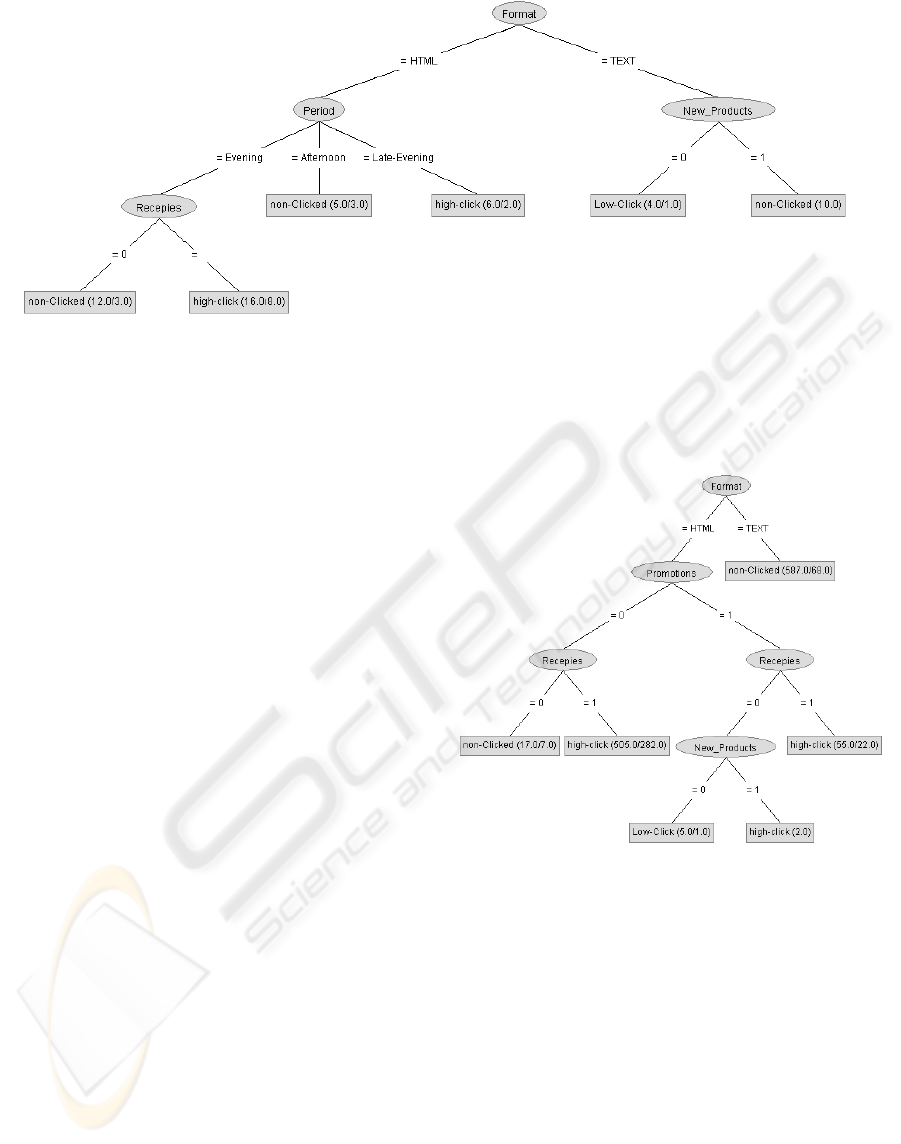
Figure 4: Decision Tree for cluster 3.
identify two different groups among the customers
which preferred a TEXT email. Among these
customers, we can discern between those which
prefer information about new products and those
which don’t. The first group contains 10 customers,
which are all non-clicking. This group is a perfect
experimenting group as you can not decrease the
overall click rate by experimenting. The other group,
which is not interested in information about new
products, contains 4 customers from which 3 are low
clicking. Note that this might be considered a too
small group for experimenting. One could decide
though to group them with customers which are
interested in new products. Furthermore, among the
customers which are receiving HTML emails, an
interesting experiment group are those which receive
the newsletters in the afternoon and are not
interested in Recipes. This group contains 12
customers among which 9 are not clicking any links
inside the newsletters.
What is interesting in the DT for all customers is
that customers interested in Recipes have a high-
click rate; this explains the first group of customers
who are interested in receiving newsletters related to
recipes identified by clustering.
4.3 Recommendations
The objective of this research is to identify
homogenous groups of customers which are good
candidates to experiment with in order to increase
the overall response rate. One could of course
always experiment with those customers which
currently are not/low clicking any emails. However,
this would not lead to homogenous groups and the
heterogeneity present could obscure the effects of
the experiments. For this reason we suggest the
methodology outlined above. The fact that all three
clusters reveal a different decision tree indicates the
benefit of the clustering step. Figure 5 shows the
decision tree when performed on all customers, i.e.
without a prior clustering step.
Figure 5: Decision Tree for All Customers.
It’s clear that it identifies less potential
experimenting segments. Based on the results of our
analysis, we can formulate the following
recommendations:
• Convince customers of cluster 1 (i.e. only
interested in recipes) to change their choice of
receiving TEXT emails to receive HTML
emails. This proves the fact that TEXT format
emails are not motivating because it does
contain images or videos.
• Filter out customers which receive HTML
newsletters and who are likely to be interested
in all categories (cluster 2). Try to change the
layout or other aspects of the newsletters for
this group of customers
IDENTIYING HOMOGENOUS CUSTOMER SEGMENTS FOR LOW RISK EMAIL MARKETING EXPERIMENTS
93

• Change the sending time of newsletter for
customers of cluster 3 receiving HTML emails
from afternoon to late evening.
• Change the sending time of newsletter sent in
the evening for customers of cluster 3 which
are not interested in recipes to the late evening.
5 CONCLUSIONS AND FUTURE
WORK
In this paper, we analysed and examined customers
receiving weekly newsletters as a part of an email
marketing campaigns, the data studied was from a
leading email marketing solution provider in
Belgium, the aim of our study is to identify
customers who have non/low-click behaviour to
allow companies to experiment with those
customers. Our methodology of analysis has been
performed in two steps, first by identifying
homogenous groups of customers according to
interests, and step two by applying decision tree
analysis as a segmentation technique for each cluster
using the click rate categorized as the class variable.
After identifying target customers to be
experimented for increasing the response rate, we
recommended some actions to be taken to those
customers. The future work will be to set up
experiments for the identified candidate groups and
to evaluate the effect of these experiments on the
overall click rate.
REFERENCES
Ansari Asim, Mela Carl F. E-customization. J Mark Res
2003;40(2):131–46.
Arabie, P., Hubert, L.J., 1994. Cluster Analysis in
Marketing Research. In Advanced Methods of
Marketing Research, R.P. Bagozzi ed. Oxford:
Blackwell, 160-189.
Everitt B., Landau, S., Leese, M., 2001. Cluster Analysis.
Arnold. 22
Fayyad, U.M, Piatetsky-Shapiro, G., Smyth, P.,
Uthurusamy, R. (Eds.), Advances in Knowledge
Discovery and Data Mining. AAA1 Press/The MIT
Press, pp 1-34.
Fraley, C., Raftery, A.E., 2002. Model-based clustering,
Discriminant Analysis, and Density Estimation.
Journal of the American Statistical Association 97
(458), 611-631.
Godin, S. (1999). Permission marketing: Turning
strangers into friends and friends into customers. New
York: Simon Schuster.
Godin, Seth (2000), “Permission Marketing,” Credit
Union Executive, 41 (January), 42.
Goldman Eric.ACoasean analysis of marketing.Wis Law
Rev 2006;6(4):1152–221.
Goodman Joshua, Heckerman David, Rounthwaite Robert.
Stopping spam. Sci Am 2005;292(4):42–5.
Gratton E. Dealing with unsolicited commercial emails: a
global perspective. J Int Law 2004;7(12):3–13.
Green, P.E., 2004. Practice makes perfect. Marketing
Research 16 (2), 8-14.
Han, Y., Hu, C., Bal, B., & Jang, S. (2005). Marketing
hospitality and tourism education on the Internet: An
analysis of e-relationship marketing features. Journal
of Hospitality and Tourism Education, 17(1), 11–22.
Hair J. F. Jr., Anderson, R.E., Tatham, R.I., Black, W.C.,
1998, Multivariate Data Analysis, Prentice Hall.
Jiang, D., Tang, C., Zhang, A., 2004. Cluster analysis for
gene expression data: a survey. IEEE Transactions on
Knowledge and Data Engineering 16 (11), 1370-1386.
J. Ross Quinlan , 1992, C4.5 programs for machine
learning, Morgan Kaufmann Publishers, ISBN: 1-
55860-238-0.
Hartigan, J., 1975. Clustering Algorithms. Wiley.
Kent, R., & Brandal, H. (2003). Improving email response
in a permission marketing context. International
Journal of Market Research, 45(4), 489–503.
Krishnamurthy, S. (2001). A comprehensive analysis of
permission marketing. Journal of Computer Mediated
Communication, 6(2) available at:
/www.ascusc.org/jcmc/vol6/krishnamurthy.htmlS.
MacPherson, K. (2001). Permission based email
marketing that works!. London: Dearborn Trade.
McCloskeyW. 2006 retail white paper. New York, NY:
Email Data Source; 2006.
Moustaki, I., Papageorgiou, I., 2005. Latent class models
for mixed variables with applications in
Archaeometry. Computational Statistics and Data
Analysis 48 (3), 659-675.
Rust RT, Espinoza F. How technology advances influence
business research and marketing strategy. J Bus Res
2006;59:1072–8.
Seddon, J. (2000) ‘From ‘‘push’’ to ‘‘pull’’ — Changing
the paradigm for customer relationship
management’, Journal of Interactive Marketing, Vol 2,
No. 1, pp. 19–28
Simonson, I. (2005). Determinants of customers’
responses to customized offers: Conceptual framework
and research propositions. Journal of Marketing, 69,
32–45.
Stewart, David W. and Paul A. Pavlou (2002), “From
Consumer Response to Active Consumer: Measuring
the Effectiveness of Interactive Media,” Journal of the
Academy of Marketing Science, 30 (Fall), 376-396.
Walrave, M. (2004). Met uw Permissie: E-mailmarketing
en de opt-in regel. Antwerpen: De Boeck nv.
Vermunt, J.K., Magidson, J., 2005. Technical Guide for
Latent GOLD 4.0: Basic and Advanced. Belmont
Massachusetts: Statistical Innovations Inc.
ICEIS 2009 - International Conference on Enterprise Information Systems
94
