
Computer Aided Evaluation of
Upper Urinary Tract Obstruction
V. Neeman
1
, M. Hershko
1
, N. Reisner
1
, I. Leichter
1
G. Hidas
2
, D. Pode
2
and M. Duvdevani
2
1
The Jerusalem College of Technology, Jerusalem, Israel
2
Department of Urology, Hadassah – Hebrew University Medical Center Jerusalem, Israel
Abstract. The purpose of this study is to examine a method for quantitative
estimation of upper urinary tract clearance rate using conventional fluoroscopic
images. To obtain quantitative information proportional to the amount of
contrast media in the renal pelvis we used videodensitometric methods. The
semi-quantitative densitometry included normalization procedure, logarithmic
processing of the system response and non-specific density variations
removing. The method was tested by analyzing 7 nephrostogram and 3
retrograde pyelography studies. The clearance rate was estimated by measuring
the clearances curve in arbitrary units. Regression fitting of the clearances curve
by an exponential decay yielded a correlation coefficient of 0.94±0.02. The
integrated radio-density of the contrast media was found to decrease by 6±3%
per minute, and the area of the contrast agent in the renal pelvis decreased by
5±2% per minute. The radio-density measurements during the first 10 minutes
of the examination were sufficient to yield the overall exponential clearances
curve. It was concluded that this method will enable to estimate quantitatively
the degree of upper urinary tract obstruction by using only the initial phase of a
routine urological modality.
1 Introduction
Obstruction of the upper urinary tract is a common urological pathology that results
from obstructing stones, tumor or UPJ stenosis. Patients with this pathology are being
evaluated with intravenous urography, antegrade or retrograde ureterography using
sequential X-rays imaging to evaluate the contrast media clearance from the upper
urinary tract as a clue for obstruction. However, the diagnostic accuracy of this
method is debated due to its subjectivity. The purpose of this study is to evaluate an
image analysis method that will enable a quantitative estimation for the degree of
upper urinary tract obstruction, using conventional fluoroscopic images
When referring to the function of the kidney, clearance of a substance is the
inverse of the time constant that describes its removal rate from the body divided by
its volume of distribution. Renal clearance can be measured in steady state conditions
with a timed collection of urine and an analysis of its composition. Urine flow rate
was modelled theoretically by Dole [1] and modern modification and application of
this model for dialysis was described by Gotch [2]. In case of contrast agent clearance
from renal pelvis the generation rate and intake equals to zero. It follows that the
Neeman V., Hershko M., Reisner N., Leichter I., Hidas G., Pode D. and Duvdevani M. (2009).
Computer Aided Evaluation of Upper Urinary Tract Obstruction.
In Proceedings of the 1st International Workshop on Medical Image Analysis and Description for Diagnosis Systems, pages 24-30
DOI: 10.5220/0001815100240030
Copyright
c
SciTePress

differential equation, which models concentration of urea at the end of dialysis, is
applicable to describe the contrast media concentration in renal pelvis (upper urinary
tract clearance curve). Using these assumptions, the dialysis equation can be rewritten
in a form
KC
d
t
dC
V −=
(1)
where
V - volume of renal pelvis,
K - clearance rate,
C – average concentration of the contrast agent in the pelvis.
Assuming that the average concentration of the contrast agent in the pelvis is
proportional to the integrated radio-density of the contrast media, expression (1)
shows that the value of the clearance rate - K can be estimated experimentally by
using exponential fitting of the radio-density measurements as a function of time.
Digital imaging, which allows repetitive density analysis of the same region of
interest during the transit of contrast media, holds a potential to estimate the dynamic
characteristics of contrast dilution curves. This method, which is based on digital X-
ray subtraction angiography (DSA) has numerous advantages for the diagnosis,
monitoring and quantitative evaluation of blood flow and velocity in cardiological
practice [7]. However, temporal subtraction in cases of upper urinary tract sequential
X-rays imaging is more complex due to long time interval (minutes) between the two
subtracted images. Positioning and body habitus differences between images acquired
during urinary tract imaging make DSA problematic for being used in urography
practice. Parametric images have been used widely in nuclear medicine, and
somewhat more sparingly in X-ray CT. Gallagher have used parametric images [3] to
distinguish between transplant kidney rejection and acute tubular necrosis using renal
images obtained from digital fluoroscopy. Hackstein with coathors [4] present a
technique to measure kidney clearance of the applied contrast media by multiphase
helical CT by measurements the time density curve of the kidney after contrast media
application.
We assume that changes in the contrast material density in X-ray video-
fluoroscopy can be utilized to measure the upper urinary tract clearance rate. This can
be performed by analyzing the time dependence of the contrast media radio-density
measured in sequential images of the whole renal pelvis area. The indicator–dilution
approach (Stewart-Hamilton method) and the first-pass distribution analysis [5],[6]
are well investigated for blood flow and velocity measurements. We assume, that
these methods can be also used to calculate the contrast agent clearance rate.
2 Methods
In the present study we attempted to evaluate quantitatively the upper urinary tract
clearance rate using the sequences of images acquired in routine fluoroscopic imaging
of the upper urinary tract during pyelography. The fluoroscopic images were captured
after injection of the contrast agent by using the "last-frame-hold" mode of the C-Arm
(Phillips BV29) at 3 frames per second, with 2 frame averaging. The captured images
25
were ac
q
fluorosc
o
examina
t
injected
c
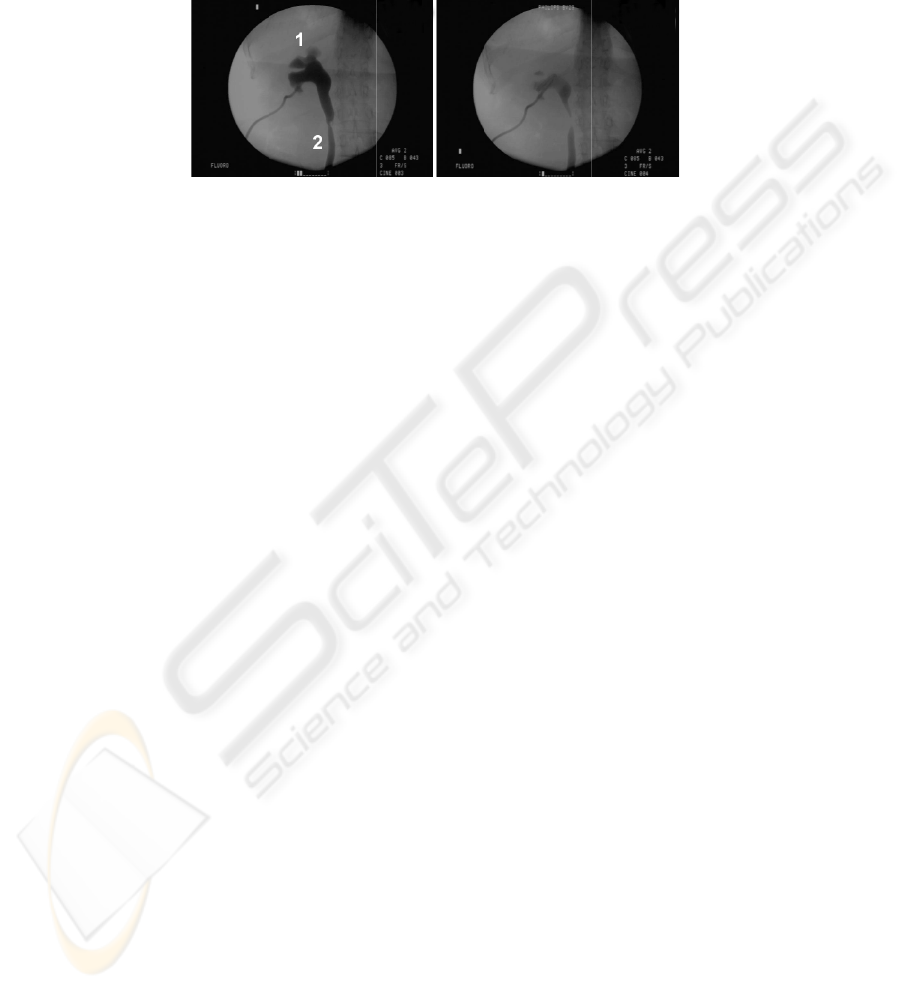
Fig. 1.
(1- the co
n
At a mo
r
in the p
demonst
r
contrast
a
In or
d
system r
e
utilized.
L
The se
m
logarith
m
variation
s
captured
view of
transfor
m
radiogra
p
different
agent co
samples,
Control
(
The loga
r
data to
d
tissue de
n
data obt
a
b
eginnin
g
The
s
contrast
a
method
m
utilized
a
q
uired with
a
o
pic images
t
ion. Figure 1
a
c
ontrast agent
Fluoroscopy
n
trast agent in
r
r
e advanced s
t
elvis is hig
h
r
ates the final
a
gent and the
d
er to estimat
e
e
sponse cali
b
L
inea
r
ization
m
i-quantitative
m
ic processin
g
s
. In order
with internal
the image i
n
m
ation functi
o
p
hic wedges
wedge steps
ncentration
s
compensates
(
AGC) perfor
m
r
ithmic proc
e
d
ensity value
s
n
sity and the
a
ined from t
h
g
of pyelogra
p
s
emi-quantita
t
a
gent concen
t
m
ust be prop
o
a
s an internal
s
a
resolution
of a right
a
demonstrat
e
was already
t
1a
images obt
a
r
enal pelvis, 2-
t
t
age of the e
x
h
er, but the
a
stage of the
e
area it occupi
e
the amount
o
b
ration and t
h
of the syste
m
densitometr
y
g
of the syst
to impleme
n
standard (th
e
n
tensifier. Th
e
o
n. The tra
n
of a constan
t
. The calibr
a
s
tandards. T
h
for Automat
i
m
ed by the
e
e
ssing of the
s
s
. Removing
o
X-ray scatter
e
h
e template i
m
p
hy prior to c
o
t
ive densito
m
t
ration in ar
b
o
rtional to
t
he
s
tandard.
of 720x576
kidney ca
p
e
s an initial st
a
t
ransported b
y
a
ined during
t
he ureter).
x
amination, t
h
a
rea it occu
p
e
xamination, i
n
es are reduce
d
o
f the contras
t
h
e semi-quan
t
m
response wa
s
y
approach i
n
em response
n
t these app
r
e
reference s
a
e
response l
i
n
sformation
f
t
step height
,
a
tion curve
w
h
e normalizat
i
c Brightness
e
lectronic cir
c
s
ystem respo
n
o
f a non-spe
c
e
d radiation)
m
age. The t
e
o
ntrast agent
i
m
etry approac
h
b
itrary units.
T
amount of t
h
pixels. Fi
g
p
tured durin
g
a
ge of the py
e
y
the urine to
t
1b
upper uri
n
h
e radio-densi
p
ies is alrea
d
n
which both
d
.
t
agent from t
h
t
itative densi
t
s
performed
f
n
cluded a n
o
and removi
n
r
oaches, fluo
r
a
mple) which
i
nearization
w
f
unction wa
s
,
and fitting
w
as obtained
ion procedu
r
Control (AB
C
c
uits to modi
f
n
se was perfo
r
c
ific density
v
was perform
e
e
mplate ima
g
i
njection.
h
was utilize
d
T
he density
v
h
e contrast ag
e
g
ure 1 displ
a
g
upper uri
n
e
lography, in
t
he ureter.
n
ary tract e
x
ty of the con
t
d
y reduced.
F
the radio-de
n
h
e acquired i
m
t
ometry appr
o
f
or calibration
o
rmalization
p
n
g non-speci
fi
r
oscopic im
a
was placed
i
w
as performe
d
s
calculated
the grey lev
e
by measurin
g
r
e, based on
C
) and Auto
m
f
y the system
r
med for scal
v
ariations (su
e
d by subtrac
t
g
e was obtai
n
d
for measur
i
v
alues obtain
e
e
nt. A brass
w
a
ys digital
n
ary tract
which the
x
amination.
t
rast agent
F
igure 1b
n
sity of the
m
ages, the
o
ach were
purposes.
p
rocedure,
f
ic density
a
ges were
i
n field of
d
using a
by using
e
ls of the
g
contrast
reference
m
atic Gain
response.
ing image
ch as soft
t
ion of the
n
ed in the
i
ng of the
e
d by this
w
edge was
26
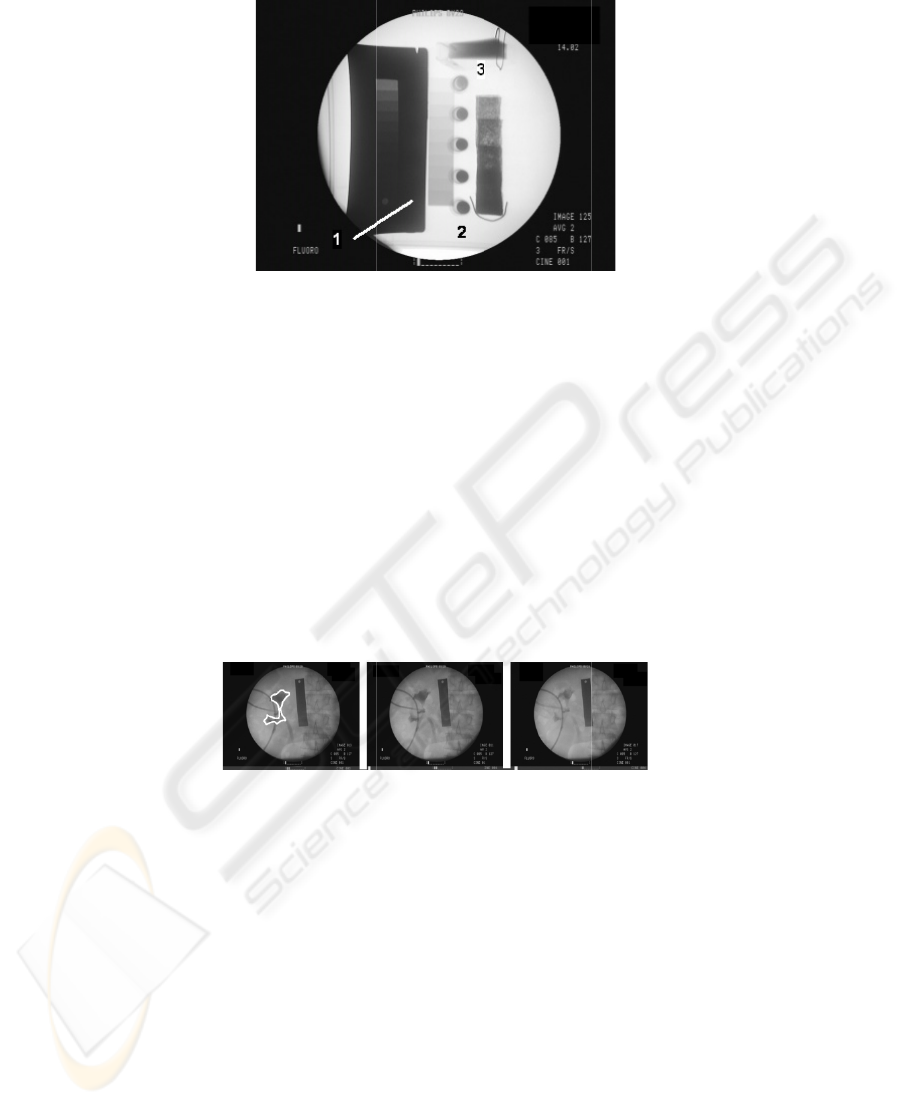
Fig. 2. A
height; 2
-
container
w
The syst
e
tested fo
r
fluorosc
o
filled pl
a
height; c
containe
r
Figur
e
image in
t
(ROIs)
w
the brass
figure an
examina
t
Imag
e
p
erform
segment
a
utilized.
T
of the
X
modellin
g
radio-de
n
fluorosc
o
In th
e
obstructi
o
The pati
e
2-5 mi
n
phantom imag
e
-
contrast agen
t
w
ith contrast a
g
e
m response
r
the differe
n
o
py image of
s
a
stic containe
r
ontrast agent
r
with a contr
a
e
3 shows im
t
ensifier. The
w
hich include
d
wedge. The
d, as can be
s
t
ion.
Fig. 3. Fluor
o
e
processing
p
renal pelvis
a
tion. In so
m
T
he image pr
o
X
-ray scattere
d
g
experiment,
n
sity of the
c
o
py images ac
e
current stu
d
o
n of the up
p
e
nts underwe
n
n
utes interv
a
e
obtained at a
t
probes with
g
ent of variabl
e
was measur
e
n
t X-ray expo
s
uch a phant
o
r
(water hig
h
probes with
a
st agent of v
a
ages acquire
d
image meas
u
d
the contras
t
ROI of the
c
s
een, its area
d
o
scopy images
o
p
rior to imag
e
tracing and
m
e cases, spa
t
o
cessing algo
r
d
radiation.
T
which simul
a
c
ontrast agen
t
quired during
d
y we analyze
p
er urinary tr
a
n
t contrast ag
e
a
l. Fluorosc
o
tube voltage
o
different hei
g
e
height).
e
d using rad
i
sures and ra
d
o
m, consistin
g
h
t of 20cm);
d
different hei
g
a
riable height.
d
with a brass
u
rements wer
e
t
agent in the
c
ontrast agen
t
d
ecreases gra
o
btained for se
m
e
analysis inc
l
to perform
t
ial calibrati
o
r
ithm include
d
T
he algorith
m
a
tes an exami
n
t
was measu
r
upper urinar
y
d 10 clinical
a
ct (7 nephro
e
nt injection
f
o
pic images
o
f 68 keV (1-
w
g
hts and con
c
i
o-densitomet
r
d
iation condit
i
g
of the follo
w
d
ifferent we
d
g
hts and con
c
wedge place
d
performed o
n
renal pelvis
a
t
in the renal
dually durin
g
m
i-quantitativ
e
l
uded image
e
background
o
n and imag
e
d
analysis of
t
m
was verifie
d
n
ation of the
u
r
ed in arbitr
a
y
tract exami
n
cases withou
t
stogram, 3 r
e
f
ollowed by
f
were acq
u
w
edges with co
n
c
entrations; 3-
r
ic phantom
s
i
ons. Figure
2
w
ing compon
e
d
ges with co
n
c
entrations; r
e
d
in field of
v
n
the regions
a
nd reference
pelvis is tra
c
g
the upper ur
i
e
densitometry.
e
nhancement
i
details dete
e
registration
t
he electronic
d
using phan
t
u
pper urinary
a
ry units for
n
ation.
t
known uro
m
e
trograde pye
l
f
luoroscopic i
m
u
ired with
n
stant steps
rectangular
s
and was
2
shows a
e
nts: water
n
stant step
e
ctangular
v
iew of an
of interest
region of
c
ed in the
i
nary tract
i
n order to
ction and
was also
noise and
t
o
m
-based
tract. The
all of the
m
echanical
l
ography).
m
aging of
controlled
27
roentgenographic conditions. The contrast agent clearance rate was estimated in
arbitrary units by exponential fitting of the integrated radio-density measurements as a
function of time.
3 Results
In order to obtain the clearance rate in absolute units (mg/min), the system response
linearization and calibration based on grey level matching was performed by using the
phantom represented in Figure 2.
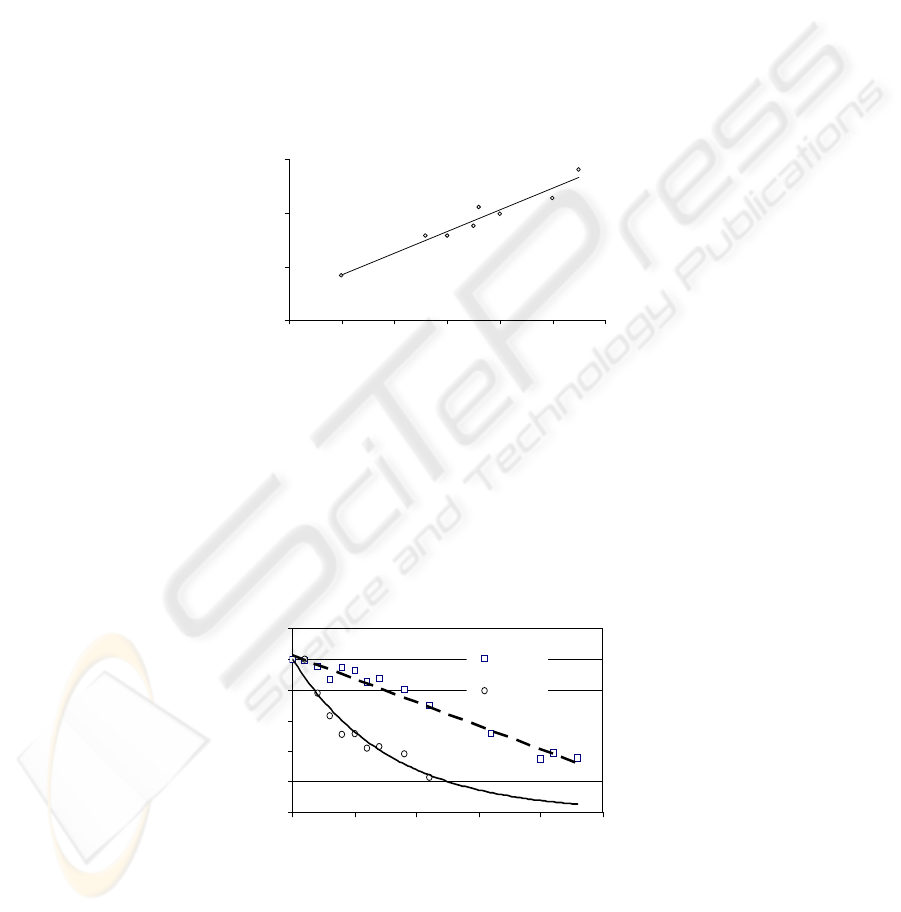
Figure 4 shows an example of a calibration curve obtained by using a brass wedge
as internal standard (reference sample). The grey levels of the various steps in the
brass wedge were calibrated to the grey levels of the contrast agent with known
concentrations per unit area, for a tube voltage of 72-84kV.
Fig. 4. Example of a brass wedge calibration curve.
Figure 4 demonstrates a significant deviation of the experimental data from the
regression line. A relatively low correlation coefficient was found and the calibration
accuracy was estimated to be 35%. This result demonstrates that system response
linearization and calibration are not sufficient for accurate clearance rate
measurements. But this approach is simple for implemention and can be utilized for
urinary tract obstruction detection in a clinical enviroment. According to the results
reported above, the clearance rate measurements in the present study were obtained
only by semi-quantitative densitometry method.
Fig. 5. Example of contrast agent clearance curves measured for a patient without upper urinary
tract obstruction.
0
20
40
60
0123456
Wedge step number
C,
mgI/mm
2
0
20
40
60
80
100
120
0 5 10 15 20 25
t, min
%
A %
ID
%
28
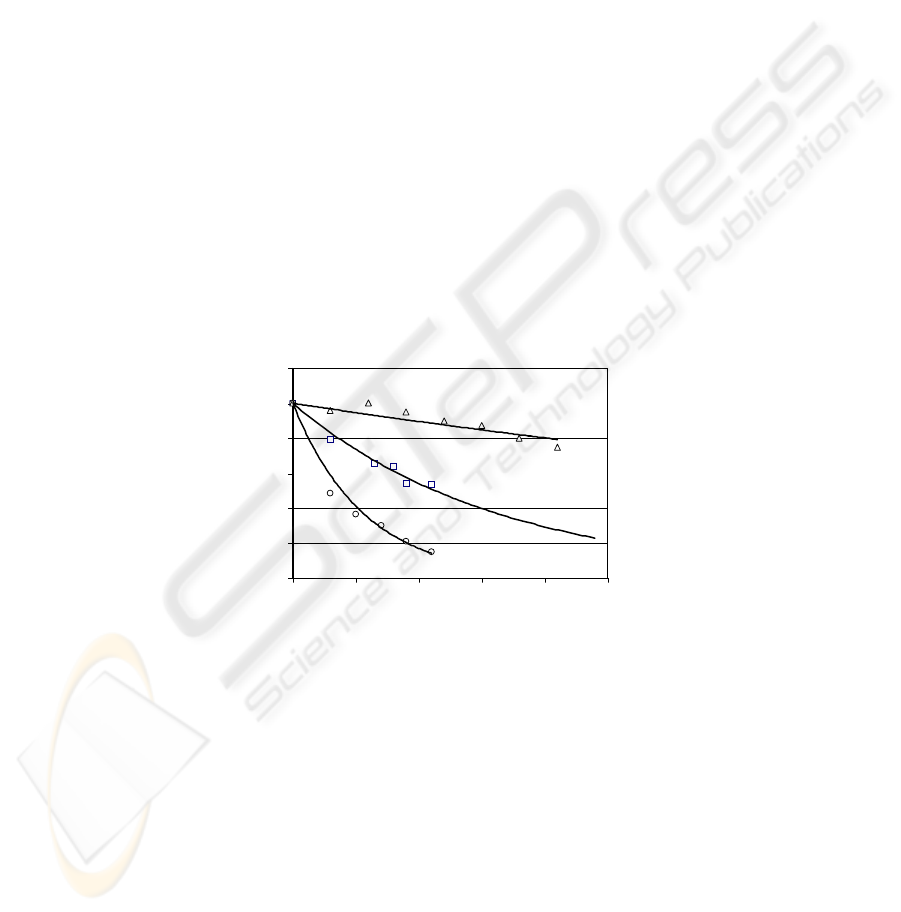
Figure 5 shows an example of clearance curves obtained by the semi-quantitative
densitometry approach. These curves represent the time dependence of the area of the
renal pelvis (A) filled with contrast agent, and time dependence of this area integrated
density (ID). Clearance curve measurements were performed during pyelography of a
patient without upper urinary tract obstruction. The value of area A and the value of
integrated density ID in the begining of the examination (the contrast agent occupied
all volume of a pelvis) were taken as 100%. The solid curve in Figure 5 represents
experimental data fitting of the integrated density and the dashed curve in Figure 5
represents data fitting of the area. The time dependence pelvis area was approximated
by a linear curve. The clearance curve was fitted by approximating an exponentially
decreasing time dependence of the integrated radio-density.
Regression fitting of the clearance curves displayed in Figure 5 yielded a
correlation coefficient of R
2
=0.97 for the area as a function of time and a correlation
coefficient of R
2
=0.96 for the density clearance curves. The time constant for the
density clearance curve was found to be 9.1 min, and contrast agent clearance rate in
arbitrary units (percents of contrast agent per minute) was found to be 0.11. Clearance
curves kinetic, similar to the one presented in Figure 5, was found in all the clinical
cases examined in the present study.
Figure 6 shows exponential fitting curves of the measurements for three patients.
Curves 1 and 2 represent patients for whom upper urinary tract obstruction was not
diagnosed, while curve 3 represents a patient with upper urinary tract obstruction. The
regression fitting of the experimental data for the case with upper urinary tract
obstruction yielded an exponential decay time constant of 52 min and a clearance rate
of 0.02 percent per minute.
Fig. 6. Example of clearance curves.
1.2 – Upper urinary obstruction was not diagnosed,
3 – Upper urinary obstruction.
4 Discussion
The purpose of the present study was to examine a method that uses conventional
fluoroscopic images to estimate quantitatively the degree of upper urinary tract
obstruction. Using sequences of images acquired during regular pyelography, the
dynamic characteristics of the contrast agent in the renal pelvis was quantitatively
analyzed to estimate the clearance rate of the upper urinary tract.
0
20
40
60
80
100
120
0 5 10 15 20 25
t, min
%
yy
3
2
1
29

The method was tested on 10 clinical cases without upper urinary tract
uromechanical obstruction. All patients underwent contrast media injection followed
by fluoroscopic imaging of 2-5 minutes interval. Semi-quantitative densitometry,
based on image normalization, was utilized to obtain information on the amount of
contrast media in the renal pelvis as a function of time. The clearance rate of the
contrast media was estimated in arbitrary units, by exponential fitting of the time-
dependence curves.
In all the investigated clinical cases, the clearance curves of the integrated radio-
density showed a similar kinetic trend. The integrated radio-density of the contrast
media decreased by 6±3% per minute, and area of contrast agent in the renal pelvis
decreased by 5±2% per minute. Exponential fitting of the density measurements
during the first 10 minutes of the test yielded a correlation coefficient of 0.94±0.02
with the clearances curve.
It was concluded that using the measurements during the initial phase of the
examination is sufficient to estimate the overall clearance rate of the injected contrast
material. This method will enable to estimate quantitatively the degree of upper
urinary tract obstruction, using a routine urological modality in clinical environments.
References
1. Dole, V., "Back-diffusion of urea in the mammalian kidney", American Journal of
Physiology, 139, 1943.
2. Gotch, F., "The current place of urea kinetic modelling with respect to different dialysis
modalities", Neprology Dialysis Transplantation, 13, Suppl 6, 1998.
3. Gallagher, J., Meaney, T., Flechner, S., Novic, A., Buonocore, E., "Parametric imaging of
digital subtraction angiography studies for renal transplant evaluation", Proc. S.P.I.E.,
314:229-234,1981
4. Hackstein, N., Puille, M., Bak, H., Scharwat, O., Rau,W., "Measurement of single kidney
contrast media clearance by multiphasic spiral computed tomography: preliminary results",
European Journal of Radiology, 39, 2001.
5. Hamilton, W., Moore, J., Kinsman, J., Spurlung, R., "Studies on circulation; Further
analysis of injection method and of changes in hemodynamics under physiological and
pathological conditions", American Journal of Physiology, 99, 1932.
6. Molloi, S., Bednarz, G., Tang, J., Zhou, Y., Mathur, T., "Absolute volumetric coronary
blood flow measurement with didital substraction angiography", International Journal of
Cardiac Imaging, 14, 1998.
7. Shpilfoygel, S., Close, R., Valentino, D., Duckwiler, G., "X-ray videodensitometric
methods for blood flow velocity measurement", Medical Physic, 27, 9, September 2000
30
