
ROBUST AUTOMATIC SEGMENTATION OF ANCIENT COINS
Sebastian Zambanini and Martin Kampel
Pattern Recognition and Image Processing Group, Vienna University of Technology, Favoritenstr. 9/1832, Vienna, Austria
Keywords:
Segmentation, Shape Description.
Abstract:
Nowadays, ancient coins are becoming subject to a very large illicit trade. Thus, the interest in reliable
automatic coin recognition systems within cultural heritage and law enforcement institutions rises rapidly.
Central component in the permanent identification and traceability of coins is the underlying image recognition
technology. Prior to any analysis a coin image has to be segmented into two areas: the area depicting the coin
and the area belonging to the background. In this paper, we focus on the segmentation task as a preprocessing
step for any automated coin recognition system. The objective is a robust segmentation procedure for a large
variety of coin image styles. We present a simple and fast method for coin segmentation, based on local
entropy and gray value range. Results of the developed algorithm are shown for an image database of ancient
coins and demonstrate the benefits of our approach.
1 INTRODUCTION
Traditional methods to fight the illicit traffic of an-
cient coins comprise manual periodical search in auc-
tions catalogues, field search by authority forces, pe-
riodical controls at specialist dealers, and a cumber-
some and unrewarding internet search, followed by
human investigation. Therefore, image-based meth-
ods to automatically recognize ancient coins have the
potential to increase their traceability to a high degree
and thus to help to combat their illicit trade.
For the image-based recognition of ancient coins,
initially a segmentation of the coin region is of out-
most importance. Especially for the identification of
stolen coins a correct segmentation is a crucial step
since the shape of the coin provides a substantial fea-
ture to identify a concrete coin specimen (Zaharieva
et al., 2007). An automatic segmentation method is
also of great benefit for the indexing of new coins
since up to now numismatists have to perform this
time-consuming task manually.
In the context described above, the methods have
to deal with images from various sources (e.g. mu-
seum collections or public online databases). There-
fore, no assumptions about image quality can be made
and major challenges that have to be faced in the seg-
mentation of coins are caused by an improper im-
age acquisition procedure. Especially shadow casts
caused by an insufficient illumination setup impede
the correct determination of the coin border. Further-
more, tests have shown that image compression with
chroma subsampling is often used when storing im-
ages of coins. The resulting compression artifacts
preclude the use of color information, thus only the
luminance can be used for a reliable segmentation of
the coins.
In this paper a simple and fast method for coin
segmentation based on local entropy and gray value
range is presented. The remainder of this paper is or-
ganized as follows. Related work and the coin seg-
mentation strategy itself are addressed in Section 2.
Experiments on a set of 92 images are reported in Sec-
tion 3. A conclusion is finally given in Section 4.
2 COIN SEGMENTATION
Coin segmentation deals with the division of the im-
age into two regions: the region depicting the coin
and the region belonging to the background. In (Za-
harieva et al., 2007) segmentation of ancient coins
was achieved using an adaptive thresholding method
originally suggested by (Yanowitz and Bruckstein,
1989). The proposed method derives a threshold sur-
face obtained by an interpolation of tie points placed
at thresholded gradient values. However, as demon-
strated in the experiments (Section 3), this method
fails if the coin images show a high variability.
Segmentation of present day coins was done in
273
Zambanini S. and Kampel M. (2009).
ROBUST AUTOMATIC SEGMENTATION OF ANCIENT COINS.
In Proceedings of the Fourth International Conference on Computer Vision Theory and Applications, pages 273-276
DOI: 10.5220/0001798302730276
Copyright
c
SciTePress
various papers. However, all of them make special as-
sumptions which are not satisfied in our image data:
(Reisert et al., 2006) apply the Hough transformation
for circle detection. By definition, this approach is not
applicable on ancient coins which likely show no per-
fect circularity. The global thresholding methods pre-
sented in (van der Maaten and Poon, 2006) and (N
¨
olle
et al., 2003) are applied to images acquired under con-
trolled conditions and are therefore not appropriate to
segment images from many different sources.
Because of the problems stated, we propose a ro-
bust method which is able to correctly segment a vari-
able set of different coin images. The only assump-
tion we make is that the coin itself possesses more
local information content and details than the rest of
the image, i.e. the background. For that reason, our
method is based on two filters providing a local mea-
surement of information content in the image: the lo-
cal entropy and the local range of gray values.
Local Entropy. Entropy is the measure of the in-
formation content in a probability distribution. For
digital images the probability distribution is repre-
sented by the histogram of gray values (Kapur et al.,
1985). If Ω defines a local neighborhood within the
image with gray value frequencies p
1
, p
2
, ..., p
N
(i.e.
the normalized histogram values), the local entropy is
defined as
H(Ω) = −
N
∑
k=1
p
k
· log
2
(p
k
) (1)
Local Range of Gray Values. The local range of
gray values is defined as the difference of the max-
imum and minimum gray value of a local neighbor-
hood.
The outputs of these two filters are summed-up to
build the final intensity image where the thresholding
is applied on. For both filters a circular neighborhood
with a radius of 3 pixels is used and both filter outputs
as well as the final intensity image are normalized to
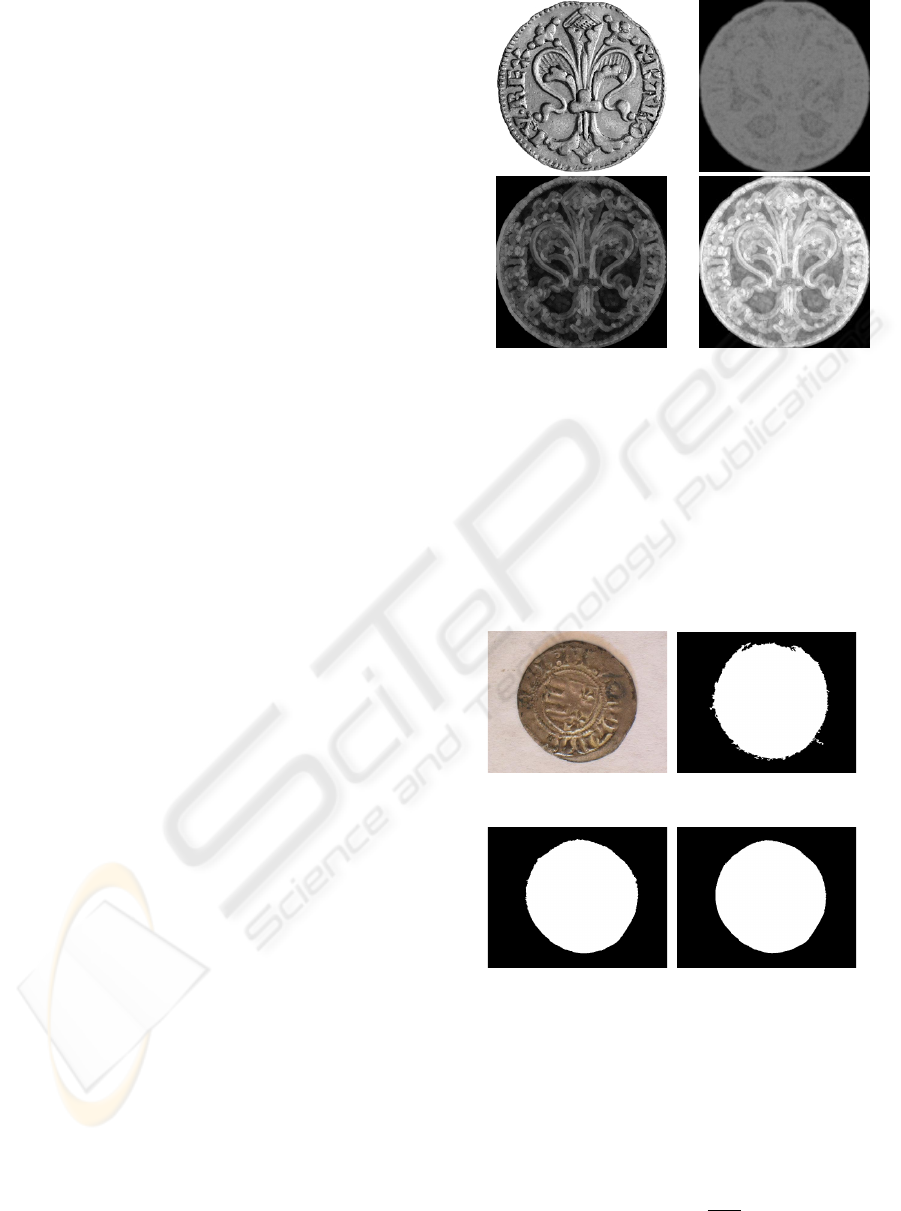
the range 0 to 1. For illustration on a simple example,
in Figure 1 the particular results of the entropy filter
(b), the range filter (c) and their summation (d), ap-
plied to a coin image (a), are shown. The output of
both filters is higher for the region of the coin than for
the region of the background, especially at the coin
border.
To obtain the final coin segmentation from the in-
tensity image shown in Figure 1d, a simple way would
be to apply a global threshold and close all holes in
the binary mask caused by homogeneous regions in-
side the coin. However, tests have shown that such a
manually defined threshold does not perform well on
(a) (b)
(c) (d)
Figure 1: (a) original image, (b) output of local entropy fil-
ter, (c) output of local range filter, (d) sum of local entropy
and local range (final intensity image).
the overall given test set. Therefore, a more sophisti-
cated approach is used: we apply seven thresholds T
i
(T
i
= 0.3, 0.35, ..., 0.6) to the normalized intensity im-
age and compute a score for each achieved segmen-
tation that represents the confidence to the given seg-
mentation. Afterwards the segmentation with highest
confidence is chosen.
(a) Original image. (b) T
1
= 0.3, formfactor
= 0.280
(c) T
3
= 0.4, formfactor =
0.708
(d) T
5
= 0.5, formfactor
= 0.812
Figure 2: Four segmentation masks according to different
thresholds T
i
applied to the intensity image.
Since the shape of a coin is close to a circle, we
use the formfactor (Russ, 2006) of the binary segmen-
tation mask as confidence measure. The formfactor of
a binary mask is computed as follows:
formfactor =
4πA
P
2
(2)
where A is the area and P the perimeter of the binary
VISAPP 2009 - International Conference on Computer Vision Theory and Applications
274

mask. The formfactor is sensitive to both the elonga-
tion of a region and the jaggedness of its border. The
higher the jaggedness of the border, the less the form-
factor. The formfactor is equal to 1 for a circle and is
less for any other shape. Since the final shape of the
segmentation should be close to circle with a regular
border, the formfactor provides a convenient measure
for the confidence of the segmentation.
Since low thresholds can produce a coin segmen-
tation that is near the rectangular shape of the whole
image (providing a comparatively high formfactor), a
segmentation is furthermore only accepted if the area
of the segmented region is lower than 90 % of the
image area. In the case that thresholding produces
more than one connected component in the image,
the one with highest formfactor covering at least 5 %
of the image area is selected. An example for differ-
ent segmentations obtained with different thresholds
is shown in Figure 2. The segmentation obtained with
T
5
= 0.5 shown in Figure 2d has the highest formfac-
tor and is therefore chosen as the final segmentation.
The discretization of T
i
= 0.3, 0.35, ..., 0.6 was
chosen empirically. Tests have shown that a finer
discretization does not improve the accuracy of the
method.
3 EXPERIMENTS
The proposed method was tested on a set of 92 images
acquired at the Kunsthistorisches Museum Vienna,
Austria, the Fitzwilliam Museum, Cambridge UK, and
the Romanian National History Museum representing
a wide range of different coin images. The images
differ in various ways (resolution, background, coin
size relative to image size, illumination conditions).
For the experiments presented here, all color im-
ages were converted to gray-level images. Compres-
sion artifacts due to chroma subsampling are highly
present in the data and make the use of color informa-
tion infeasible.
For each image a ground truth segmentation was
manually obtained by means of a commercial image
editing program. For the evaluation of the segmen-
tation the mutual overlap (MO) (Bowyer, 2000), also
known as dice coefficient, is measured:
MO =
2 · |A
1
∩ A
2
|
|A
1
| + |A
2
|
(3)
where A
1
is the set of pixels in the segmented re-
gion and A
2
the set of pixels in the ground truth seg-
mentation.
To demonstrate the appropriateness of the pro-
posed method for the segmentation of coin images,
the results are compared to the outputs of various
other segmentation methods: (1) the adaptive thresh-
olding method used in (Zaharieva et al., 2007) for
the segmentation of ancient coins, (2) the mean shift
method proposed by (Comaniciu and Meer, 2002) for
a comparison with a state-of-the-art method in image
segmentation and (3) our method when the threshold-
ing is directly applied to gray values instead of the
sum of entropy and gray value range.
It must be noted that the output of the mean
shift segmentation method is not implicitly a parti-
tion into foreground and background, as needed here.
Mean shift partitions the image in a set of disjoint
regions without labeling the foreground and back-
ground. From our point of view the segmentation has
to extract the single most salient object in the image,
which is in our case the coin. Therefore, to make the
mean shift segmentation results comparable, the pa-
rameter M for the minimum allowable region area has
to be manually adapted for each image to produce a
two-segment partition of the image. Evaluation was
performed on the mean shift implementation of the
EDISON system
1
.
In Table 1 the average and median MO for the dif-
ferent methods are listed. The average MO of 0.517
and median MO of 0.720 of the adaptive threshold-
ing method indicate its low robustness. Although the
parameters of the method can be adjusted to perform
well on a given type of coin image it is not able to
handle the wide range of different images contained
in the test set. A second conclusion of the results
is that the local entropy and range filtering is a rea-
sonable preprocessing step to provide a more appro-
priate intensity image for the thresholding. This can
be seen by the lower average and median MO when
the original gray values are used. From the results in
Table 1 it can also be seen that our method achieves
a similar performance than the state-of-the-art mean
shift segmentation. The average MO is equal (0.983)
and the median MO of our method is even higher
(0.993 to 0.988 of the mean shift method). However,
our method has two advantages: firstly, in contrast to
mean shift no parameter has to be adapted manually.
And secondly, our method is computationally faster:
our method (written in MATLAB 7.1) takes 0.38s for
a 178 × 184 image and 8.40s for a 1154 × 866 image,
whereas the means shift implementation (written in
C++) takes 0.73s for the 178 × 184 image and 29.37s
for the 1154 × 866 image on the same machine.
Figure 3 shows results on selected images where
the obtained coin border is outlined by a black or
white line. Figure 3a-c belong to the best segmenta-
1
http://www.caip.rutgers.edu/riul/research/code/EDISON/
index.html, last visited: November 18th 08
ROBUST AUTOMATIC SEGMENTATION OF ANCIENT COINS
275
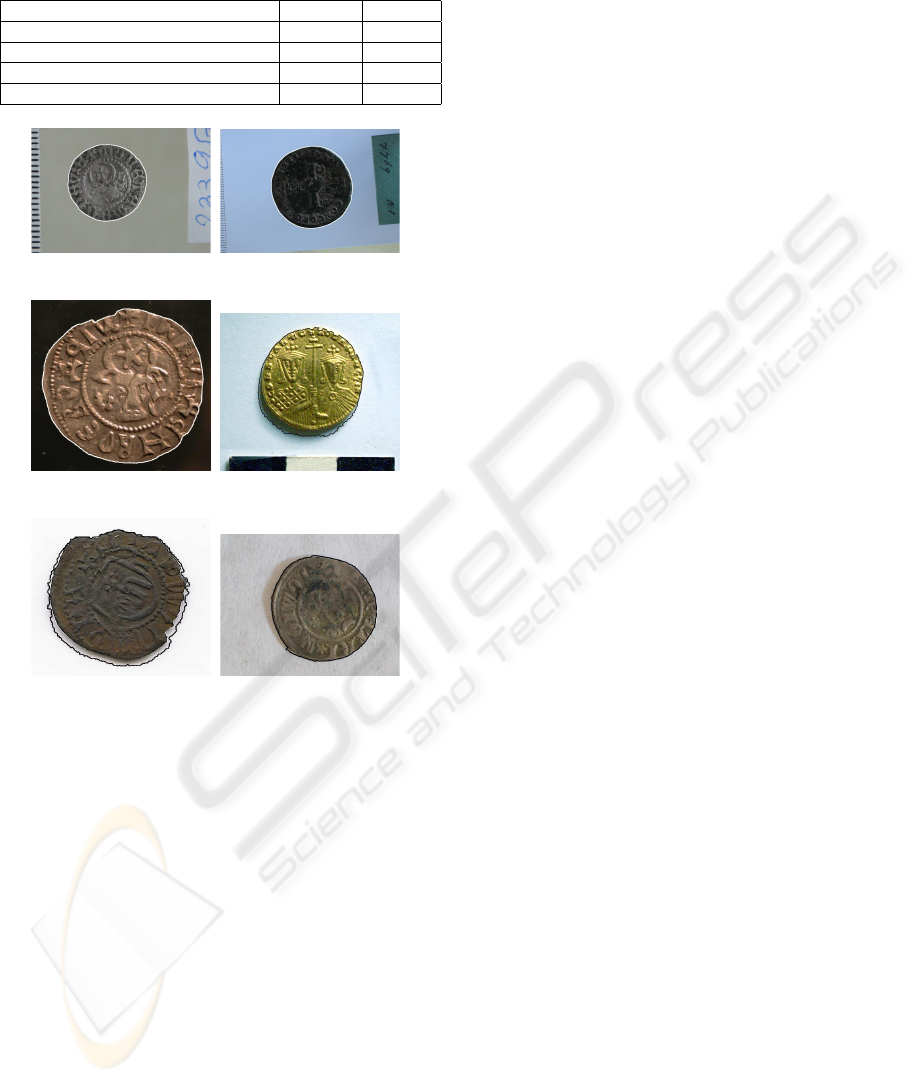
Table 1: Average and median MO achieved on the 92 test
images.
Average Median
Adaptive Thresholding 0.517 0.720
Mean Shift 0.983 0.988
Our method on original gray values 0.923 0.980
Our method 0.983 0.993
(a) MO = 0.9973 (b) MO = 0.9981
(c) MO = 0.9970 (d) MO = 0.9441
(e) MO = 0.9500 (f) MO = 0.9904
Figure 3: Results of the proposed segmentation method.
tion results with a MO of 0.9973, 0.9981 and 0.9970,
respectively.
Figure 3d-e belong to the worst results with a MO
of 0.9441 and 0.9500, respectively. You see that shad-
ows pose a problem to the method since they produce
a strong edge not belonging to the actual coin bor-
der. However, on the image of Figure 3f the method
correctly excludes the shadow from the segmentation,
producing a MO of 0.9904.
4 CONCLUSIONS
The method shows convincing results with a median
MO of 0.9928 and proves that local entropy and gray
value range give a convenient estimate of the actual
coin region. However, although the method’s robust-
ness is indicated by a minimum MO of 0.9048 on a set
of 92 test images, shadows still pose a problem. Nev-
ertheless, the method outperforms the state-of-the-art
mean shift segmentation method both in segmenta-
tion accuracy and speed. Furthermore, our method
needs no parameter adjustment and is therefore able
to deal with a large variety of coin image styles. To
sum up, the results achieved satisfy the needs of au-
tomatic coin identification for a large variety of coin
image styles, nevertheless future research focuses on
the segmentation accuracy in the occurrence of shad-
ows.
ACKNOWLEDGEMENTS
This work was partly supported by the European
Union under grant FP6-SSP5-044450. However, this
paper reflects only the authors’ views and the Euro-
pean Community is not liable for any use that may be
made of the information contained herein.
REFERENCES
Bowyer, K. B. (2000). Validation of medical image anal-
ysis techniques. In Handbook of Medical Imaging,
volume 2, pages 567–607. Press Monograph.
Comaniciu, D. and Meer, P. (2002). Mean shift: A robust
approach toward feature space analysis. IEEE Trans.
Pattern Anal. Mach. Intell., 24(5):603–619.
Kapur, J. N., Sahoo, P. K., and Wong, A. K. C. (1985). A
new method for gray-level picture thresholding using
the entropy of the histogram. CVGIP, 29:273–285.
N
¨
olle, M., Penz, H., Rubik, M., Mayer, K. J., Holl
¨
ander,
I., and Granec, R. (2003). Dagobert – a new coin
recognition and sorting system. In Proc. of DICTA’03,
pages 329–338.
Reisert, M., Ronneberger, O., and Burkhardt, H. (2006). An
efficient gradient based registration technique for coin
recognition. In Proc. of the Muscle CIS Coin Compe-
tition, pages 19–31.
Russ, J. C. (2006). The Image Processing Handbook. CRC
Press, 5th edition.
van der Maaten, L. J. and Poon, P. (2006). Coin-o-matic: A
fast system for reliable coin classification. In Proc. of
the Muscle CIS Coin Competition, pages 07–18.
Yanowitz, S. and Bruckstein, A. (1989). A new method for
image segmentation. CVGIP, 46(1):82–95.
Zaharieva, M., Huber-M
¨
ork, R., N
¨
olle, M., and Kampel, M.
(2007). On ancient coin classification. In Proc. of
VAST’07, pages 55–62.
VISAPP 2009 - International Conference on Computer Vision Theory and Applications
276
