
REPAIRING PEOPLE TRAJECTORIES BASED ON POINT
CLUSTERING
Chau Duc Phu
1, 2
, François Bremond
1
, Etienne Corvée
1
and Monique Thonnat
1
1
Pulsar, INRIA
2004 route des Lucioles, BP93, 06902 Sophia Antipolis Cedex, France
2
Department of Technology, Phu Xuan Private University
176 Tran Phu, Hue, Thua Thien Hue, Vietnam
Keywords: Computer vision, Cognitive vision, Machine learning, Video surveillance.
Abstract: This paper presents a method for improving any object tracking algorithm based on machine learning.
During the training phase, important trajectory features are extracted which are then used to calculate a
confidence value of trajectory. The positions at which objects are usually lost and found are clustered in
order to construct the set of ‘lost zones’ and ‘found zones’ in the scene. Using these zones, we construct a
triplet set of zones i.e. 3 zones: In/Out zone (zone where an object can enter or exit the scene), ‘lost zone’
and ‘found zone’. Thanks to these triplets, during the testing phase, we can repair the erroneous trajectories
according to which triplet they are most likely to belong to. The advantage of our approach over the existing
state of the art approaches is that (i) this method does not depend on a predefined contextual scene, (ii) we
exploit the semantic of the scene and (iii) we have proposed a method to filter out noisy trajectories based
on their confidence value.
1 INTRODUCTION
Nowadays video surveillance systems are applied
worldwide in many different sites such as parking
lots, museums, hospitals and railway stations. Video
surveillance helps a supervisor to overlook many
different camera fields of views from the same room
and to quickly focus on abnormal events taking
place in the control space. However one question
arises: how a security officer can analyze in real
time and simultaneously dozens of monitors with a
minimum rate of missing abnormal events?
Moreover, the observation of screens for a long
period of time becomes boring and draws the
supervisor’s attention away from the events of
interest. The solution to this issue lies in three
words: intelligent video monitoring.
Intelligent video systems belong to the domain
that studies the content of a video. This term
expresses a research direction fairly large, and is
applied in different fields: for example in robotics
and homecare. In particular, a lot of research and
work in this area are already achieved in video
surveillance. This paper focuses in one of the most
important issue of intelligent video monitoring:
mobile object tracking.
There are many methods proposed to track
mobile objects (Almeida et al., 2005), (Avanzi et al.,
2005), (Brookner and Wiley & Sons, 1998),
(Maskell et al., 2003), (Pinho et al., 2006), (Pinho1
et al., 2005). In (Pinho et al., 2006), the authors
propose to use Kalman Filter combined with
optimization techniques for data association in order
to filter and robustly manage occlusions and non-
linear movements. In (Almeida et al., 2005), a
method for tracking multiple moving objects is
presented, using particle filters to estimate the object
states based on joint probabilistic data association
filters. In (Maskell et al., 2003), the authors also
propose to use particle filters that are quite flexible
as they can approximate any probability distribution
with a large set of particles, and allow non-linear
dynamics to be encapsulated. All these works listed
above have obtained satisfactory results, but
complex and long situations of occlusion are not
addressed.
To solve the occlusion problem, some researches
(Fernyhough et al., 1996), (Makris and Ellis, 2005)
have focused on modelling the scene in order to
449
Duc Phu C., BrÃl’mond F., CorvÃl’e E. and Thonnat M.
REPAIRING PEOPLE TRAJECTORIES BASED ON POINT CLUSTERING.
DOI: 10.5220/0001778904490456
In Proceedings of the Fourth International Conference on Computer Vision Theory and Applications (VISIGRAPP 2009), page
ISBN: 978-989-8111-69-2
Copyright
c
2009 by SCITEPRESS – Science and Technology Publications, Lda. All rights reserved

improve the tracking algorithm. The main idea
consists in providing the interesting information in
the scene such as: the positions, directions of paths
(i.e. tracked objects), the sensitive zones in the scene
where the system can lose object tracks with a high
probability, the zones where mobile objects appear
and disappear usually… These elements can help the
system to give better prediction and decision on
object trajectory. There are two possible ways to
model a scene either using machine learning
techniques or by hand. With machine learning, the
modelling cost is low, but the modelling algorithm
has to insure the quality and the precision of the
constructed scene model. For instance, the authors in
(Fernyhough et al., 1996) have presented a method
to model the paths in the scene based on the detected
trajectories. The construction of paths is performed
automatically using an unsupervised learning
technique based on trajectory clustering. However,
this method can only be applied to simple scenes
where only clear routes are defined. The criteria for
evaluating a noisy trajectory are mostly based on
trajectory duration. Fernyhough et al (Makris and
Ellis, 2005) use the same model for learning
automatically object paths by accumulating the trace
of tracked objects. However, it requires full
trajectories, it cannot handle occlusions and the
results depend on the shape and size of the objects,
as they are detected on the 2D image plane.
To solve these problems, we use machine
learning in order to extract automatically the
semantic of the scene. We also propose a method to
calculate the confidence value of trajectories. This
value is used to filter the noisy trajectories before the
learning process, and also to learn some special
zones (eg. entrance and exit zones) in the scene with
which the system can recover a trajectory after
losing it.
The rest of the paper is organized as follows. In
the next section, a description of the approach
working steps i.e. the machine learning stage and the
testing phase is given. The experimentation and
validation of the approach are presented in section 3.
A conclusion is given in the last section as well as
some propositions to improve our algorithm for
better trajectory repairing.
2 OVERVIEW OF THE APPROACH
2.1 Features for Trajectory Confidence
Computation
The proposed approach takes as input the track
objects obtained by any tracking algorithm. To
validate the proposed algorithm, we have used a
region based tracking algorithm [anonymous] where
moving regions are detected by reference image
subtraction. One of the most important problems in
machine learning is to determine the suitable
features for describing the characteristics of a
trajectory.
We aim at extracting features that enable the
distinction between noisy trajectories and true
trajectories of real mobile objects. In this paper, we
propose and define 9 features:
1. An entry zone feature is activated when an
object enters the scene in the entry zone e.g. the
zone around a door.
2. An exit zone feature is activated when an
object disappears in an exit zone. It is a zone from
where the object can leave the scene.
3. Time: the lifetime of the trajectory.
4. Length: the spatial length of the trajectory.
5. Number of times the mobile object is
classified as a ‘person’. An object is classified
according to its 3D dimension and a predefined
3D object model such as a person. This number is
directly proportional to its trajectory’s confidence
value.
6. Number of times that the trajectory is lost.
7. Number of neighbouring mobile objects at
four special temporal instants. Here we count the
number of mobile objects near the considered
mobile object when it has been (1) detected for
the first time, (2) lost, (3) found (if previously
lost) and (4) when the trajectory ends. This
feature is used to evaluate the potential error
when detecting an object. The greater this number
of neighbours is, the lower the confidence of the
trajectory.
8. Number of times the mobile object changes
its size according to a predefined dimension
variation threshold. The too large variation of a
mobile object’s size will penalize objects in
having a high confidence trajectory.
9. Number of times the mobile object changes
spatial direction. The usual behaviour of people in
subway stations is to go in straight direction from
one location to another e.g. from the gates to the
platform. When this feature is high, the trajectory
confidence is low.
In total, nine features defined above are used to
characterize the confidence of a detected trajectory.
For calculating this confidence value a normalisation
phase is necessary. The values of features 5 and 8
are normalised by the time length of the
corresponding trajectory.
VISAPP 2009 - International Conference on Computer Vision Theory and Applications
450

The features 1 and 2 are Booleans: 0 (non-
activated) or 1 (activated). The value of the other
features (3, 4, 6, 7 and 9) are normalised as follows:
i
ii
FV
i
f
σ
μ
−
=
(1)
where,
FV
i
: the value of feature i where i = {3,4,6,7,9}
μ
i
: the average of feature i value for all trajectories
processed in the learning stage
σ
i
: the variance of feature i value for all trajectories
processed in the learning stage
f
i
: the new value of feature i after normalisation
The confidence value of a trajectory is calculated
by the following formula:
()
∑∑
==
−+=
9
6
5
1
)1*()*(
i
ii
i
ii
fwfwCV
(2)
where,
CV = confidence value of trajectory considered
w
i
= the weight (importance) of feature i
f
i
= the value of feature i after normalisation
The first 5 features are the ones being directly
proportional to the confidence value; the last
features are the ones being inversely proportional to
the confidence value.
2.2 Learning Feature Weights with
Genetic Algorithm
We learn the nine weights associated to the
trajectory features with a genetic algorithm. Firstly,
we select the first 300 trajectories in a video for
training set and also the trajectory feature values. In
order to find the importance (weight) of features, we
associate a ground truth of each trajectory. The
ground truth is manually defined as the global
confidence of a trajectory and these confidence
values are in the interval [0..1]. We have defined
four levels in this interval to classify the trajectories
in 4 classes:
− complete trajectory: ground truth >= 0.8
− incomplete trajectory: does not start or does not
end in an In/Out zone, 0.5 <= ground truth < 0.8
− unreliable trajectory: does not start and does not
end in an In/Out zone, 0.2 <= ground truth < 0.5
− noise: does not correspond to the trajectory of a
person, ground truth < 0.2
The problem consists in learning the feature
weights in order to optimize the correspondences
between ground truth values and the confidence
values calculated with the weights. There are many
methods to learn the weights. Here we have selected
a genetic algorithm because it economizes the time
cost (we have up to 9 features), and it is effective.
2.2.1 Mutation and Cross-over for the
Genetic Algorithm
We call an individual the set of 9 values representing
the weights of trajectory features that need to be
learnt.
The fitness of each individual with respect to the
ground truth is used to calculate the difference
(error) between the individual value and the ground
truth value. In this case, the fitness value is
calculated with the following formula:
∑
=
−=
300
1
)()(
i
iCViGT
φ
(3)
Where,
φ
: fitness of the considered individual.
GT(i): The ground truth value of trajectory i.
CV(i) : The confidence value of trajectory i
calculated by the considered weight set.
The better individual is one with the lower value
of fitness.
In order to explore different distributions of
individuals, we define two operators ‘Mutation’ and
‘Cross-Over’. The mutation transformation
processes each individual, with probability 30%.
Once an individual is selected for the mutation, one
feature weight position for this individual is
randomly chosen. All the weight values of this
individual from this position to the end will be
changed by new random values.
The cross-over transformation is performed for
each individual, with probability 80%. Two
individuals are selected to change their weights by
cross over. One feature weight position is randomly
chosen for the two individuals. All weight values of
these individuals from this position to the end will
be swapped.
After performing mutation or cross-over
operators, the sum of weights of each individual can
be greater or less than 1. Each feature weight value
will be divided by the sum of all values of that
individual, which is necessary to ensure that this
sum is always 1.
2.2.2 The Genetic Algorithm
We have created a first individual generation
including 5000 individuals. For each generation, we
perform the cross-over and mutation transformations
in order to create a new generation. This production
process is performed until the fitness of the best
individual we obtain is less than a given threshold.
REPAIRING PEOPLE TRAJECTORIES BASED ON POINT CLUSTERING
451

Figure 1: Description of an entry zone.
Figure 2: Description of a lost-found zone.
2.3 Types of Zones used in a Scene
In our approach, we want to exploit the semantic of
the scene. To do this, we define several zone types.
- entry zone: zone where the object can enter the
scene.
- exit zone: zone where the object can leave the
scene.
- IO zone: zone where the object can enter and also
leave the scene.
- lost zone: zone, which is not in the same time an
exit or IO zone, where the tracking loses usually the
object.
- found zone: zone, which is not in the same time an
entry or IO zone, where the tracking detects usually
new object.
- lost-found zone: is a zone having both
characteristics “lost” and “found”.
Fig 1 and Fig 2 show the description of the
different zone types.
2.4 Zone Learned by Clustering
The entry, exit, IO zones are defined manually and
this construction is based in our case on the subway
zones. Inversely, the lost, found, lost-found zones
are constructed automatically using machine
learning. To learn these zones, the system runs the
tracking process for getting trajectory data. The
coordinates where the system loses or founds the
tracked people, are marked in order to construct lost
zones and found zones. A clustering process based
on people 3D positions is realised. We chose Kmean
algorithm for clustering and a first task is to
determine the number of clusters which is done by
expectation maximization (EM) algorithm.
The results of the clustering process for the lost
zones are displayed in figure 3. In the figure 4, the
outline of “lost zones” is drawn in yellow and the
red zones are the entry, exit and IO zones.
2.5 Zone Triplet Calculation
A zone triplet is a structure for the system to repair
lost trajectories. The system is using complete
trajectories to repair similar but lost trajectories and
thus to build the zone triplets. Once the zones are
generated, the zone triplets can be constructed.
<Zone ident = "9" name = "ZoneIOLeftTop" plane
_
name =
"ground">
<Properties_list>
<Property name = "In_out_zone:Entry"/>
</Properties_list>
<Outline_list>
<Point x="-830.0" y="-350.0" z = "0"/>
<Point x="-300.0" y="-350.0" z = "0"/>
<Point x="-300.0" y="-100.0" z = "0"/>
<Point x="-830.0" y="-100.0" z = "0"/>
</Outline_list>
</Zone>
<Zone ident = "2" name = "ZoneLearnin
g
0"
p
lane name =
"ground">
<Properties_list>
<Property name = "Lost_found_zone:Yes"/>
</Properties_list>
<Outline_list>
<Point x="-2046.000000" y = "12.000000" z="0" />
<Point x="-2046.000000" y = "778.000000" z="0" />
<Point x="-1402.000000" y = "778.000000" z="0" />
<Point x="-1402.000000" y = "12.000000" z="0" />
</Outline_list>
</Zone>
VISAPP 2009 - International Conference on Computer Vision Theory and Applications
452
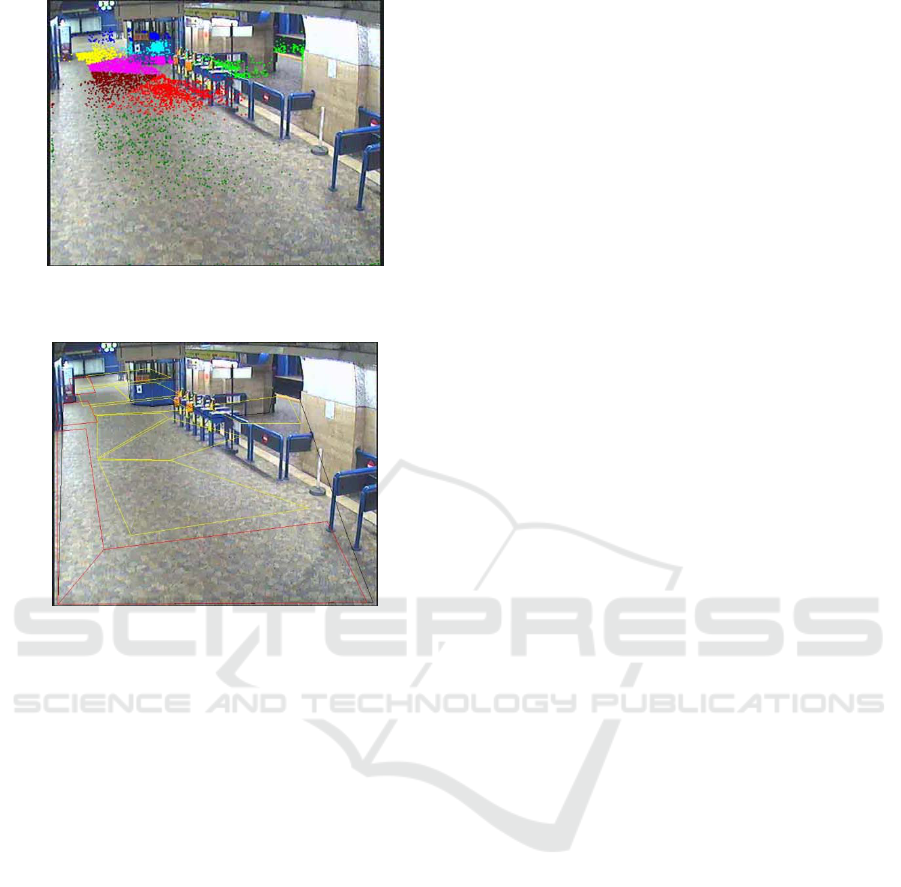
Figure 3: Clustering results for 8 lost zones. Each colour
represents a cluster.
Figure 4: The yellow polygons show the outline of the
learned lost zones. The red polygons show the outline of
the entry zone, exit zone and IO zones.
A zone triplet is a set of 5 values (start Tzone, lost
Tzone, found Tzone, minimum time, maximum
time). “Start Tzone” is entry or IO zone where
trajectories begin. “Lost Tzone” is the first lost zone
or the first lost-found zone where the complete
trajectories pass. “Found Tzone” is the first found
zone or lost-found zone where the complete
trajectories pass just after passing a lost Tzone.
Found zone has to be searched only after the object
has left its lost Tzone. Minimum time is calculated
by the difference between the instant when entering
the found Tzone and the instant when exiting the lost
Tzone. Maximum time is calculated by the
difference between the instant when leaving the
found Tzone and the instant when entering the lost
Tzone.
A complete trajectory is a trajectory whose
confidence value is greater than a given threshold
and starts from an entry or IO zone. Only complete
trajectories passing successively through start, lost
and found Tzones can be used for building a zone
triplet. All zone triplets are ordered by the number of
complete trajectories passing through them. A zone
triplet with a greater number of trajectories will be
ordered with higher priority. The minimum and
maximum time are calculated as the average of the
correspondent values for the associated complete
trajectories. The next section will present how the
triplets are used to repair the lost trajectories.
2.6 Repairing Lost Trajectories
Zone triplets are used to repair lost trajectories. When
the system detects an object (considered as lost) that
appears in an abnormal location (not in an IO zone or
in an “entry zone”), we verify whether it appears in a
found zone or in a lost-found zone ZF. If this is the
case, we search among the triplets constructed in the
previous step the triplet with the “found Tzone” ZF,
such as <ZS, ZL, ZF, Mi, Ma>. If several triplets can
be associated to the lost object, the system will chose
the triplet having the highest priority. After that, the
system searches for a lost trajectory that begins in
ZS, that is lost in ZL and with a temporal interval
between the lost instant up to current time which is
greater than Mi and lower than Ma. Once a trajectory
is found, the system fuses this trajectory with the
trajectory of the lost object that has just been
detected.
3 EXPERIMENTATION AND
VA L I D AT I O N
Experiments have been performed with the videos of
a European project (hidden for anonymous reason).
This project aims at tracking people in subway
stations and learning their behaviours. These videos
are specially interesting due to the fact that people
motions in the scene are diverse. There are not clear
paths and the mobile objects can evolve anywhere.
For that, the semantic exploitation of the scene is
hard and required machine learning techniques. We
have carried out the clustering algorithm on a video
of 5 hours, and computed over 8000 trajectories. Just
only 23 trajectories among them have been chosen
to construct triplets, and 12 triplets have been found.
The system has detected 340 lost trajectories that
can be solved by the proposed repair algorithm. In
order to evaluate the benefits of the algorithm, we
have calculated the confidence value before and
after fusing the trajectories. In the 340 detected
cases, there were up to 337 cases where the
confidence value increases. The system has wrongly
repaired some lost trajectories when performing the
fusion task. These errors have happened when
several trajectories get lost at the same time but with
REPAIRING PEOPLE TRAJECTORIES BASED ON POINT CLUSTERING
453
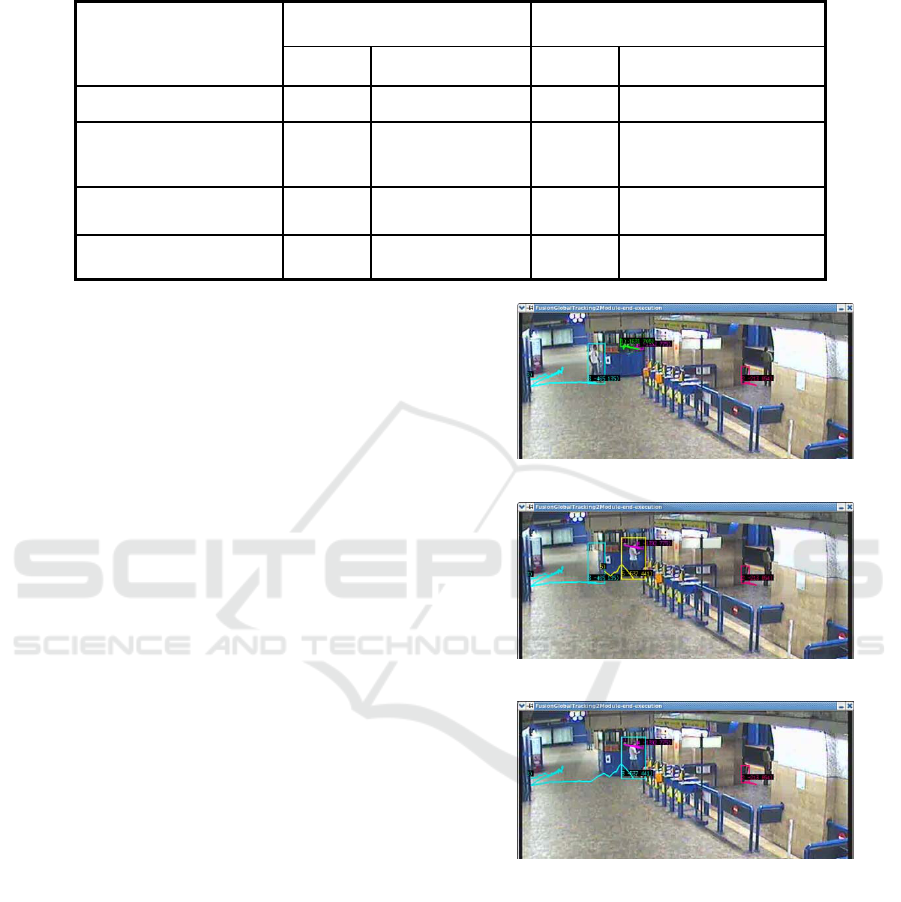
Table 1: Summary of results in two cases: with or without the proposed algorithm.
Without the algorithm With the algorithm
Number Percentage (%) Number Percentage (%)
Complete trajectories 758 9.0 795 9.9
Incomplete trajectories 3086 36.8 2778 34.5
Noise 4550 54.2 4481 55.6
Total 8394 100 8054 100
different triplets. In this case, a lost object will be
associated to the zone triplet with higher priority
which can be an incorrect association.
The system has successfully filtered noisy
trajectories thanks to their confidence value. The
trajectories having a confidence value lower than a
given threshold have been considered as noisy
trajectories
The table 1 is a summary of data in two cases:
apply and not apply the algorithm. We can see an
increase of the complete trajectory number and a
decrease of the incomplete trajectory and noise
number. The system also detects successfully 4550
noisy trajectories in the first case and 4481 noisy
trajectories in the second one. There is a decrease of
340 trajectories in total after applying the algorithm
because there are 340 fusion cases.
In this section, we want to show some
experimentation results. In figure 5, the image a) is
captured before the system loses the trajectory with
id 3 (cyan colour). The image b) is captured 2s later.
The person is detected, but the system cannot
recognize that this is the same person than the one in
previous frames (with id 5, yellow colour). Whereas,
in the image c) thanks to the proposed approach, the
system is able to repair the lost trajectory, and the
person is detected successfully up to the end.
We can see another example in figure 6. In this
example, the system can track successfully the
trajectory of person 2 (pink colour).
Figure 5: Images captured before and after trajectory
fusion at t = 711
a) t = 709
b) t = 711 before trajectory fusion
c) t = 711 after trajectory fusion
Fig 5c)
Fig 5b)
Fig 5a)
VISAPP 2009 - International Conference on Computer Vision Theory and Applications
454
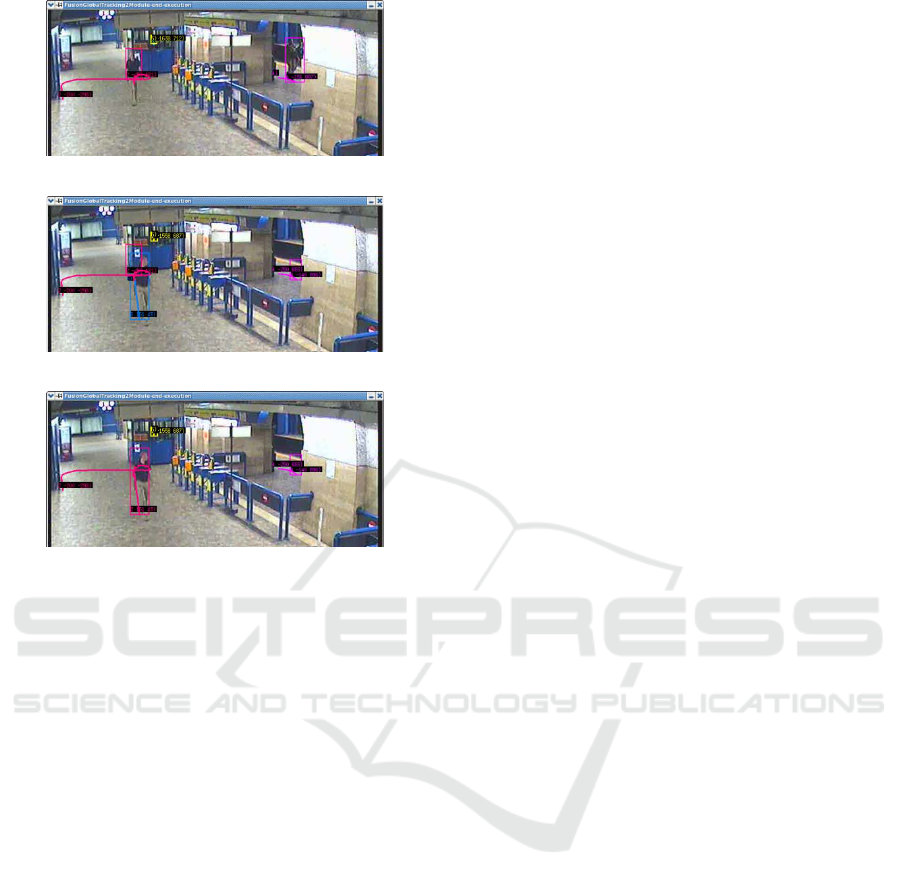
Figure 6: Images captured before and after trajectory
fusion at t = 903
a) t = 901
b) t = 903 before trajectory fusion
c) t = 903 after trajectory fusion
4 CONCLUSIONS
This paper presents a method to repair the
trajectories of objects in videos. The principle of this
approach is to use machine learning stage to exploit
the semantic of the scene. The zones defined as lost
zone, found zone and lost-found zone are
constructed by the clusters of 3D object positions on
the ground where the system can lose only, find only
and lose or find respectively the trajectories. Nine
trajectory features are extracted and used to calculate
a confidence value of trajectory. The confidence
value is used to filter out noisy trajectories. The best
trajectories are used to construct zone triplets. A
zone triplet is a ‘representation’ of a path describing
the complete paths of people in a scene where
trajectories can be lost. Zone triplets are suitable to
the difficult conditions where there are not any clear
paths such as in many areas of subway stations as
shown in the experimentation section. Moreover,
these triplets can detect the lost trajectories to be
fused and repaired.
However, the approach still encounters problems
that have to be considered in order to better repair
trajectories. Although the use of zone triplets
succeeded in repairing some trajectories, not all
repaired trajectories were obtained. This is due to the
complexity of the people activities in a scene and the
large amount of short and incomplete trajectories to
be fused. Although the work experiences some weak
points, this method opens a new approach to
improve any tracking algorithm and these initial
results are promising for future studies. For instance,
we can first increase the number of zones defined in
triplet to four or five so that trajectory fusion
becomes more versatile. Second, the first zone of the
zone triplet does not have to be a start zone, but
could be of any zone type. This start zone defined as
a first zone was used to limit the space for searching
trajectories to be fused and hence limits the repair
process flexibility.
REFERENCES
A. Almeida, J. Almeida, and R. Araujo, Real-time tracking
of multiple moving objects using particle filters and
probabilistic data association, Automatika, vol. 46, no.
1-2, pp. 39–48, 2005.
A. Avanzi, Francois Bremond, Christophe Tornieri and
Monique Thonnat, Design and Assessment of an
Intelligent Activity Monitoring Platform, in EURASIP
Journal on Applied Signal Processing, special issue in
"Advances in Intelligent Vision Systems: Methods and
Applications", 2005:14, pp.2359-2374.
E. Brookner, John Wiley & Sons, Tracking and Kalman
Filtering Made Easy, 1998.
Fernyhough, J H, Cohn, A G & Hogg, D C Generation of
semantic regions from image sequences in: Buxton, B
& Cipolla, R (editors) ECCV'96, pp.475-478.
Springer-Verlag. 1996.
D. Makris, T. Ellis, Learning semantic scene models from
observing activity in visual surveillance, IEEE
Transactions on Systems, Man and Cybernetics, Part B
35 (3) (2005) 397–408.
S. Maskell, N. Gordon, M. Rollason and D. Salmond,
Efficient Multitarget Tracking using Particle Filters,
Journal in Image and Vision Computing, 21(10): 931-
939, September 2003.
Raquel R. Pinho, João Manuel R. S. Tavares, Miguel V.
Correia, An Efficient and Robust Tracking System
using Kalman Filter, VIPSI-2006 VENICE, 2006.
Raquel R. Pinho1, João Manuel R. S. Tavares and Miguel
V. Correia, A Movement Tracking Management
Model with Kalman Filtering, Global Optimization
Techniques and Mahalanobis Distance, Lecture Series
on Computer and Computational Sciences Volume 1,
2005, pp. 1-3.
Fig 6c)
Fig 6b)
Fig 6a)
REPAIRING PEOPLE TRAJECTORIES BASED ON POINT CLUSTERING
455
