
NON-INVASIVE SEPSIS PATIENT CLASSIFICATION USING LEAST
SQUARES SUPPORT VECTOR MACHINE
Collin H. H. Tang, Andrey V. Savkin
School of Electrical Engineering and Telecommunications, University of New South Wales, Sydney, NSW 2052, Australia
Paul M. Middleton
Prince of Wales Clinical School, University of New South Wales, Sydney, NSW 2031, Australia
Keywords:
Systemic inflammatory response syndrome, Severe sepsis, Support vector machine, Photoplethysmography,
Power spectral analysis.
Abstract:
Sepsis is a systemic inflammatory response to serious infection. Without proper identification and treatment
at its early stage, this syndrome can deteriorate within hours to a more devastating state. In this paper, it was
hypothesized that early identification of sepsis stages can be achieved through the evaluation of patients’ au-
tonomic neural activity by means of power spectral analysis. Least squares support vector machine (LSSVM)
was utilized to classify sepsis patients into systemic inflammatory response syndrome (SIRS) and severe sep-
sis groups, based on the measured normalized low-frequency (LFn) components of heard period (RRi) and
pulse transit time (PTT) time series. Polar-like transformation of LFn pair of RRi and PTT provides another
two distinctive features into the construction of input space. Age factor was also used as an attribute in sep-
sis classification. The performance of the proposed LSSVM with two different kernels: cubic-polynomial
and Gaussian radial basis function (RBF), was evaluated using 5-fold cross-validation technique. From the
study, LSSVM with RBF kernel was found to be an effective classifier in the identification of sepsis syn-
drome progression, with the classification accuracy, sensitivity, and specificity: 93.32%, 99.87%, and 79.29%
respectively.
1 INTRODUCTION
Sepsis has been defined as the systemic response to
severe infection in critically ill patients. Systemic in-
flammatory response syndrome (SIRS), severe sep-
sis, and septic shock represent the increasingly severe
stages of the same sepsis syndrome. Delays in the
identification of sepsis progression and the adminis-
tration of proper treatments to the patient resulted in
the increase of mortality rate and prolonged hospital
stay (Rivers et al., 2001). However, early detection
and immediate interventions to halt the progression
of sepsis may greatly improve the outcomes of the
sepsis patients (Rivers et al., 2005). The guidelines
for sepsis diagnosis (Figure 1) defined in 1991 during
the American College of Chest Physicians/Society of
Critical Care Medicine Consensus Conference have
given us clear definitions of SIRS, sepsis, and severe
sepsis (Bone et al., 1992), and these definitions were
strictly followed in this paper. It was hypothesized
that early identification and differentiation of sepsis
stages: i.e., SIRS and severe sepsis, may be achieved
through the evaluation of sepsis patients’ autonomic
neural activity by the use of support vector machine
(SVM). The analysis was based on the cardiovascular
data collected from 33 patients at risk of sepsis, who
were presented to the Emergency Department of the
Prince of Wales Hospital from August 2006 to Jan-
uary 2007.
2 METHODS
The protocol used in this study was approved by
the Prince of Wales Hospital Human Research Ethics
Committee (HREC). It was conducted according to
the Australian national guidelines concerning ethi-
cal research involving human subjects, as well as the
World Medical Association Declaration of Helsinki.
Informed verbal consent was obtained from eligible
406
H. H. Tang C., V. Savkin A. and M. Middleton P. (2009).
NON-INVASIVE SEPSIS PATIENT CLASSIFICATION USING LEAST SQUARES SUPPORT VECTOR MACHINE.
In Proceedings of the International Conference on Bio-inspired Systems and Signal Processing, pages 406-410
DOI: 10.5220/0001775704060410
Copyright
c
SciTePress
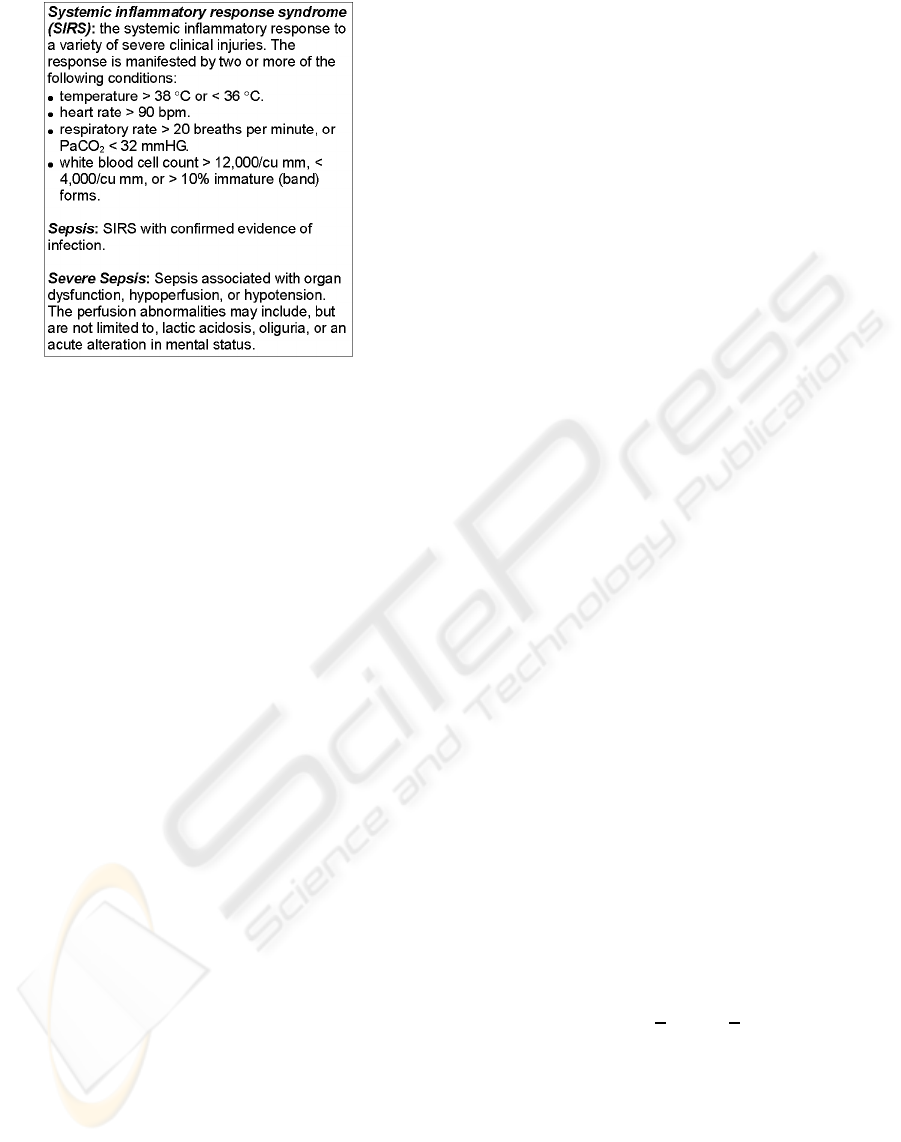
Figure 1: Definition of SIRS, sepsis, and severe sepsis given
by (Bone et al., 1992).
individual adult patients at risk of sepsis, and verbal
assent from patient’s next of kin prior to the study.
33 Patients fulfilling SIRS and severe sepsis criteria
given in Figure 1 were enrolled into the study and no
exclusion was based on sex or age. Before the ini-
tiation of any intravenous interventions, the patients
were connected to PowerLab 16/30 using 3 elec-
trocardiography (ECG) electrodes, infra-red ear lobe
plethysmograph (PPG), pulse transducer, and oxime-
ter pod, with data collected via a Bio Amp
r
. To meet
the recommended measurement standards described
in the Task Force of the European Society of Cardi-
ology and the North American Society of Pacing and
Electrophysiology, the signals were sampled at 1000
Hz with a time duration of not less than 5 minutes
(Malik et al., 1996).
2.1 Power Spectral Analysis
Power spectral analysis was used to break down ev-
ery repeating wave in cardiovascular time series into
a series of sine waves of different frequency. This
technique allowed non-invasive evaluation of auto-
nomic nervous system activity either at central or pe-
ripheral sites. The spectral analysis algorithm used
in this study was summarized in Figure 2(a), cover-
ing the phases of: initial low-pass filtering, detections
of ECG R-waves and PPG peaks, generation of pulse
transit time (PTT) and R-R intervals (RRi) time se-
ries, and finally the pre-processing of cardiovascular
signals. Figure 2(b) illustrates the definitions of both
RRi and PTT features, together with an example of
PTT time series generation.
Two major oscillatory components (i.e., low fre-
quency, LF (0.035 - 0.15 Hz) and high frequency, HF
(0.15 - 0.45 Hz) were derived. HF of RRi provided an
index of parasympathetic modulation of heart func-
tion, whilst the LF component represented both sym-
pathetic and parasympathetic modulation on the heart
(Mainardi et al., 1997). Despites of the dubious capa-
bility of PTT in blood pressure estimation, PTT vari-
ability does reflect blood pressure variability to some
extent (Payne et al., 2006). These spectral compo-
nents have to be normalized in proportion to the total
power of the time series by excluding the very-low
frequency components (< 0.035Hz).
2.2 Nonlinear Support Vector Machine
SVM was first derived by Vapnik from the statisti-
cal learning theory framework (Vapnik, 2000), and
its use in medical decision-making and human phys-
iological analysis is now increasing rigorously due
to its robust and solid mathematical foundation. In
this paper, a variant of the original SVM, i.e., least
squares SVM (LSSVM) was used for the classifica-
tion of sepsis patients. The main difference between
LSSVM and standard SVM relies on their training ap-
proaches where LSSVM involves the solution of lin-
ear equations, while SVM requires the solution of a
quadratic programming problem (Suykens and Van-
dewalle, 1999), which is computationally more ex-
pensive and complex.
Using “T” as the notation for vector transposi-
tion and given that {y
k
,x
k
}
N
k=1
is a set of N training
data points, where x
k
∈ R
n
is k-th input vector, and
y
k
∈ R is k-th output vector, the equality constraint of
LSSVM is given as follows:
y
k
[w
T
g(x
k
) + b] = 1− ξ
k
, for k = 1,...,N (1)
where, g(.) is a nonlinear function that maps the in-
put space into a high-dimensional space, w is an n-
dimensional vector, b is a bias term, and ξ represents
non-negative slack variables.
Subject to the equality constraint in (1), the coeffi-
cients w and b can be obtained through the minimiza-
tion process of the following optimization function:
Q(w,b,ξ) =
1
2
w
T
w+
c
2
N
∑
k=1
ξ
2
k
(2)
By introducing the non-negative Lagrange multi-
plier α
k
and using c as the margin parameter that de-
termines the trade-off between maximization of the
margin and minimization of the classification error,
the Lagrangian, L is defined from (1) and (2) as fol-
lows:
L(w,b,ξ;α) = Q(w,b,ξ) − C (3)
where, C =
∑
N
k=1
α
k
(y
k
(w
T
g(x
k
) + b) − 1 + ξ
k
)
NON-INVASIVE SEPSIS PATIENT CLASSIFICATION USING LEAST SQUARES SUPPORT VECTOR MACHINE
407
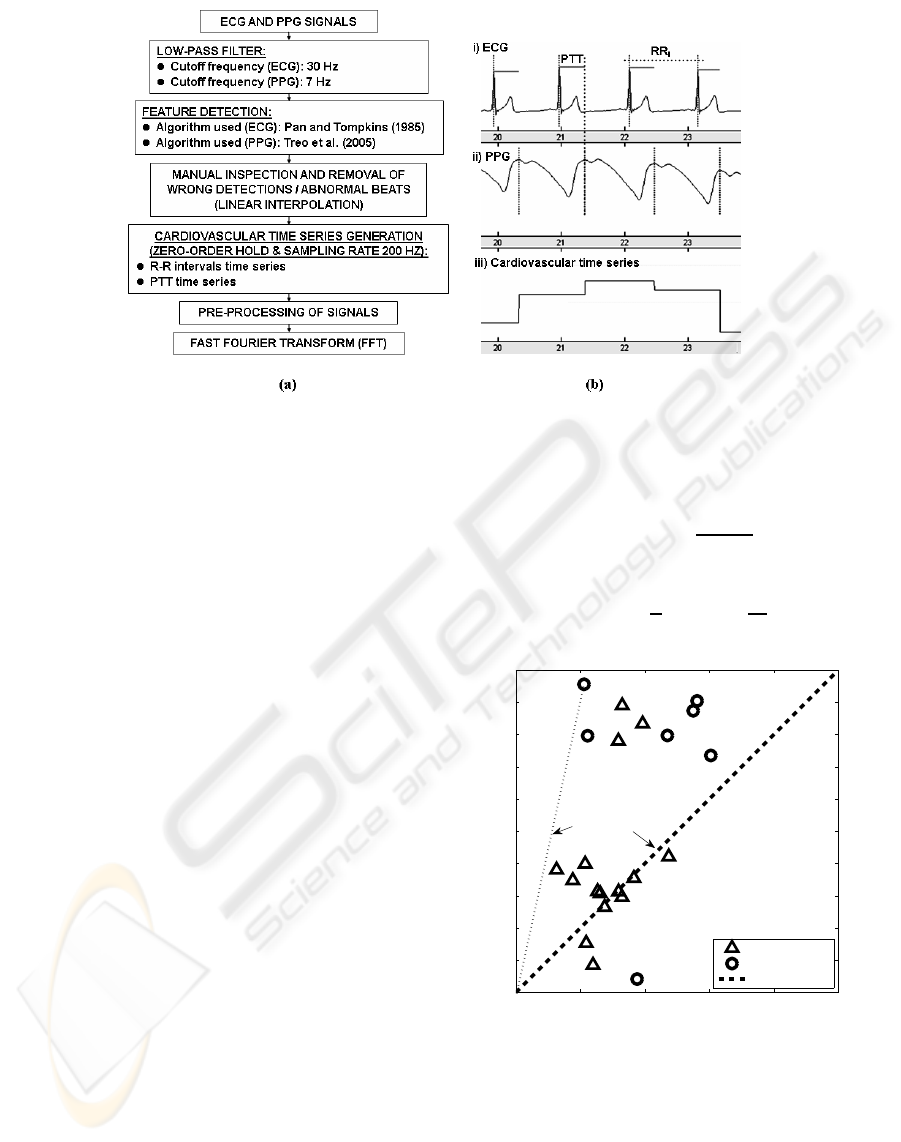
Figure 2: (a)Flow chart of signal processing prior to power spectral analysis. (b)Feature detection and cardiovascular time
series generation.
In SVM, kernel function is required to lift the in-
put space into a high-dimension feature space. Given
the general kernel function, H(x,x
′
) = g
T
(x) · g(x
′
),
the polynomial kernel function with constant h can be
derived as follows:
H(x,x
′
) = (x
T
· x
′
+ h)
d
(4)
where, d is the polynomial order, and cubic-
polynomial kernel (d = 3) was used in this study.
Another kernel function which is of particular in-
terest in this study is Gaussian radial basis function
(RBF) as given in the following function (5). Through
RBF kernel, the dimension of the feature space can
be increased to infinity due to the infinite series ex-
pansion of e
x
. This ultimate increase of feature space
dimension is preferred in SVM because it ensures that
any given classification problem, regardless of its size
or dimension, can be solved in a predictable way, es-
pecially when the discontinuities or outliers are ac-
ceptable.
H(x,x
′
) = e
−γkx−x
′
k
2
(5)
where γ is a positive parameter for controlling the ra-
dius.
3 LSSVM CLASSIFIER SETUP
A distribution plot of the normalized low frequency
(LFn) components for RRi and PTT time series of
both SIRS and severe sepsis patients in Figure 3 has
clearly revealed that the latter has the tendency to stay
closely to the origin, (0,0) as well as the tan(π/4)
straight line, P. Based on this observation, two dis-
tinctive attributes, i.e., the radius, r and the angle, θ
were derived by denoting LFn of PTT and RRi as x
1
and x
2
respectively:
r(x
1
,x
2
) =
q
x
2
1
+ x
2
2
(6)
θ(x
1
,x
2
) =
π
4
− tan
−1
x
2
x
1
(7)
0 20 40 60 80 100
0
10
20
30
40
50
60
70
80
90
100
LFn of PTT, x
1
(%)
LFn of RRi, x
2
(%)
S.Sep
SIRS
P−line (tan π/4)
θ (x
1
,x
2
)
r (x
1
,x
2
)
P
Figure 3: Distribution of severe sepsis and SIRS patients in
x
2
versus x
1
plane.
r(x
1
,x
2
) estimates the distance of the LFn pairs
from the origin, while θ(x
1
,x
2
) measures the close-
ness between the LFn pairs to P straight line. By tak-
ing these two attributes: r(x
1
,x
2
) and θ(x
1
,x
2
) into
the construction of input space, it is believed that this
will improve the separability of the sepsis groups.
BIOSIGNALS 2009 - International Conference on Bio-inspired Systems and Signal Processing
408
LFn pairs of RRi and PTT, without the transforma-
tion in (6) and (7), were included also into the con-
struction of input space as these low frequency com-
ponents are potential in reflecting the sepsis stages
(Annane et al., 1999; Pontet et al., 2003). Age factor
is another attribute which is excellent in determining
the subsequent outcomes of sepsis patients (Martin
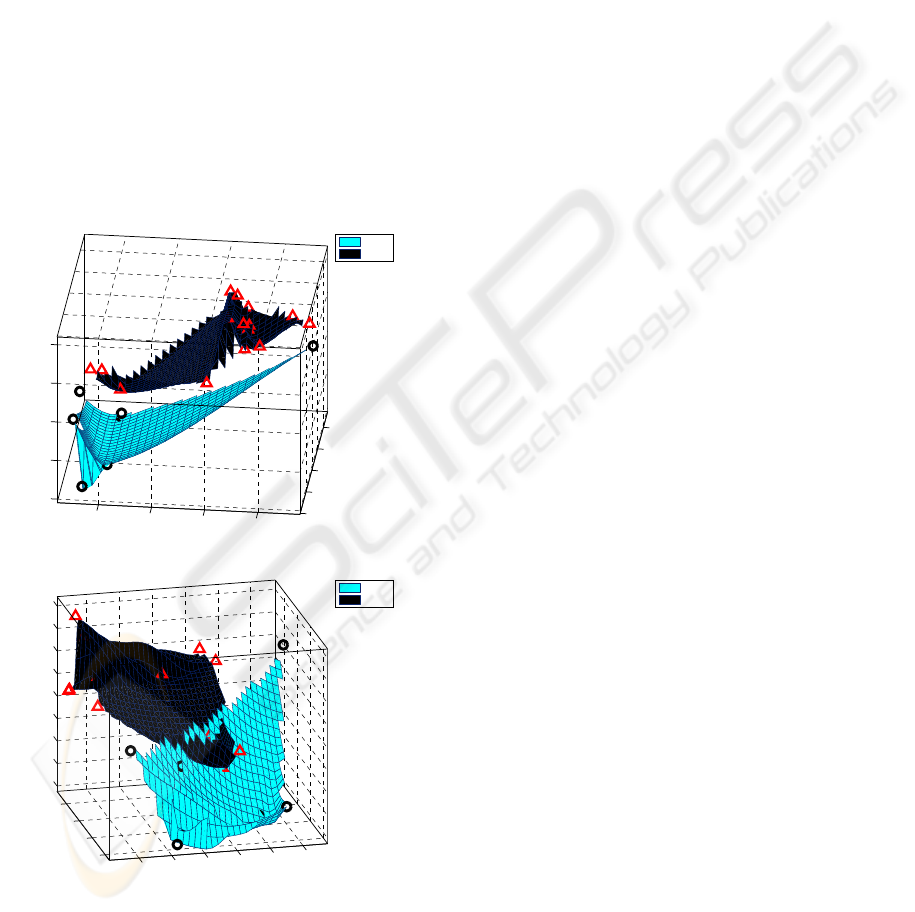
et al., 2006). The meant five-dimensional input space
as stated above is shown in Figure 4(a) and 4(b), with
the space dimensions restricted to only three.
To evaluate the effectiveness of LSSVM, a 5-fold
cross validation technique was used in this study. This
method partitioned the original sample into five sub-
samples, with one sub-sample retained for validation
purpose and the remaining sub-samples were used as
the training data. This process was repeated until all
the sub-samples were used once in the validation pro-
cess. By doing this, the performance of the classifier
was less susceptible to data division problem.
20
30
40
50
60
20
40
60
80
20
40
60
80
100
LFn of PTT,x
1
LFn of RRi,x
2
Age(Years)
SIRS
S.Sep
(a)
40
60
80
100
0.1
0.2
0.3
0.4
0.5
0.6
20
30
40
50
60
70
80
90
100
θ(x
1
,x
2
)
r(x
1
,x
2
)
Age (Years)
SIRS
S.Sep
(b)
Figure 4: Different angles of view of the constructed in-
put space with the space axis: (a) {x
1
,x
2
,Age}, and (b)
{r(x
1
,x
2
),θ(x
1
,x
2
),Age}, where the space dimensions are
restricted to only three.
4 RESULTS AND DISCUSSIONS
The classification results of the proposed LSSVM
with different input spaces and kernels are given in
Table 1. It was clear that higher-dimensions of in-
put space offered no benefit to the cubic-polynomial
LSSVM, in contrast to its counterpart, RBF LSSVM
which performed better with higher-dimension in-
put space, given that the final classification results:
93.32% (accuracy), 99.87% (sensitivity), and 79.29%
(specificity) respectively. This is mainly because RBF
kernel lifts the dimension of the input space to infin-
ity in feature space, such that a linear separating hy-
perplane can be easily generated between the sepsis
groups. However, it is ironical to point out that the
polar-like transformation in (6) and (7) actually dis-
courages the performance of RBF LSSVM, especially
when the dimension of the input space is low.
Despites of the excellent performance of the pro-
posed LSSVM, a study by Li et al.(2007) has demon-
strated that small-data-set learning can jeopardize the
effectiveness of the SVM classification (Li et al.,
2007). In this study, the number of study participant
is considerably small, and this may affect the validity
of the classification results shown above. In future,
more participants should be enrolled into the study so
that complete learning of the trend and distribution of
the sepsis patients can be achievedand thus producing
more convincing classification results.
5 CONCLUSIONS
A non-invasive classifier, LSSVM has been proposed
and used in this study to detect sepsis continuums
(i.e., SIRS and severe sepsis). Through the polar-like
transformation functions, two distinctive attributes:
radius and angle difference were derived and incor-
porated into the construction of input space. From
this study, LSSVM with RBF kernel is an effective
method that can be used in the classification of severe
sepsis patients with the classification accuracy, sensi-
tivity, and specificity: 93.32%, 99.87%, and 79.29%
respectively. In spite of its supreme classification
performance, LSSVM is relatively vulnerable to low
number of training data. In future, more study par-
ticipants should be enrolled into the study to further
validate the effectiveness of the proposed LSSVM in
sepsis patients classification.
NON-INVASIVE SEPSIS PATIENT CLASSIFICATION USING LEAST SQUARES SUPPORT VECTOR MACHINE
409

Table 1: Classification results of LSSVM with different input space dimension and kernels.
Input Space Kernel Accuracy Sensitivity Specificity
{PTT,RRi} Cubic-Polynomial 87.05 96.80 66.14
{r,θ} Cubic-Polynomial 87.59 95.40 70.86
{PTT,RRi,Age} Cubic-Polynomial 82.91 98.20 50.14
{r,θ,Age} Cubic-Polynomial 87.86 100.00 61.86
{PTT,RRi,r,θ,Age} Cubic-Polynomial 86.82 98.53 61.71
{PTT,RRi} RBF 82.18 94.20 56.43
{r,θ} RBF 78.59 88.93 56.43
{PTT,RRi,Age} RBF 91.73 98.60 77.00
{r,θ,Age} RBF 90.45 98.33 73.57
{PTT,RRi,r,θ,Age} RBF 93.32 99.87 79.29
Abbreviations: Accuracy = (TP+ TN)/(POS+ NEG), Sensitivity = TP/POS, Specificity = TN/NEG: TP is true
positives; TN is true negatives; POS is total positives; NEG is total negatives.
ACKNOWLEDGEMENTS
This work was supported in part by the Australian Re-
search Council.
REFERENCES
Annane, D., Trabold, F., Sharshar, T., Jarrin, I., Blanc, A.,
Raphael, J., and Gajdos, P. (1999). Inappropriate sym-
pathetic activation at onset of septic shock: a spectral
analysis approach. American Journal of Respiratory
and Critical Care Medicine, 160(2):458–465.
Bone, R., Balk, R., Cerra, F., Dellinger, R., Fein, A.,
Knaus, W., Schein, R., and Sibbald, W. (1992).
Definitions for sepsis and organ failure and guide-
lines for the use of innovative therapies in sepsis.
The ACCP/SCCM Consensus Conference Commit-
tee. American College of Chest Physicians/Society of
Critical Care Medicine. Chest, 101(6):1644–55.
Li, D., Yeh, C., Tsai, T., Fang, Y., and Hu, S. (2007). Ac-
quiring knowledge with limited experience. Expert
Systems, 24(3):162–170.
Mainardi, L., Yli-Hankala, A., Korhonen, I., Signorini, M.,
Bianchi, A., Takala, J., Nieminen, K., and Cerutti,
S. (1997). Monitoring the autonomic nervous system
in the ICU through cardiovascular variability signals.
IEEE Engineering in Medicine and Biology Maga-
zine, 16(6):64–75.
Malik, M., Bigger, J., Camm, A., Kleiger, R., Malliani, A.,
Moss, A., and Schwartz, P. (1996). Heart rate vari-
ability: standards of measurement, physiological in-
terpretation, and clinical use. European Heart Jour-
nal, 17(3):354–381.
Martin, G., Mannino, D., and Moss, M. (2006). The ef-
fect of age on the development and outcome of adult
sepsis*. Critical Care Medicine, 34(1):15.
Payne, R., Symeonides, C., Webb, D., and Maxwell, S.
(2006). Pulse transit time measured from the ECG:
an unreliable marker of beat-to-beat blood pressure.
Journal of Applied Physiology, 100(1):136–141.
Pontet, J., Contreras, P., Curbelo, A., Medina, J., Noveri, S.,
Bentancourt, S., and Migliaro, E. (2003). Heart rate
variability as early marker of multiple organ dysfunc-
tion syndrome in septic patients. Journal of Critical
Care, 18(3):156–163.
Rivers, E., McIntyre, L., Morro, D., and Rivers, K. (2005).
Early and innovative interventions for severe sepsis
and septic shock: taking advantage of a window of
opportunity. Canadian Medical Association Journal,
173(9):1054–1065.
Rivers, E., Nguyen, B., Havstad, S., Ressler, J., Muzzin,
A., Knoblich, B., Peterson, E., and Tomlanovich, M.
(2001). Early goal-directed therapy in the treatment
of severe sepsis and septic shock. The New England
Journal of Medicine, 345(19):1368–1377.
Suykens, J. and Vandewalle, J. (1999). Least squares sup-
port vector machine classifiers. Neural Processing
Letters, 9:293–300.
Vapnik, V. (2000). The Nature of Statistical Learning The-
ory. Springer.
BIOSIGNALS 2009 - International Conference on Bio-inspired Systems and Signal Processing
410
