
DETERMINATION OF DRIVER’S HYPOVIGILANCE
FROM BIOSIGNALS
David Sommer, Martin Golz
University of Applied Sciences Schmalkalden, Faculty of Computer Science, Schmalkalden, Germany
Udo Trutschel
Circadian, Stoneham, Massachusetts USA, Institute for System Analysis and Applied Numerics, Tabarz, Germany
Dave Edwards
Caterpillar Inc., Machine Research, Peoria, Illinois USA
Keywords: Hypovigilance, EEG, EOG, PERCLOS, Data Fusion, Support-Vector Machines, Driving Simulation.
Abstract: Robust and reliable determination of hypovigilance is required in many areas, particularly transportation.
Here, new products of Fatigue Monitoring Technologies (FMT) emerge. Their development and assessment
requires an independent reference standard of driver’s hypovigilance. Until recently most approaches utili-
zed electrooculography (EOG) and electroencephalography (EEG) combined to descriptive statistics of a
few time or spectral domain features, like e.g. power spectral densities (PSD) averaged in four to six spec-
tral bands. Here we present a more general approach of data fusion of many features utilizing computational
intelligence methods, like e.g. Support-Vector Machines (SVM). For simplicity, two classes were discrimi-
nated: slight and strong hypovigilance. Validation was performed by independent class labels which were
assessed from Karolinska Sleepiness Scale (KSS) and from variation of lane deviation (VLD). The first is a
measure of subjectively self-experienced hypovigilance, whereas the second is an objective measure of
performance decrements. 16 young volunteers participated in overnight experiments in our real car driving
simulation lab. Results were compared with PERCLOS (percentage of eye closure), an oculomotoric
variable utilized in several FMT systems. We conclude that EEG and EOG biosignals are substantially more
suited to assess driver’s hypovigilance than the PERCLOS biosignal. In addition, computational intelligence
performed better when objective class labels were used instead of subjective class labels.
1 INTRODUCTION
Both distracted and fatigued driving crashes are
thought to be underreported, since there is mostly no
evidence of driver distraction or fatigue at the scene
of a crash. Moreover, drivers may be reluctant to
admit distraction or fatigue because they may fear
being assigned blame for the incident. Therefore, the
determination of driver’s hypovigilance and distrac-
tion by FMT systems still poses a great challenge
and will provide support to overcome these
problems. Hypovigilance is a deficit of vigilance.
The latter describes the ability to sustained attention
and is given if a subject is able to perceive and
interpret random, relevant changes in the
environment and is able to make effective decisions
and to perform precise, motor actions. Two major
causes of hypovigilance are central fatigue and task
monotony. But, it is well known that several other
factors influence driver’s hypovigilance. It is a
complex issue with several facets (Leproult et al
2002, Trutschel et al 2006).
Driver’s hypovigilance depends for example on
time-of-day due to the circadian rhythm, on time-
since-sleep (long duration of wakefulness), on time-
on-task (prolonged work), inadequate sleep, and
accumulated lack of sleep. The last two factors may
be caused by pathological sleepiness due to diseases,
like sleep apnea or narcolepsy, or may be caused by
intentionally sleep loss due to prolonged time awa-
130
Sommer D., Golz M., Trutschel U. and Edwards D. (2009).
DETERMINATION OF DRIVER’S HYPOVIGILANCE FROM BIOSIGNALS.
In Proceedings of the International Conference on Agents and Artificial Intelligence, pages 130-135
DOI: 10.5220/0001746201300135
Copyright
c
SciTePress

ke. Moreover, there are also psychological factors
influencing the actual level of vigilance, e.g. motiva-
tion, stress, and monotony. The last is believed to
play a major role in driving, because it is mostly a
simple lane-tracking task with a low event rate.
Therefore, vigilance is considered as a psychophy-
siological variable not always increasing monotoni-
cally during driving. It shows slow waxing and
waning patterns, which can be observed in driving
performance and repeatedly self-reported sleepiness.
There are many biosignals which contain more
or less information on hypovigilance. Among them,
EEG is a relatively direct, functional reflection of
mainly cortical and to some low degree also sub-
cortical activities. EOG is a measure of eye and
eyelid movements and reflects activation / deactiva-
tion as well as regulation of the autonomous nervous
system.
Until recently, for the assessment of driver’s hy-
povigilance the analysis of EEG and EOG was based
on a variety of definitions involving PSD summation
in a few spectral bands which proved in clinical pra-
ctice. The same applies to the location of EEG elec-
trodes. Separate analysis of EEG of different electro-
des and of alternative definitions of spectral bands
led to inconsistent and sometimes contradicting re-
sults. Large inter-individual differences turned out to
be another problematic issue.
Therefore, adaptive methods with less predefi-
ned assumptions are needed for comprehensive hy-
povigilance assessment. Here we propose a combi-
nation of different brain (EEG) and oculomotoric
(EOG) signals whereby parameters of pre-proces-
sing and summation in spectral bands were optimi-
zed empirically. Moreover, modern concepts of dis-
criminant analysis such as computational intelligen-
ce and concepts of data fusion were utilized. Using
this general approach ensures optimal information
gain even if unimodal data distributions are existent
(Golz et al. 2007).
As a first step solution, we utilized SVM in order
to map feature vectors extracted from EEG / EOG of
variable segment lengths to two, independent types
of class labels. For their generation a subjective as
well as an objective measure was applied. Both ref-
lect different facets of hypovigilance: sleepiness and
performance decrements, respectively.
For the first type of labels, an orally spoken self-
report of sleepiness on a continuous scale, the so-
called Karolinska Sleepiness Scale (KSS), was
recorded every two minutes during driving. The
second type of labels was determined through
analyzing driving performance. In previous studies it
was found that especially the variation of lane
deviation (VLD) correlates well with hypovigilance
and attention state of drivers (Pilutti et al. 1999).
2 METHODS
2.1 Experiments
16 participants drove two nights (11:30 p.m. – 8:30
a.m.) in our real car driving simulation lab. One
overnight experiment comprised of 8 x 40 min of
driving. EEG (FP1, FP2, C3, Cz, C4, O1, O2, A1,
A2) and EOG (vertical, horizontal) were recorded at
a sampling rate of 256 Hz. PERCLOS as another
oculomotoric measure was recorded utilizing an
established eye tracking system at a sampling rate of
60 Hz. Also several variables of driving simulation,
like e. g. steering angle and lane deviation, were re-
corded at a sampling rate of 50 Hz. Lane deviation is
a good measure of driving performance and is used
here as an objective and independent measure of
hypovigilance as described below. Variation of lane
deviation (VLD) is the difference between two sub-
sequent samples of lane deviation normalized to the
width of lane. For example, moving the car from the
left most to the right most position of the lane results
in VLD = 100 %. The KSS was mentioned above
and is a standardized, subjective, and independent
measure of hypovigilance on a numeric scale bet-
ween 1 and 10. KSS was asked at the beginning and
after finishing driving. During driving only relative
changes in percent of the full range were asked
because subjects are more aware of relative than on
absolute changes.
2.2 Procedure Steps
To allow a comparison of the selected biosignals
regarding hypovigilance, pre-possessing and feature
extraction were performed due to the same concept
for all biosignals (Golz et al. 2007). First, non-over-
lapping segmentation with variable segment length
was carried out, followed by linear trend removal
and estimation of power spectral densities (PSD)
utilizing the modified periodogram method. Other
estimation techniques, such as Welch’s method, the
Multi-Taper method, and a parametric estimation
(Burg method), were also applied, but resulted in
slightly higher discrimination errors. It seems that
these three methods failed due to reduced variance
of PSD estimation at the expense of bias. In contra-
diction to explorative analysis, machine learning
algorithms are not such sensitive to higher variances.
Second, PSD values of all three types of signals
DETERMINATION OF DRIVER’S HYPOVIGILANCE FROM BIOSIGNALS
131
were averaged in spectral bands. In case of EEG and
EOG signals 1.0 Hz wide bands and a range of 1 to
23 Hz turned out to be optimal, whereas in case of
PERCLOS signals 0.2 Hz wide bands and a range of
0 to 4 Hz were optimal. All parameters were found
empirically at lowest discrimination errors in the test
set. Further improvements were achieved, but only
in case of electrophysiological features, by applying
a monotonic, continuous transform log(x).
2.3 Classification
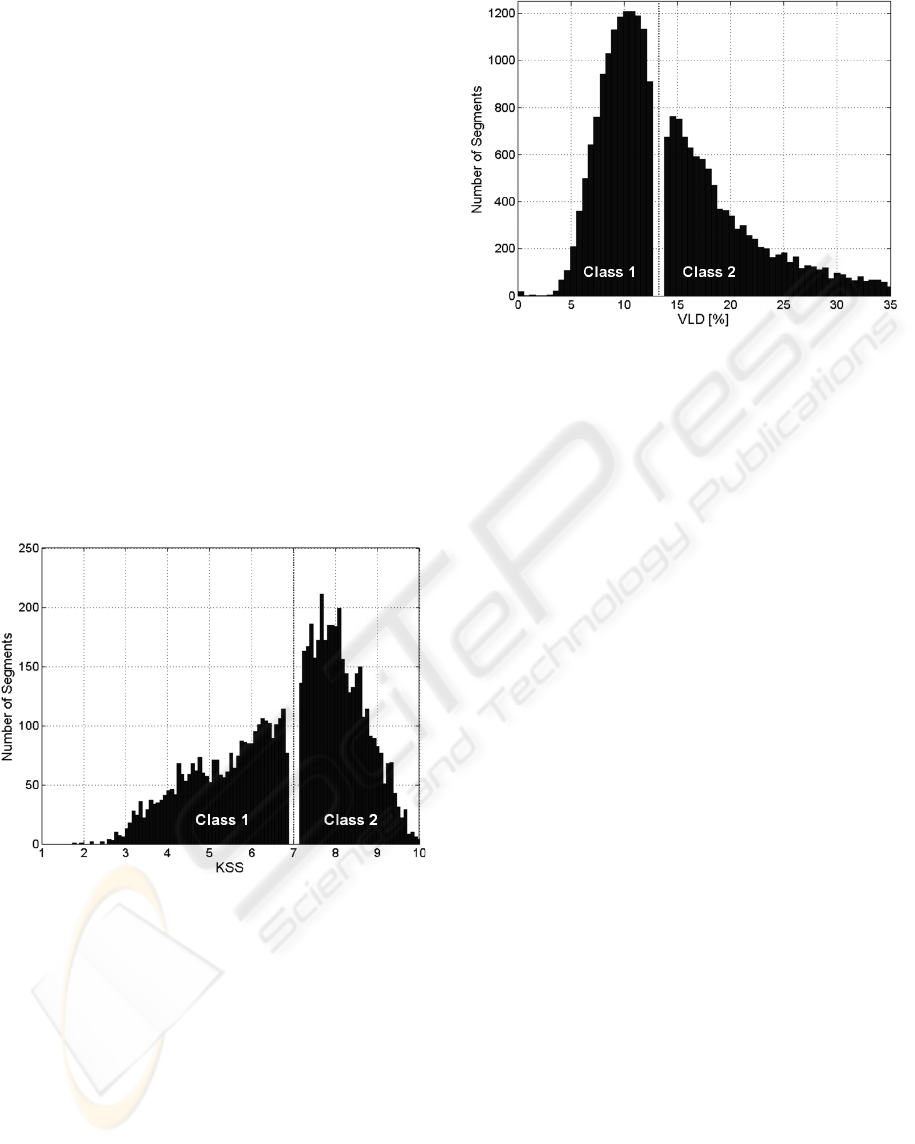
KSS and VLD values were divided into categories
‘slight hypovigilance’ (class 1) and ‘strong hypo-
vigilance’ (class 2). This was necessary to get labels
for discriminant analysis (classification). For the
subjective measure the threshold parameter was se-
lected at KSS = 7 (Fig. 1). For a better visualization
of separation between class 1 and class 2 samples in
the range of KSS = 6.9 … 7.1 were eliminated from
data set. This step turned out to be not crucial.
Results of classification (test set errors) showed not
much of a difference.
Figure 1: Histogram of subjective ratings of sleepiness
(KSS). Binarization leads to two classes: slight (class 1)
and strong hypovigilance (class 2). Values in the imme-
diate threshold region (around KSS=7) were eliminated.
The same binarization was applied also to the
objective measure. Threshold was determined at
VLD = 13.5 % and all samples in the range of VLD
= 13.0 % … 14.0 % were eliminated (Fig. 2). This
data elimination also turned out to be not crucial.
Segment length was always optimized (see be-
low) in order to get minimal test errors. Test errors
were estimated by multiple, random cross validation
(80 % training / 20 % test set). Due to the relatively
high dimensionality of the feature space a powerful
machine learning method, the Support-Vector Ma-
Figure 2: Histogram of objectively measured performance
(VLD). Binarization leads to two classes: slight (class 1)
and strong hypovigilance (class 2). Values in the imme-
diate threshold region were eliminated.
chine (SVM), was applied. SVM adapts an optimal
separating hyperplane without any presumptions on
data distribution. To achieve nonlinear discriminant
functions nonlinear kernel functions have to be app-
lied. Among several others, kernel functions such as
radial basis function k(x
1
,x
2
) = exp(-γ║x
1
-x
2
║
2
) and
the Coulomb function k(x
1
,x
2
) = (1+γ║x
1
-x
2
║
2
)
-d
performed best in our application. Three SVM para-
meters (slack variable, two kernel parameters) were
optimized carefully which requested high computa-
tional load (Golz et al. 2007). For each of the selec-
ted biosignals the segment length was varied in the
range of 10 to 300 seconds to find an empirical opti-
mum of the discrimination test error utilizing multip-
le hold-out cross validation. In general, small seg-
ment lengths lead to a high number of input vectors
following to higher complexity presented to the dis-
crimination algorithms and therefore to higher error
rates for all signals.
3 RESULTS
Discriminant analysis of different biosignals resulted
in different errors for KSS labels (Figure 3) and for
VLD labels (Figure 4). For the first, the PERCLOS
signal and the vertical component of EOG (EOGv)
showed relatively high errors and depend in similar
manner on segment length. EEG at location ‘Fp1’
showed lower errors for all segments length compa-
red to EEG at location ‘Cz’. The feature fusion of
EEG at all 7 locations and of both EOG components
resulted in lowest errors (Fig. 3, red). This confirms
our previous finding (Golz et al. 2007) that feature
ICAART 2009 - International Conference on Agents and Artificial Intelligence
132
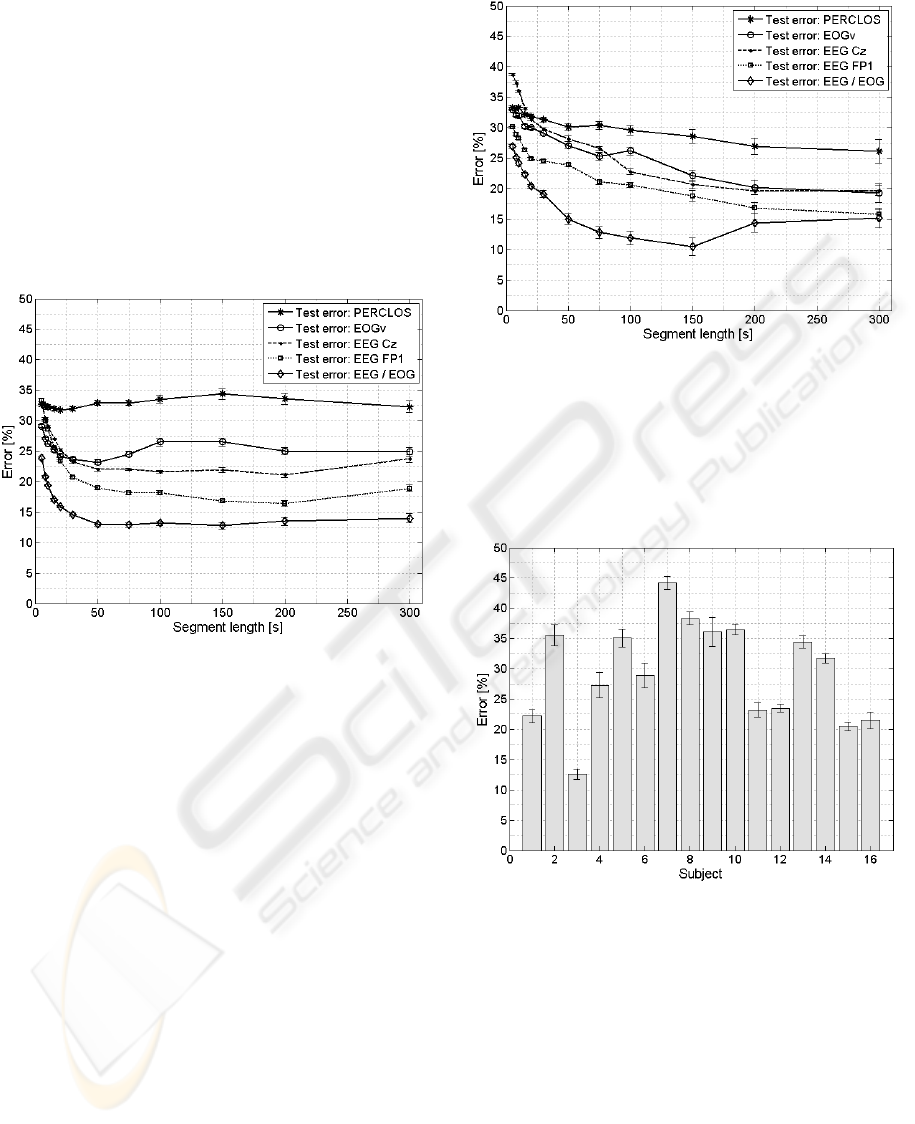
fusion of EEG and EOG lead to significant improve-
ments in the discrimination between two classes uti-
lizing SVM. Mean test errors of about 13 % yielded
in a relatively broad range of optimal segment
lengths between 50 and 150 seconds. PERCLOS
features resulted considerably worse (Fig. 3, blue).
Mean test errors varied between 32 and 34 % in the
whole range of segment lengths. Similar results for
EEG / EOG signals were found in a previous study
(Golz et al. 2005). In this study, which was based on
different data sets, the optimal segment length was
as well between 50 to 150 seconds. Learning Vector
Quantization was used instead of SVM as classifier.
Figure 3: Mean and standard deviation of test set errors for
selected biosignals. Features of PERCLOS performed
worse, whereas PSD feature fusion of EEG and EOG
performed best. Class labels were subjective KSS.
Slightly better, but basically comparable results
yielded if the objective measure (VLD) was utilized.
Lowest errors resulted if features of EEG and EOG
were fused together (Figure 4). Mean test errors of
about 10 % yielded at optimal segment lengths of
about 150 seconds. PERCLOS results were conside-
rably worse (Figure 4). Mean test errors varied bet-
ween 26 and 30 % if segment lengths were larger
than 50 seconds. The characteristics of the other sig-
nals EOG (vertical), EEG (Cz) and EEG (Fp1) as
function of segment length is clearly more complex
for the VLD labels than for KSS labels. The achie-
ved improvement in the test errors through feature
fusion in the case of the VLD labels was considerab-
le.
The question arises if machine learning algorithms
in combination with feature fusion concepts have
found some generally valid properties of driver hy-
povigilance in the selected EEG/EOG combination.
This was checked out by cross validation on the
subject level. Learning algorithms were tested on all
Figure 4: Mean and standard deviation of test set errors for
selected biosignals. PSD of PERCLOS performed worse,
whereas PSD feature fusion of EEG and EOG performed
best. Class labels were objective VLD.
data of only one subject after they were trained on
all data of all other subjects. This was repeated for
every subject.
Figure 5: Inter-individual differences of test set errors for
the feature fusion of EEG and EOG. Class labels were
subjective KSS.
Results show high inter-individual variability (Figu-
re 5 and Figure 6) indicating that common characte-
ristics were rarely found. Overall the inter-individual
variability is larger for subjective KSS labels than
for objective VLD labels. This can be explained in
that the subjects in our lab study are not professional
drivers and could have difficulties to assess their
own subjective alertness levels using KSS. The clas-
sification errors between slight and strong hypovigi-
lance are clearly subject specific. Overall, the discri-
mination ability of the SVM between the two
DETERMINATION OF DRIVER’S HYPOVIGILANCE FROM BIOSIGNALS
133
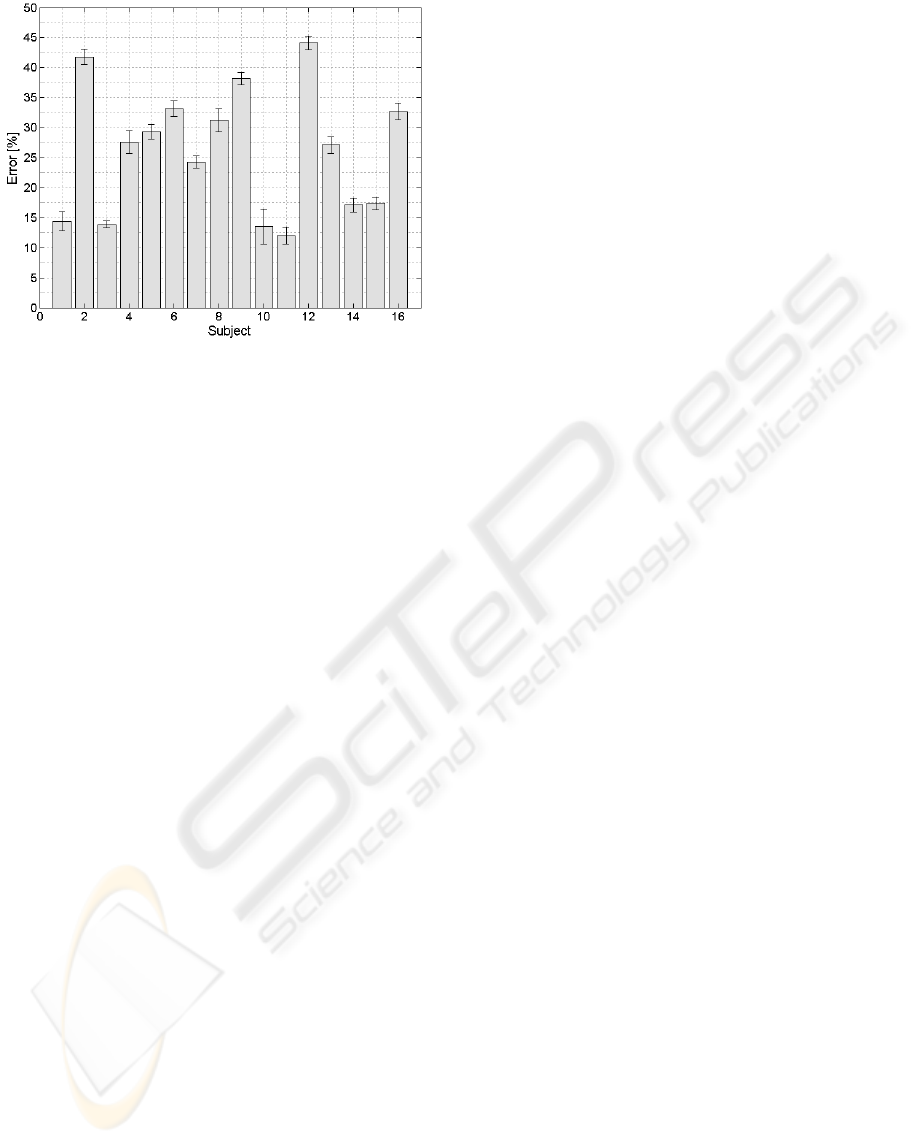
Figure 6: Inter-individual differences of test set errors for
the feature fusion of EEG and EOG. Class labels were
objective VLD.
classes is close to the optimal results only for subject
‘3’ using KSS labels (Figure 5) and close for the
subjects ‘1, 3, 10, 11’ using VLD labels (Figure 6).
4 CONCLUSIONS
Model free approaches are used in many different
fields. Hence, it would be appropriate for the fatigue
and performance research community to reach out
and explore alternative algorithms beyond rule based
statistical analysis of biosignals. This could help to
advance the complex issue of driver hypovigilance
which has eluded researchers for a long time.
Results of experimental investigations and subse-
quent adaptive data analysis yielded substantial dif-
ferences in the usefulness of electrophysiological
signals (EEG, EOG) compared to an oculomotoric
signal (PERCLOS) which is at the moment the most
often utilized measure of driver’s hypovigilance in
fatigue monitoring technologies, such as infrared
video camera systems. This main result is regardless
of the definition of hypovigilance, considering that
subjective (KSS) as well as objective (VLD) labels
has been utilized. Results were robust to different
variations in parameters such as segment length
which controls temporal resolution and amount of
information to be involved. Mean test errors of 13 %
and 10 % for subjective and objective labels,
respectively, show that feature fused EEG and EOG
has the potential to account for a reference standard
(gold standard) to evaluate fatigue monitoring
technologies (FMT). Mean test errors between 26 %
and 32 % for subjective and objective labels,
respectively, show that the PERCLOS signals seems
to carry less information on driver’s hypovigilance
than fused EEG and EOG.
Our results contradict results of other authors
(depicted in table 1 in Dinges et al 1998), where
PERCLOS was found to be most reliable and valid
for determination of driver’s hypovigilance level.
There, based on complete other data analyses, diffe-
rent measures of hypovigilance were compared.
EEG resulted worse than PERCLOS, whereas mea-
sures of head position and of eye blink behaviour led
to contradictory results between subjects. As a refe-
rence standard of hypovigilance they utilized measu-
res of the well-known psychomotor vigilance task
(PVT). Results are based on the fact that PERCLOS
varies simultaneously with attention lapses in PVT
which was repeated during 42 hours of sustained
wakefulness. However, some doubts were raised
(Johns 2003). It was pointed out that contradictions
are possible, e. g. under demands of sustained atten-
tion some sleep-deprived subjects fall asleep while
their eyes remain open. Unfortunately, PERCLOS
does not include any assessment of eye and eye lid
movements. Important dynamic characteristics
which are widely accepted, such as slow roving eye
movements, reductions in maximal saccadic speed,
or in velocity of eye lid re-opening, are ignored.
Their spectral characteristics were picked up in our
study through EOG and may account for the far
better results of EEG / EOG data fusion presented
here. Note, that highly dynamical alterations are
better reflected by EOG than by PERCLOS. Our
results support doubts stated in (Johns 2003) and
clearly show limitations of PERCLOS. Some serious
cautions should be considered when driver’s hypo-
vigilance is estimated relying solely on PERCLOS.
In general, the aim of many researchers on driver’s
hypovigilance in the 90’s to reduce such complex
issue to a simple threshold parameter (Dinges et al
1998) was presumably misguiding. Fortunately, this
has been corrected in recent projects. Different
approaches were investigated Schleicher et al. 2007,
among them also data fusion concepts (AWAKE
2004).
In addition, our previous findings (Trutschel et
al. 2006, Golz et al. 2005, Golz et al. 2007) have
shown that results on the assessment of driver states
differ from subject to subject, as well as to some
limited extent also from driving session to driving
session. This was confirmed in the current investi-
gations as well. This is a problematic issue for FMT
systems. Individualization will be needed for reliable
detection of driver’s hypovigilance. To find practical
solutions in order to address intra-individual diffe-
rences in discrimination of slight and strong hypo-
ICAART 2009 - International Conference on Agents and Artificial Intelligence
134

vigilance future investigations are required. For
example, it could be futile to master group-average
model predictions before exploring means of predic-
ting individual hypovigilance. Due to large inter-
subject variability in subjective alertness (KSS) and
driving performance (VLD), it may turn out to be
easier to develop reliable and accurate models of
individualized measures of hypovigilance on the
basis of an individual’s data fusion concept than
group-average vigilance models based on a single
data stream.
ACKNOWLEDGEMENTS
The authors would like to acknowledge BHP
Billiton for its participation and continued interest in
this research effort.
REFERENCES
AWAKE, (2004). System for Effective Assessment of
Driver Vigilance and Warning According to Traffic
Risk Estimation. Road Safety Workshop, Balocco
(Italy), http://www.awake-eu.org/index.html.
Dinges D, Grace R, (1998). PERCLOS: A Valid
Psychophysiological Measure of Alertness As
Assessed by Psychomotor Vigilance. TechBrief
NHTSA, Publication No. FHWA-MCRT-98-006.
Golz M, Sommer D, (2005). Detection of Strong Fatigue
During Overnight Driving. 39th Annual Congress of
the German Society for Biomedical Engineering
(BMT 2005), pp 479-480, Part 1,Nürnberg, Germany.
Golz M, Sommer D, Chen M, Trutschel U, Mandic D,
(2007). Feature Fusion for the Detection of
Microsleep Events. The Journal of VLSI Signal
Processing, vol. 49, pp. 329-342, ISSN 0922-5773,
Springer, Netherlands.
Johns M, (2003). The Amplitude-Velocity Ratio of Blinks:
A new Method for Monitoring Drowsiness. Sleep, vol.
26, pp.A51-52.
Leproult R, Coleccia E, Berardi A, Stickgold R, Kosslyn
S.M., Van Cauter E, (2002). Individual differences in
subjective and objective alertness during sleep
deprivation are stable and unrelated. Am J Physiol
284, pp R280-R290.
Pilutti T, Ulsoy G, (1999). Identification of Driver State
for Lane-Keeping Tasks. IEEE Transactions on
Systems, Man, and Cybernetic, Part A: System and
Humans, vol. 29, pp. 486-502.
Schleicher R, Galley N, Briest S, Galley L (2007).
Looking Tired? Blinks and Saccades as Indicators of
Fatigue. Ergonomics 51: 982-1010.
Trutschel U, Sommer D, Aguirre A, Dawson T, Sirois B
(2006). Alertness Assessment Using Data Fusion and
Discrimination Ability of LVQ-Networks. 10th
International Conference on Knowledge-Based &
Intelligent Information & Engineering Systems (KES
2006), pp. 1264-1271,Bournemouth, UK.
DETERMINATION OF DRIVER’S HYPOVIGILANCE FROM BIOSIGNALS
135
