
RESPIRATORY SINUS ARRHYTHMIA IN 10 YEAR OLDS
Normal and Intrauterine Growth Restricted
Taher Biala
1
, Fernando Schlindwein
1
, Michael Wailoo
2
and Michael Bankart
2
1
Department of Engineering, University of Leicester, U.K.
2
Department of Health Science, University of Leicester, U.K.
Keywords: Respiratory sinus arrhythmia, Frequency domain analysis, Autoregressive model, Hypertension, Barker
theory.
Abstract: Frequency domain analysis of RR has been determined by three methods, autoregressive model (AR), Fast
Fourier Transform (FFT) and Lomb periodogram for 10 min segments. The first two methods were done
after resampling and the third method without resampling RR series of all 75 children. AR was used in this
work, and RSA was identified at night time during sleep. The area of the RSA was calculated for every 10
min interval and compared to the overall area of the 10 min segment, then the average RSA of all segments
was calculated, as well as the overall percentage of the RSA energy to the total area for the whole period of
sleeping. This was done firstly for a sample of Normal and IUGR 10 year olds. Secondly for all the children
under study, an independent t-test concluded that there is no significant difference between the IUGR and
Normal (p=0.7467).
1 INTRODUCTION
HRV is a powerful non-invasive tool used by
physicians to determine the state of the heart and
assess the development of the ANS. This work
describes the results obtained by HRV analysis of
two groups of children, 41 IUGR and 34 controls for
a period of 24 h .The main objective of the work is
to find any correlation between HRV of children at
10 years and the Barker Theory and hypothesis,
which states that IUGR children are prone to
coronary disease and hypertension in their adulthood
(Barker, 2004). The RR interval normally oscillates
periodically, shortening with inspiration and
lengthening with expiration. This is known as
Respiratory sinus arrhythmia, and it’s due partly to
the Bainbridge reflex via the expansion and
contraction of the lungs and the cardiac filling
volume caused by variations of intrathoracic
pressure (Azuaje et al., 2007). During inspiration,
the pressure within the thorax decreases increasing
blood influx into the right atrium resulting in a reflex
that increases the heart rate (i.e., shortens the RR
intervals). During expiration, the reverse of this
process results in a slowing of the heart rate.
2 METHODS
The Task force (Task force of European Society of
Cardiology and the North American, 1996) specifies
the standards used in HRV studies, where time
domain and frequency domain analysis can be used
to study heart rate variability.
The RR signal is subjected to a process of
interpolation to obtain an equally spaced data to be
used for spectral analysis. FFT and AR must have an
equally spaced data to perform spectral analysis. The
signal has been re-sampled at 4 Hz after a cubic
spline data interpolation. This will give us the results
in Hertz and allows the spectrum analysis up to 2
Hz. The AR spectral method (equation 1),(because
of better resolution than FFT when dealing with low
sampling Frequency), have been tested on the RR
data to find the frequency components of the power
spectrum for 10 min segments .The RSA frequency
range (HF) is defined to be from 0.15 to 0.40 Hz
(Azuaje et al., 2007).
510
Biala T., Schlindwein F., Wailoo M. and Bankart M. (2009).
RESPIRATORY SINUS ARRHYTHMIA IN 10 YEAR OLDS - Normal and Intrauterine Growth Restricted
.
In Proceedings of the International Conference on Bio-inspired Systems and Signal Processing, pages 510-513
Copyright
c
SciTePress
2.1 Figures and Tables
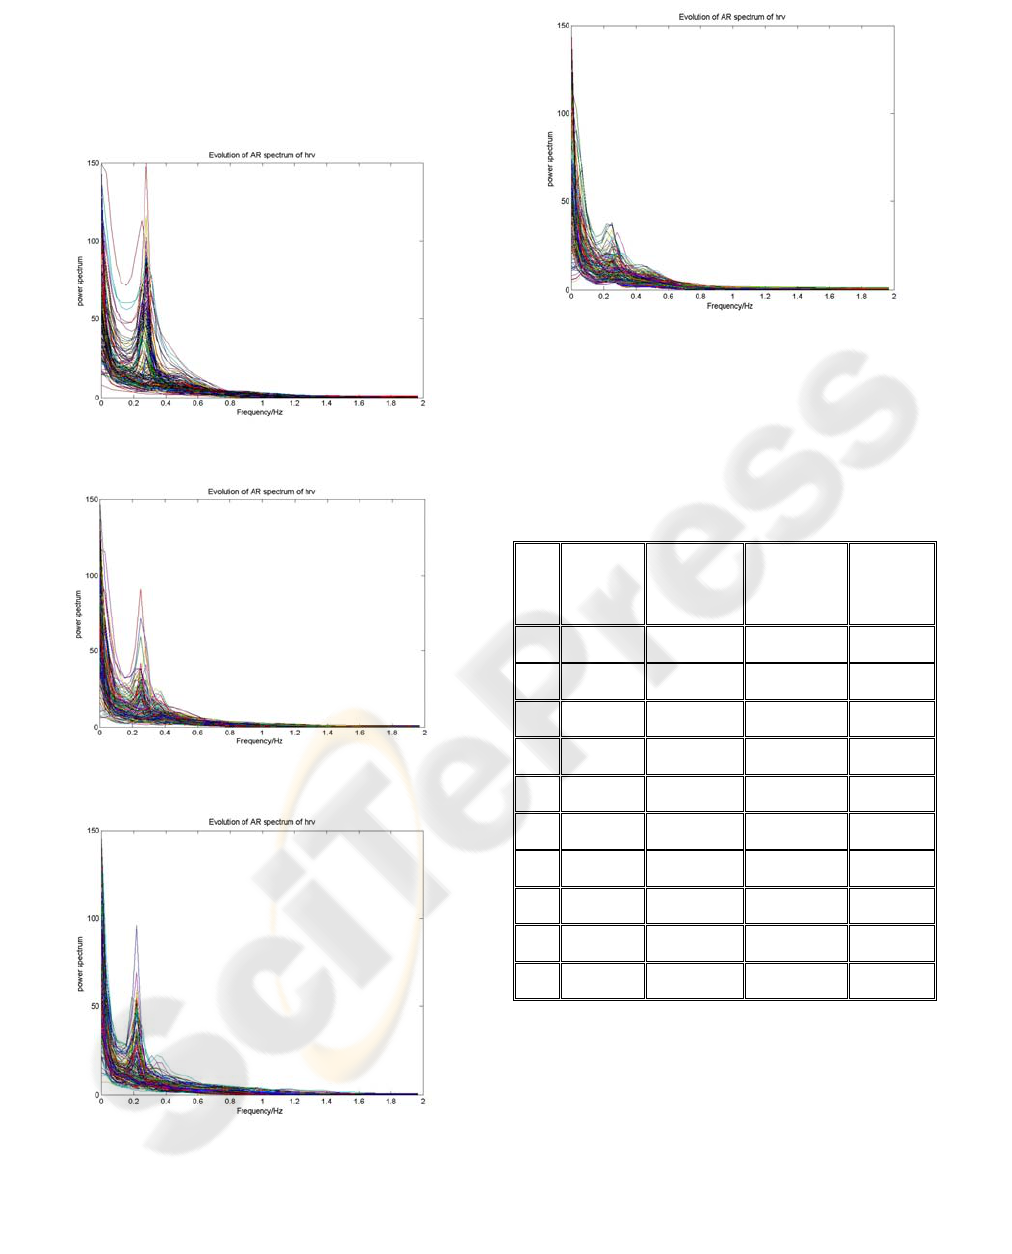
The AR spectral analysis of 10 segments produces a
graph as shown in Fig. 1. Graphs (a, b) are for
Normal children, and (c, d), for IUGR children.
Figure 1(d): AR power spectrum of IUGR child with less
RSA.
The application of an algorithm to find the
energy of the RSA (area), by using Trapezoidal
method (equation 2), produced the following table 1:
Figure 1(a): AR spectrum of Normal child with RSA.
Table 1: The RSA Energy, Total, and % of RSA to Total
for IUGR and Normal children.
No
child RSA
(energy)
u
2
Total
(energy)
u
2
%
RSA/
Total
1 IUGR 4.5936 10.3187 45.6287
2 IUGR 2.3244 5.8750 39.8064
3 IUGR 2.5484 5.5834 45.9105
4 IUGR 5.2631 10.6212 50.0502
5 IUGR 8.5370 18.5431 46.6481
6 Normal 6.9783 12.6834 54.7855
7 Normal 2.6899 6.7861 41.3924
8 Normal 3.6029 9.0093 40.0707
9 Normal 5.0364 11.0507 45.2321
10 Normal 3.7838 8.8850 43.0941
Figure 1(b): AR spectrum of Normal child with less RSA.
2.2 Equations
The equation of AR process of order p can be
written as:
Figure 1(c): AR power spectrum of IUGR child with RSA.
ptptttt
xaxaxanx
−−−
++
+
...
2211
=
+
RESPIRATORY SINUS ARRHYTHMIA IN 10 YEAR OLDS - Normal and Intrauterine Growth Restricted
511
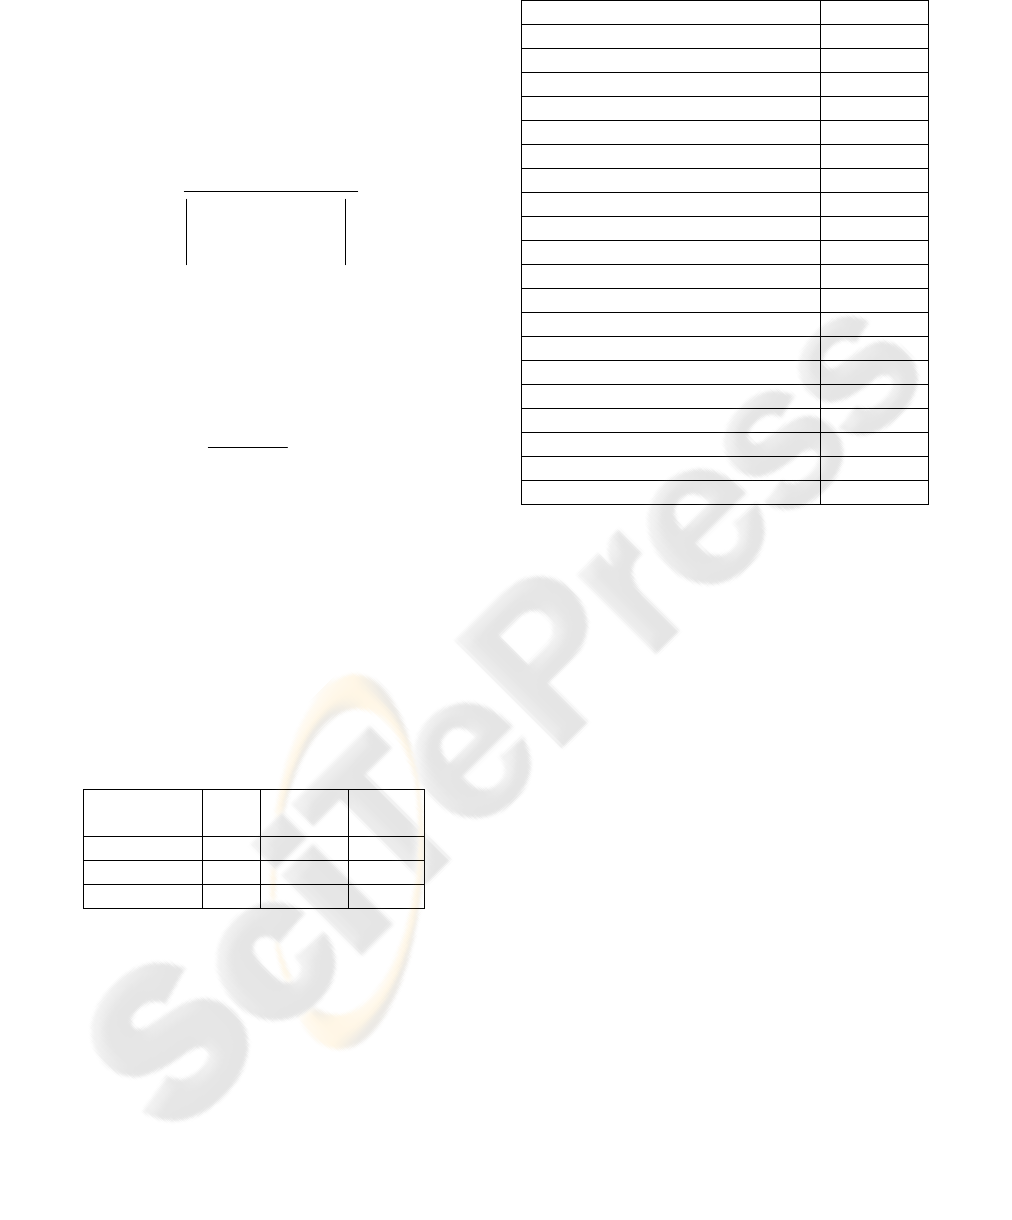
Table 3.
where is the white noise driving signal p is the
order of the AR model, and ( ) are the
parameters of the filter.
t
n
Variable p-value
Sex * 0.32
Breast Feeding (y/n) * 0.50
Parental Smoking (y/n) * 0.99
Household Smoking (y/n) * 0.72
IMD # 0.06
24 hour SBP # 0.59
24 hour DBP # 0.87
BMI # 0.77
Significant Medication * 0.26
Using Medication * 0.36
Birth Weight # 0.45
Length Gestation # 0.50
Weight change from birth # 0.77
Night SBP # 0.79
Night DBP # 0.60
Day SBP # 0.46
Day DBP # 0.64
Cortisol morning # 0.29
Cortisol night-time # 0.66
p
aa .......
1
The AR power spectrum density estimate is
given by the following equation (Boardman et al.,
2002):
2
1
2
2
1
)(
∑
=
Δ−
+
Δ
=
p
K
tfkj
AR
ea
t
fP
k
π
σ
(1)
Where
σ
2
is the variance of the white noise
driving function and
Δ
t is the re-sampling interval.
The Trapezoid method in equation (2) was used
to find the energy (area) of the RSA:
(2)
2
)( hba
A
+
=
Where (a and b) are the two parallel sides and h
is the distance (height) between them.
* = independent t-test, # = correlation
Statistically, an independent t-test was used for
equality of means between IUGR and Normal in
terms of RSA, and to verify the Null hypothesis
which is, there is no difference in the RT score
(Average of all ratio of RSA energy to total energy
within 10 min segment for night time).
3 DISCUSSION
The results obtained are both qualitative and
quantitative. The graphs in Figures 1(a) and 1(b),
show the evolution of the AR spectrum of the HRV
for a Normal child. It can be seen that the RSA
energy in child (a) is higher than the RSA energy for
Normal child shown in Figure 1(b). The frequency at
which RSA occurs in (a) is at 0.3 Hz, but for child
(b), RSA occurs at 0.25 Hz. The RSA for IUGR
children can be seen in figures 1(c) and 1(d). Child
(d), has RSA at Frequency of 0.2 Hz, and Child (c),
at approximately 0.25Hz. The calculations of RSA
energy from IUGR and Normal children are shown
in table 1 in arbitrary units squared (gain is not
calibrated). The data presented in the table shows
that the lowest energy of RSA is 39.8 u
2
, and the
highest is 50 u
2
for IUGR. Normal children has the
lowest energy of RSA is 40 u
2
, and the highest is
54.78 u
2
.
Table 2 and 3 shows the results of the
independent t-test:
Table 2: IUGR and Normal Independent t-test results.
Group
n Mean SD
IUGR 37 46.83 6.10
Normal 30 47.27 4.65
The t-test showed that there was no significant
difference between the two groups for RT score,
difference = 0.44, t = 0.32, p=0.7467 (95% CI = -
3.1, 2.3). There was homogeneity of variance
(Levene’s Test, p=0.14) and the data was
approximately normally distributed within each
group.
The result of the t-test shows no significant
difference between the two groups for the RT score,
but when looking at other variables, IMD was found
to be(p=0.06). Which means that the children who
have high index of multiple deprivation (IMD) are
very correlated with RT score, and consequently this
Other variables were assessed for significance
but none of them significantly predicted (RT) score,
although IMD (Index of Multiple Deprivation) was
borderline (0.06).
BIOSIGNALS 2009 - International Conference on Bio-inspired Systems and Signal Processing
512

means that the deprived children don’t have a
synchronized breathing pattern at night time.
4 CONCLUSIONS
This work identifies the RSA in two ways, the first
is graphically, and the second, in terms of the RSA
Energy (area). RSA is an interesting phenomenon
which represents the parasympathetic branch of the
Autonomic nervous system. RSA occurs at
frequency between 0.15 Hz and 0.4 Hz at night time
and at this frequency (HF), RR intervals tend to be
longer than at day time due to the parasympathetic
tone, and consequently heart rate will be slower. At
night ventilation is more regular; hence it is easier to
identify the peak corresponding to RSA.
RSA can not be used to distinguish between the
IUGR and normal children, because there is no
significant difference between the two groups. Other
variables, such as parental smoking and household
smoking can not predict any differences in RSA.
Children who have high index of multiple
deprivation (IMD) are very correlated with RT
score, and consequently this means that the deprived
children don’t have a synchronized breathing pattern
at night time.
REFERENCES
Barker DJP, “The development origin of chronic adult
disease.” Acta Paediaatrica., volume 93, pp, 26-33
(2004).
Azuaje F., Clifford D.G., MacSharry P., “Advanced
Method and tools for ECG Data Analysis”, (2007).
Task force of European Society of Cardiology and the
North American, “Heart Rate variability-Standards of
measurements, physiological interpretation, and
clinical use”, circulation, volume 93, pp. 1043-1065,
(1996).
Boardman A., Leite A., Rocha A., Schlindwein F., “A
study on the optimum order of autoregressive models
for heart rate variability” Physiological Measurement
volume 23, N.2, pp. 235-336, (2002).
RESPIRATORY SINUS ARRHYTHMIA IN 10 YEAR OLDS - Normal and Intrauterine Growth Restricted
513
