
IN-SITU, REAL-TIME BIOREACTOR MONITORING BY FIBER
OPTICS SENSORS
R. G. Silva
1
, J. S. Silva
1
, A. A. Vicente
1
, J. A. Teixeira
1
and R. C. Martins
2∗
1
IBB - Institute for Biotechnology and BioEngineering, Universidade do Minho
Campus de Gualtar, 4710-057 Braga, Portugal
2
BioInformatics - Molecular and Environmental Biology Research Center, Universidade do Minho
Campus de Gualtar, 4710-057 Braga, Portugal
Keywords:
UV-VIS-SWNIR spectroscopy, Real-time monitoring, Multivariate calibrarion.
Abstract:
One of the most studied bioprocesses is fermentation by yeasts. Although this is true, there is still the lack
of real-time instrumentation that is capable of providing detailed information on metabolic state of fermen-
tations. In this research we explore the possibility of using UV-VIS-SWNIR spectroscopy as a high-output,
non-destructive and multivariate methodology of monitoring beer fermentation. We herein report the imple-
mentation of the a fibber optics sensor and the capacity for detecting key parameters by partial least squares
regression for biomass, extract, pH and total sugars. Results show that UV-VIS-SWNIR is a robust technique
for monitoring beer fermentations, being able to provide detailed information spectroscopic fingerprinting of
the process. Calibrations were possible to obtain for all the studied parameters with R2 of 0.85 to 0.94 in
the UV-VIS region and 0.95 to 0.97 in the VIS-SWNIR region. This preliminary study allowed to conclude
that further improvements in experimental methodology and signal processing may turn this technique into a
valuable instrument for detailed metabolic studies in biotechnology.
1 INTRODUCTION
The most common bioprocess in bioengineering is
fermentation. Fermentation is the result of plant
physiology, yeast physiology, metabolomics and
quimiomics, and as well as of physical phenomena,
such as fluid flow, heat and mass transfer. Because
this complex system is auto-organized inside a biore-
actor during fermentation, fermentations have been
controlled using only macroscopic variables, such
as, temperature, pH and CO
2
pressure. Neverthe-
less, these provide low discrimination and informa-
tion on how to control the metabolic transformations,
especially because fermented products differ not in
macroscopic chemical composition, but rather in mi-
cro quantities which are especially relevant, such as
key odorants in beer or wine, or in the production of
pharmaceutical highly valued drugs.
The metabolome has been mostly studied by tar-
geted approaches in analytical chemistry techniques.
These are not capable to obtain in real time the
metabolomics inside bioreactors and are usually de-
structive methodologies. Therefore, various on-line
∗
Corresponding author: rui.martins@bio.uminho.pt
analytical methods, such as flow injection analysis
(FIA), liquid chromatography(HPLC), infrared spec-
troscopy (IR), gas chromatography (GC) and mass
spectrometry (MS), become more and more popu-
lar in metabolic studies (Schugerl, 2001). Although
these are highly accurate methods for metabolic stud-
ies, these are difficult to be implemented in-line, not
only due to their high price, but because they need
special and highly controlled conditions to operate.
Spectroscopy is a powerful multivariate method-
ology that have great potential for the metabolomics
study in biological systems. It provides a conve-
nient method for analysis of liquids, solutions, pastes,
powders, films, fibres, gases and surfaces, and mak-
ing possible to characterize proteins, peptides, lipids,
membranes, carbohydrates in pharmaceuticals, foods,
plants or animal tissues. It can also provide detailed
information about the structure and mechanism of
action of molecules (Stuart, 1997). Over the past
decade, interest in bioprocess monitoring using non-
invasive infrared spectroscopic sensors has increased.
This is mainly due to their rapid simultaneous multi-
variate determination ability, in situ sterilizability, and
low need for maintenance during operation. Among
the various spectral regions, near-infrared(NIR) spec-
327
G. Silva R., S. Silva J., A. Vicente A., A. Teixeira J. and C. Martins R. (2009).
IN-SITU, REAL-TIME BIOREACTOR MONITORING BY FIBER OPTICS SENSORS.
In Proceedings of the International Conference on Bio-inspired Systems and Signal Processing, pages 327-336
DOI: 10.5220/0001549503270336
Copyright
c
SciTePress

troscopy has been used widely due to ease of sam-
pling using fiber optics, and inexpensive and robust
instrumentation (Cooper et al., 1997; Yano et al.,
1997; Majara et al., 1998; Yeung et al., 1999; Alison
et al., 2000; Rhiel et al., 2002).
UV-VIS spectroscopy has not been used in bio-
process engineering, where the use of near infrared
(NIR) has been preferred due to the association to
specific vibrations of molecular groups (Workman,
1993). It has been widely accepted that vibrational
spectroscopy is more adequate for organic chemistry
measurement than transitional spectroscopy (Faust,
1992). However, NIR spectroscopy has as high in-
convenience the high absorbance of water in this re-
gion, which greatly decreases the sensitivity, being
more difficult to detect metabolites in lower concen-
trations. Furthermore, NIR and MIR equipments are
more expensive, and today’s cheap miniaturized spec-
trometers are capable to detect with high precision in
the UV-VIS-SWNIR region.
UV-VIS-SWNIR has not been used for a fer-
mentation monitoring. This is perhaps attributed to
the fact that UV-VIS spectroscopy records transmi-
tions between electron energy levels from molecu-
lar orbitals, instead of vibrational or structural os-
cillation of molecular groups as in the infrared re-
gion. Electronic transitions in the UV-VIS region
depend upon the energy involved. For any molecu-
lar bound (sharing a pair of electrons), orbitals are
a mixture of two contributing orbitals σ and π, with
corresponding anti-bounding orbitals σ
∗
and π
∗
, re-
spectively (Bruice, 2006). Many organic molecules
present conjugated unsaturatedand carbonylsbounds,
such as aminoacids, phospholipids, free fatty acids,
phenols and flavonoids, peroxides, peptides and pro-
teins, sugars and their polymers absorbance in these
bands. Furthermore, many biological molecules
present chromophore groups, which increase the ab-
sorption in the UV-VIS region, such as: nitro, ni-
troso, azo, azo-amino, azoxy, carbonyl and thiocar-
bonyl, which can be used to characterize the different
metabolomic stages that occur on a bioprocess. Fur-
thermore, UV-VIS-SWNIR registers many features
such as fluorescence and vibrational resonances due
to energy decay of exited electrons, which may pro-
vide highly accurate fingerprinting of metabolites and
metabolic state of the fermentation.
In this research we explore the use of fiber op-
tics sensors for monitoring the yeast metabolic ac-
tivity during beer fermentation. Beer its the final re-
sult of wort fermentation with selected yeast. As the
metabolism is dependent on several internal and ex-
ternal variables the main objectives of this work were:
i) implement a fibber optics sensor capable of re-
producibility and immunity to processing conditions;
ii) determine the capacities of UV-VIS-SWNIR spec-
troscopy in capturing detailed metabolic features dur-
ing fermentation; and iii) determine the capacity for
detecting key metabolites by partial least squares re-
gression of the signal (biomass, extract, pH and sug-
ars).
2 MATERIALS AND METHODS
2.1 Fermentation
Two complete fermentations were monitored in this
exploratory study. The conical cylinder fermentor,
with maximum volume 1.9 L and a work volume of
1.4 L in Figure 1 (a) was used. To maintain a con-
stant temperature of 18
o
C a refrigeration serpentine
involves the cylindrical part of the bioreactor, being
possible to achieve a complete fermentation in 5 days.
The fermentation starts by adding the inoculum to the
malt wort (13.4
o
Brix) previously put inside the biore-
actor. The inoculum is composed of Saccharomyces
pastorianus (carsbergensis) (brewing yeast) with a
concentration of 12 to 16x10
6
cells / ml of wort. An
inoculum stock was stored in a freezer at −80
o
C in
order to obtain reproducibility between batches. In-
oculum was prepared in the following fashion: the
microorganisms were incubated in wort (previously
aired) under anaerobic conditions on a rotary shaker
(120 rpm) at 27
o
C for 72h. After this period of time
the yeast were collected from the wort by centrifu-
gation (5000 rpm for 10 minutes) in Sigma 4K15
(Sigma, 2008), and then diluted in NaCl (0,9% v/v)
in the reason of 4 ml/g of yeast, to form a paste.
Once obtained this paste it’s necessary determine, by
direct counting in the microscope of the yeast, the
correct volume of inoculum, to ensure the necessary
initial concentration of yeast on the fermentor (12 to
16x10
6
cells / ml). After this, the required volume
of inoculum is calculated and added to the wort to
begin fermentation. Monitorization was performed
at-line by removing 15 ml samples with a frequency
of three samples per day during the consecutive five
days of fermentation. These samples were thereafter
subjected to both spectroscopy and physical-chemical
measurements.
2.2 Spectroscopy
UV-VIS-SWNIR spectroscopy measurements
were performed using the fiber optic spec-
trometer AvaSpec-2048-4-DT (2048 pixel, 200-
1100nm)(Avantes, 2005). Standard Transmition
BIOSIGNALS 2009 - International Conference on Bio-inspired Systems and Signal Processing
328
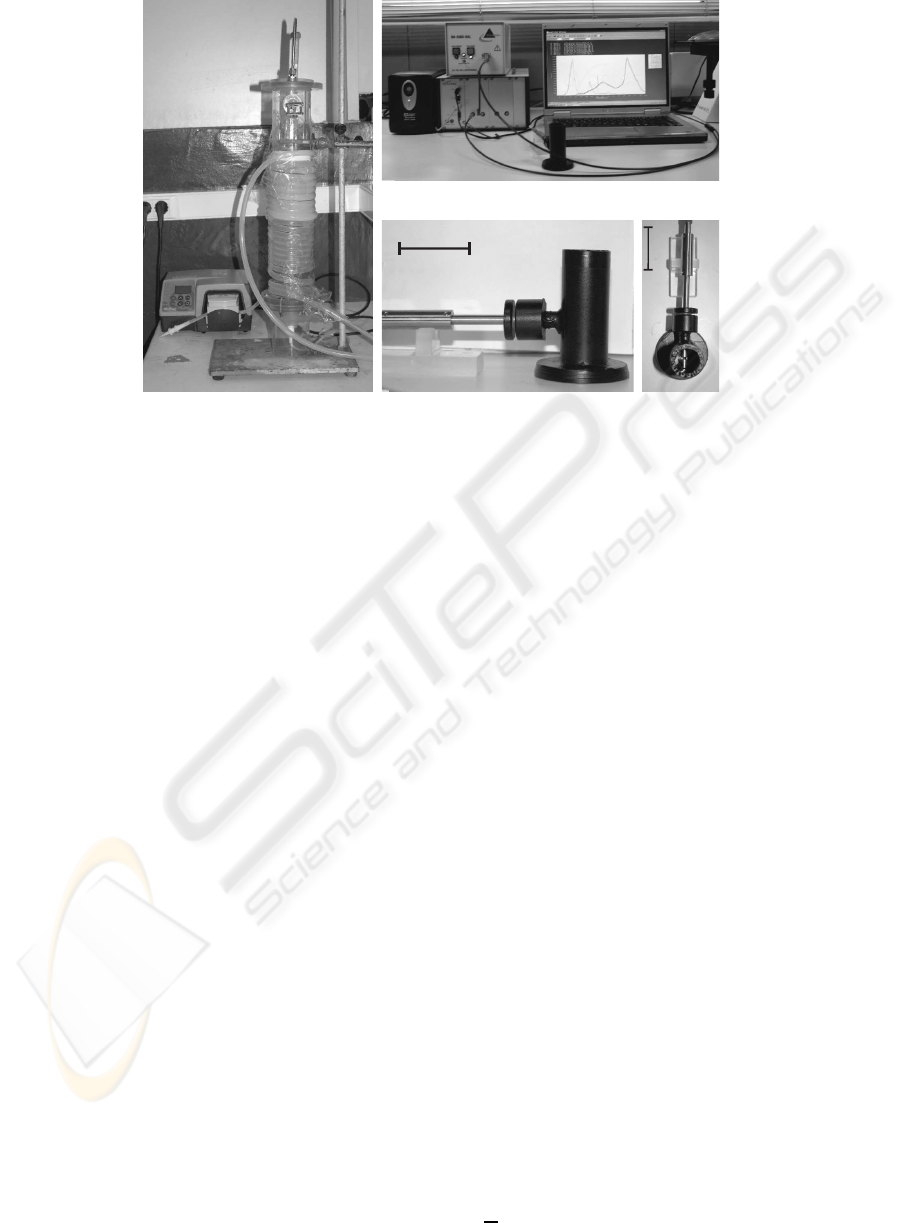
(a)
5 cm
5 cm
(c) (d)
(b)
Figure 1: Experimental setup: (a) Fermentor; (b) Equipment for spectroscopy analysis (Spectrometer, Light source, Com-
puter with spectroscopy software, Transmition dip probe and Probe holder); (c) Probe holder, side view and corresponding
dimensions and (d) Probe holder, up view and corresponding dimensions).
dip probes T300 - RT-5mm UV-VIS and VIS-
NIR (200-1100 nm) for UV-VIS and VIS-SWNIR
(Ocean-Optics, 2008) were adapted to a special probe
container designed to isolate the environmental light
and maintain the probe at the horizontally to prevent
the deposition of debris in the mirrored surface,
as presented in Figures 1 (b) to 1 (d). A balanced
deuterium tungsten Light Source - DH2000-Bal was
used for UV-VIS and VIS-SWNIR transmission
measurements (Ocean-Optics, 2008); and recorded
using AvaSoft 7.0 software (Avantes, 2007). All
measurements were performed at the room temper-
ature of 18±2
o
C. The deuterium lamp (UV-VIS)
was let to stabilize during 20 min; and the tungsten
lamp (VIS-SWNIR) was let to stabilize during 15
min. The dark spectra was recorded and the spectra
measurements were taken with linear and electric
dark correction. Both light spectra were monitored by
statistically assessing the reproducibility of the light
source with measurements of light during the several
days of the experiment. The spectra were acquired
three times a day to follow the different stages of the
fermentation. Ten spectra replicates were recorded
of UV-VIS and VIS-SWNIR measurement for each
sample of the fermentation to study scattering effects.
2.3 Physic-chemical Analysis
Cell Concentration: Samples were centrifuged
(5000 rpm for 5 minutes) to remove the yeast from
beer; To determine the concentration of yeast cells.
The yeast removedby centrifugationwas resuspended
in 15 ml of NaCl (0.9% v/v), and after performing
the appropriate dilution, cell concentrations were de-
termined with a Neubauer improved counting cham-
ber at the microscope. pH determination: 2 ml
of each centrifuged beer were analyzed in triplicate
in a Metrohm 691 pH meter following the instruc-
tions from (Metrohm, 2008); Total sugars: sugar
weight percentage in solution was obtained through
refractometry, by placing 1 ml of sample in the
AR12 SCHMIDT+HAENSCH ABBE refractometer
(Schemidt-haensch, 2008); Dry extract: three sam-
ples of 1 ml each were placed in the oven at 105
o
C
for 24 h and the dry weight of this samples was calcu-
lated matching the dissolved solids concentration in
the original samples .
2.4 Analysis and Multivariate
Calibration
2.4.1 Spectra Pre-processing
The large biochemical transformations of fermenta-
tion makes impossible use the same integration time
for all the fermentation sampling times. Under these
circumstances, all the collected spectra were trans-
formed into intensity (I) to remove this effect (I =
Raw Signal/Integration Time) and smoothed by us-
ing the Stavisky-Golay filter (length = 15, Order=
2) (Stavitzky and Golay, 1964). Afterwards, spectra
was transformed into absorbance (Figure 2): Abs
i
=
log
I
0
I
i
; where Abs
i
is the absorbance spectra for the
IN-SITU, REAL-TIME BIOREACTOR MONITORING BY FIBER OPTICS SENSORS
329
360 380 400 420 440 460
2.5 3.0 3.5 4.0 4.5 5.0 5.5
(a)
Wavelength (nm)
Absorbance
600 700 800 900 1000
1.0 1.5 2.0 2.5 3.0 3.5 4.0 4.5
(b)
Wavelength (nm)
Absorbance
Figure 2: Absorbance spectra: (a) UV-VIS; (b) VIS-SWNIR.
different samples, I
0
is the light spectra and I
i
sam-
ple spectra intensities, respectively. Furthermore,
small scattering artifacts were corrected using a mod-
ified robust multiplicative scatter correction algorithm
(RMSC) (Martens and Stark, 1991; Martens et al.,
2003; Gallager et al., 2005): x
corr
= xb+ a = x
ref
.
The a and b are computed by minimizing the follow-
ing error: e
j
= bx
j
+ a − x
ref
; where the x
j
is the j
sample spectrum and x
ref
is a reference spectrum.
2.4.2 Qualitative Spectral Analysis
It is well known that beer fermentation has: i) initial
lag phase where the yeast initiates its metabolism for
budding; ii) exponential phase, where the yeast repro-
duces at high rates increasing biomass and metabo-
lites such as alcohol and CO
2
; and iii) floculation -
when the yeast forms colonies that are became denser
than the wort and start to flocculate; and iv) decrease
in metabolic activity. As the physical-chemical com-
position was followed, it is possible to performa qual-
itative spectral analysis to these important steps, iden-
tifying important spectral zones which correspond
to characteristic absorbance bands. Such allows to
comment on qualitative increases and decreases on
groups of compounds which are formed or degraded
during fermentation, providing information about the
wavelengths and the corresponding compounds that
are suffering transformations over the process time
(Ozaki et al., 2001).
2.4.3 Multivariate Regression Methods
Partial least squares regression (PLSR) is a multivari-
ate regression method, which is used to relate multi-
variate data set X to a reference value y (Wold et al.,
1983; Geladi and Kowalsky, 1986; Martens and Naes,
1989):
y = X· b+ e (1)
where, b represents the regression coefficient and
e the error. Typically, X is a low-cost and high-output
multivariate method, such as UV-VIS-SWNIR mea-
surements, whereas y are often time-consuming and
expensive reference methods, such as metabolomic
data. The overall purpose of PLSR is to interpret the
relationship between the two data sets, and being able
to predict y in order to use spectroscopy as a soft-
ware sensor. Partial least squares regression (PLSR)
is a well established regression methodology apply-
ing least squares regression on a small number of or-
thogonalfactors (the scores or latent variables) if both
dependent (Y) and independent (X) variables. PLSR
algorithms maximize the covariance between Y and
X (cov(Y,X)) (Denham, 1995; Denham, 1997; Jong,
2003). PLSR can cope with the non-linear features
of spectra, because regression is performed in the la-
tent variables obtained by orthogonal decomposition
of both dependent and independent data sets (Geladi
and Kowalsky, 1988).
In order to avoid over-fitting, the number of se-
lected PLS factors was performed by using cross val-
idation on the n-1 blocks (90% of data), and tested
on the remaining block (10% of total data) the to cal-
culate the predicted sum of squares criteria (PRESS).
PRESS is obtained by
∑
n
i=1
Y
j
−
ˆ
Y
j
2
; where Y
j
is
the data left-over from the original dataset after sub-
tracting validation sample i, and
ˆ
Y
j
the model predic-
tion for the j sample, so that it is possible to derive
for each model the PRESS criteria statistical distribu-
tion and select the minimum number of PLS factors.
By performing The PLSR confidence intervals were
thereafter determined according to Denham (1997),
and the limit of quantification was assumed ten times
the regression standard error (SE). All statistical com-
puting analysis were performed using R (R-Project,
2008)
BIOSIGNALS 2009 - International Conference on Bio-inspired Systems and Signal Processing
330
3 RESULTS AND DISCUSSION
3.1 Qualitative Analysis
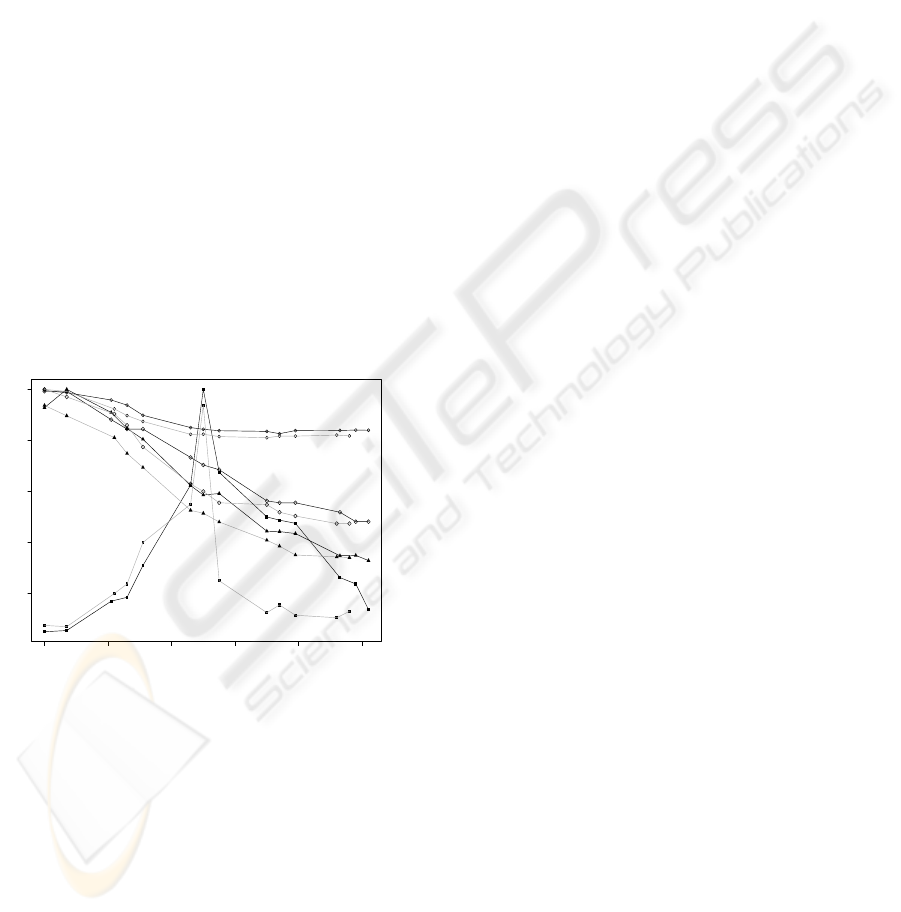
For each fermentation sample it were determined: i)
number of yeast cells; ii) Extract; iii) Sugar weight
percentage in solution; and iv) pH. This results are
shown on Figure 3. In the first 7h, after yeast addi-
tion, the lag phase occurs and a rapid absorption of
the oxygen contained in the wort occurs. Therefore,
a significant decrease in pH and absorption of free
amino nitrogen, indicating the adjustment of the yeast
to the nutrient medium. Followed by an exponential
growth phase with rapid decrease in medium density,
abundant consumption of wort sugars and consequent
abundant production of alcohol,marked fall in pH and
nitrogen absorption of the wort. After 50h yeast floc-
culation occurs, greatly decreasing the ethanol pro-
duction as the nitrogen source also begins to scare.
This phase continues until the end of the fermenta-
tion, whereby sugar consumption begins to decrease
until it stabilizes at the 3rdday of fermentation. At the
end of fermentation pH is about 3.7, the sugar weight
percentagefalls 50% to (from 13.4% to 6.5%) and dry
extract the value of 0.05g/ml.
0 20 40 60 80 100
0.2 0.4 0.6 0.8 1.0
Time (h)
Normalized Concentration
Figure 3: Normalized chemical data over the fermentation
time ( Biomass x 2x10
8
cells/ml of wort; N Extract x
0.1382 g/ml of wort, ◦ pH; and ♦ sugar weight percentage
in the wort x 13.5). Black lines represents Fermentation 1;
and grey lines represents Fermentation 2.
The construction of a three-dimension graph of
UV-VIS and VIS-SWNIR spectra (Figure 4) allows
to observe that the previous phases described on the
chemical results is discriminated in the spectra. We
observed that there is high similarity between the
VIS-NIR and UV-VIS surfaces in both fermentations,
which is an indication of good process reproducibil-
ity. In each graph of Figure 4 we flagged the spec-
tra with letters from “a” to “n” as being the different
sampling times for better qualitative spectra interpre-
tation.
The confrontation of Figure 4 information with
the data contained on Figure 3 makes possible observe
that: “a” corresponds to the fermentation start; from
“a” to “b” there is a stabilization in both absorbance
spectra indicating that lag phase is taking place; “b”
to “g” corresponds to the exponential growth of the
yeast, in this phase organic acids are produced and
buffering compounds (basic amino acids and primary
phosphates) are consumed, this phenomenon is ob-
served in Figure 4 by an increase of the spectra ab-
sorbance; “g” point corresponds to the maximum
number of yeast cells and to a peak in all 3D graphs;
from point “g” to “n” the number of yeast cells de-
crease, which leads to a decrease of number of reac-
tions, leading to a metabolic modification in the pro-
cess, this is perfectly identified in both 3D graphs of
Figure 4.
Although the different stages of beer process be-
ing well identified in both spectra regions, the UV-
VIS and the VIS-SWNIR regions are quite different
on its behavior. On the lag phase (points “a”-“b”) the
UV-VIS spectra have a slope in the absorbance, in UV
wavelengths the absorbance is more high than VIS re-
gion; while VIS-SWNIR spectra its all on its mini-
mum absorbance. Once started the exponential phase
(from point “b” to “g”) the absorbance increases in
different proportions until achieve a similar level in
all wavelengths; In the same phase the VIS-SWNIR
spectra suffer a large increase in all wavelengths un-
til its maximum spectra (point “g”) where the fer-
mentation reaches the flocculation point; The follow-
ing spectra (“h”) suffers a decrease in the absorbance
for both spectra regions (UV-VIS and VIS-SWNIR).
Then the spectra absorbanceincrease againuntil point
“i” reaching the absorbance peak, after this the ab-
sorbance stabilizes in the next four points (“j”, “k”,
“l” and “m”) for the entire region under study (UV-
VIS and VIS-SWNIR); The end of the fermentation
is identified in both spectra by a decrease in the last
point (“n”) absorbance. This analysis show that UV
region can be a very important region for the charac-
terization of the compounds that are changing along
the fermentation, once that is the region where the
absorbance have more difference between the wave-
lengths over the time.
3.2 Multivariate Calibrations
Beer wort is highly dispersive and scattering artifacts
are significant. The undesired scattering occurs be-
cause of the particles in wort and accumulation of
solids in the dip probe. Light scattering does not
IN-SITU, REAL-TIME BIOREACTOR MONITORING BY FIBER OPTICS SENSORS
331
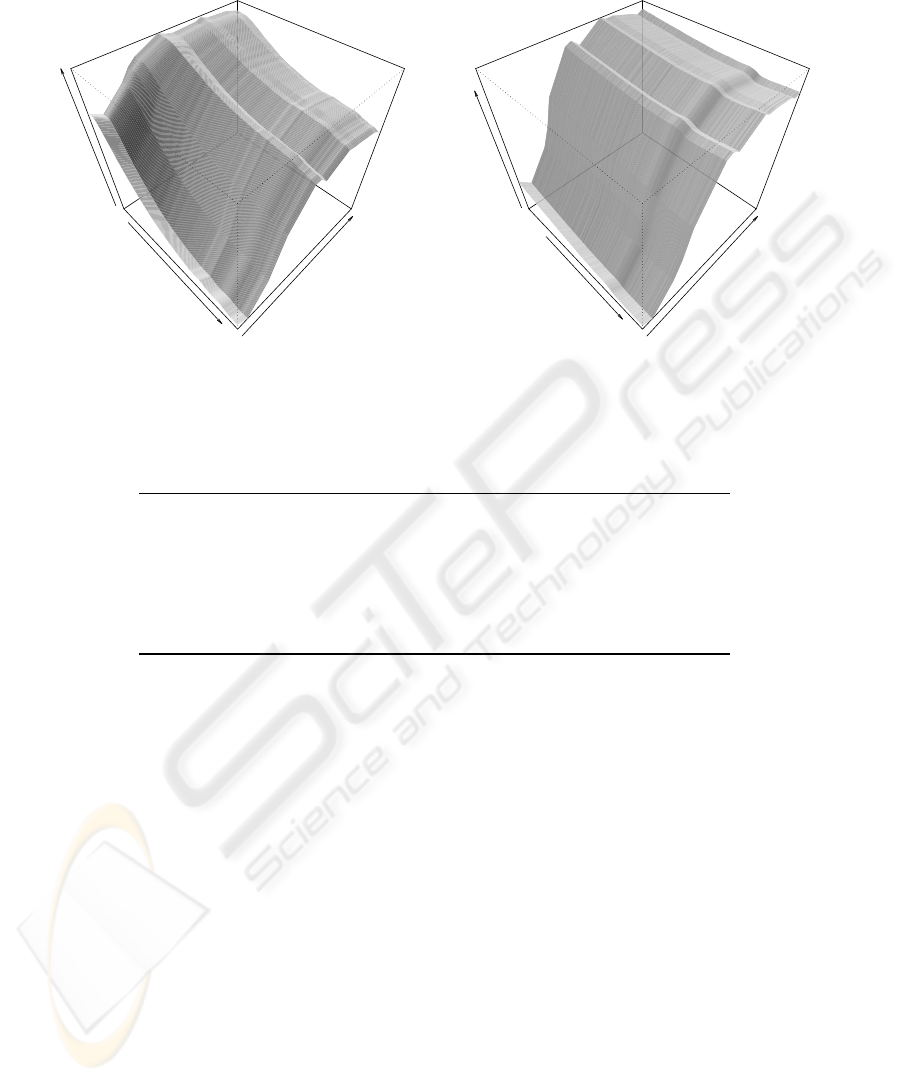
Wavenumber
Time
Absorbance
a
b
c
d
e
f
g
h
i
j
k
l
m
n
(a)
Wavenumber
Time
Absorbance
a
b
c
d
e
f
g
h
i
j
k
l
m
n
(b)
Figure 4: Spectra evolution during fermentation: (a) UV-VIS and (b) VIS-SWNIR; where: a - 0 hrs; b - 7 hrs; c - 21 hrs; d -
26 hrs; e - 31 hrs; f - 46 hrs; g - 50 hrs; h - 55 hrs; i - 70 hrs; j - 74 hrs; k - 79 hrs; l - 93 hrs; m - 98 hrs; and m 102 hrs.
Table 1: Partial least squares regression model estimates for both fermentations UV-VIS spectra.
PLS-1 Model Data Variance (%) PRESS R
2
Err
Number of yeast cells X-block 89.34 3.7478x10
16
0.9471 1.1782x10
7
(nPC=15) Y-block 98.47
Extract X-block 79.24 3.4708x10
−2
0.8632 1.3380x10
−2
(nPC=10) Y-block 92.31
pH X-block 72.58 3.2430 0.8539 0.1095
(nPC=10) Y-block 92.62
Sugars weight percentage X-block 79.52 235.4118 0.8565 0.9337
(nPC=10) Y-block 92.27
(a)
Limit of quantification = 10 x Err (10:1 Signal to noise ratio)
affect the the chemical information contained in the
spectra. Neverthenless, if not corrected, it influences
the interpretation of the SVD and microorganisms
classification. Scattering is mostly of multiplicative
matter (Gallager et al., 2005), and the robust mean
scattering correction (RMSC) was able to minimize
this effect. Direct comparison of the corrected spectra
(figure not shown) leads to the conclusion that scat-
tering is obtained in both light sources evenly spread
over all wavelengths. As the absorbance has an ex-
tremely high variation when compared to the scatter-
ing effect, it expected that scattering even if not cor-
rected totally, will not significantly influence most of
PLS regressions. Such observation gives a good indi-
cation for fiber optics sensors robustness, which may
work in very difficult conditionsof bioprocesses, such
as in this case with high particle densities and cellular
concentrations.
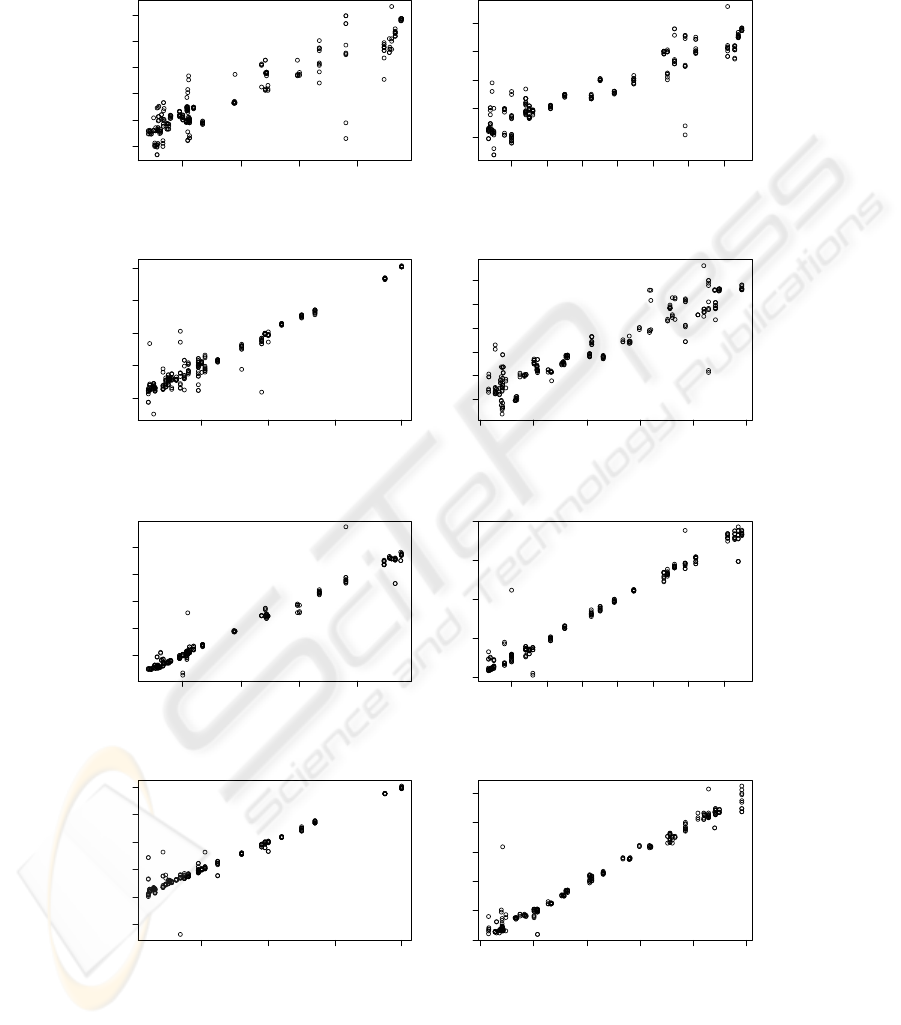
PLS regression results are presented in Tables 1
and 2 and calibrations are presented in Figure 5. Cal-
ibrations were obtained using the 2nd derivate which
allows the direct background and baseline correction.
A direct comparison of the R
2
allows to conclude that
VIS-NIR calibrations are better than the calibrations
in UV-VIS spectra; all VIS-NIR calibrations have R
2
≥ 0.95 and only need ≃ 58% of X-block variance
to explain 99% of Y-block variance; while all UV-
VIS calibrations have R
2
≤ 0.95 and need at least
79% of X-block variance to explain 92% of Y-block
variance. Furthermore, VIS-SWNIR have lower de-
tection limits for the studied parameters than with
the UV-VIS wavelengths, especially for dry extract,
pH and total sugars. Nevertheless, interesting detec-
tion limits are observed for all the studied parame-
ters: i) cell density: UV-VIS (1.1782x10
8
cells/ml)
and VIS-SWNIR (1.0259x10
8
cells/ml); ii) dry ex-
tract: UV-VIS (1.3380x10
−1
g/ml) and VIS-SWNIR
(4.8024x10
−2
g/ml); iii) pH: UV-VIS (1.095) and
VIS-SWNIR (0.416); and iv) total sugars UV-VIS
(9.337 % w/w) and VIS-SWNIR (3.565 % w/w).
Furthermore, VIS-SWNIR wavelengths allowed
to obtain robust calibrations with less numberof spec-
tral decompositions. In all UV-VIS PLS regressions
were obtained with 10 to 15 factors, where as, VIS-
BIOSIGNALS 2009 - International Conference on Bio-inspired Systems and Signal Processing
332
3.8 4.0 4.2 4.4
3.6 3.8 4.0 4.2 4.4 4.6
(a)
measured
predicted
7 8 9 10 11 12 13
6 8 10 12 14
(b)
measured
predicted
5.0e+07 1.0e+08 1.5e+08 2.0e+08
0.0e+00 1.0e+08 2.0e+08
(c)
measured
predicted
0.04 0.06 0.08 0.10 0.12 0.14
0.04 0.08 0.12
(d)
measured
predicted
3.8 4.0 4.2 4.4
3.8 4.0 4.2 4.4 4.6
(e)
measured
predicted
7 8 9 10 11 12 13
6 8 10 12 14
(f)
measured
predicted
5.0e+07 1.0e+08 1.5e+08 2.0e+08
−5.0e+07 5.0e+07 1.5e+08
(g)
measured
predicted
0.04 0.06 0.08 0.10 0.12 0.14
0.04 0.06 0.08 0.10 0.12 0.14
(h)
measured
predicted
Figure 5: PLS-R Calibrations for UV-VIS: (a) pH; (b) sugar weight percentage; (c) Biomass; (d) extract; and for VIS-SWNIR:
(e) pH; (f) sugar weight percentage; (g) Biomass; (h) extract.
IN-SITU, REAL-TIME BIOREACTOR MONITORING BY FIBER OPTICS SENSORS
333
360 380 400 420 440 460
−400 −200 0 200 400
(a)
Wavelenghts (nm)
Coefficients
360 380 400 420 440 460
−3000 −2000 −1000 0 1000 2000 3000
(b)
Wavelenghts (nm)
Coefficients
360 380 400 420 440 460
−2e+10 0e+00 2e+10 4e+10
(c)
Wavelenghts (nm)
Coefficients
360 380 400 420 440 460
−40 −20 0 20
(d)
Wavelenghts (nm)
Coefficients
600 700 800 900 1000
0.0 0.5 1.0 1.5 2.0 2.5
(e)
Wavelenghts (nm)
Coefficients
600 700 800 900 1000
0 5 10 15
(f)
Wavelenghts (nm)
Coefficients
600 700 800 900 1000
−3e+08 −2e+08 −1e+08 0e+00
(g)
Wavelenghts (nm)
Coefficients
600 700 800 900 1000
0.00 0.05 0.10 0.15 0.20
(h)
Wavelenghts (nm)
Coefficients
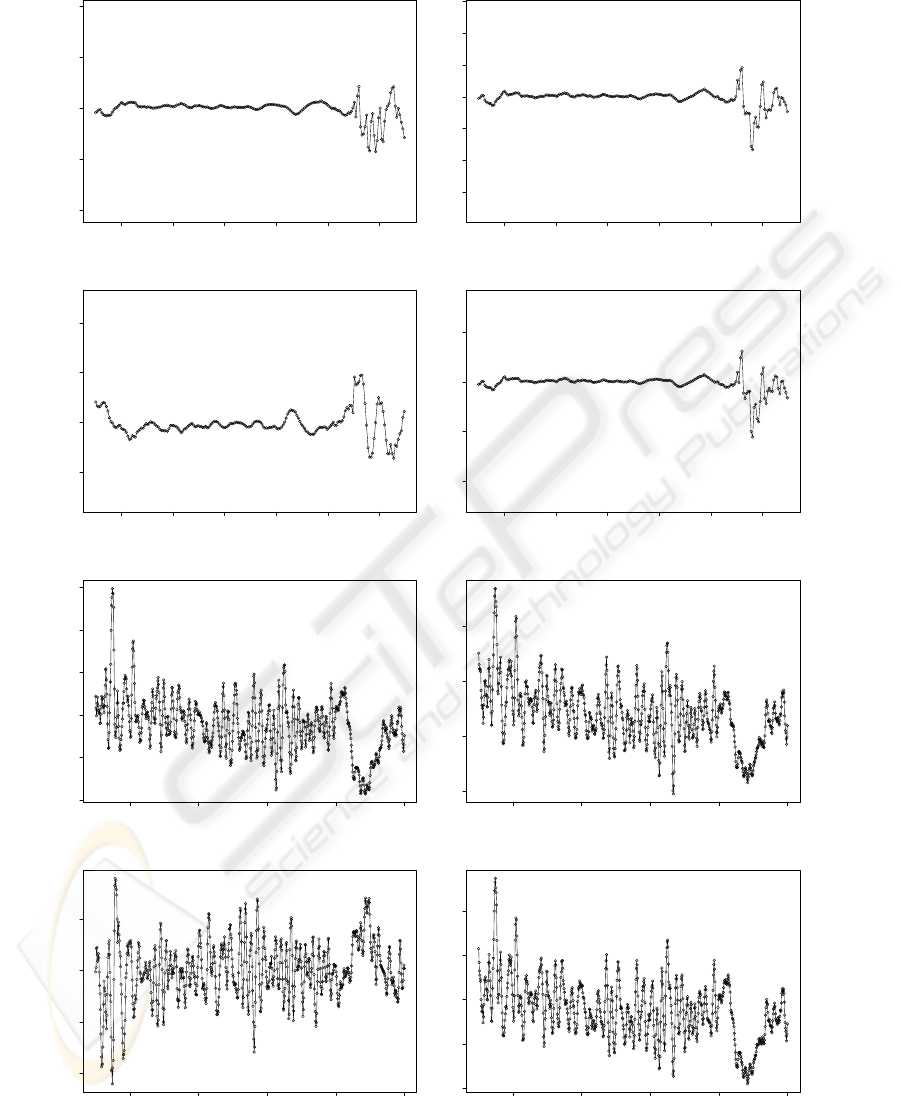
Figure 6: PLS-R Coefficients for UV-VIS: (a) pH; (b) Sugar weight percentage; (c) Number of yeast cells; (d) Extract; and
for VIS-SWNIR: (e) pH; (f) Weight sugar percentage; (g) Number of yeast cells; (h) Extract.
BIOSIGNALS 2009 - International Conference on Bio-inspired Systems and Signal Processing
334

Table 2: Partial least squares regression model estimates for both fermentations VIS-SWNIR spectra.
PLS-1 Model Data Variance (%) PRESS R
2
Err
Number of yeast cells X-block 58.63 2.8417x10
16
0.9599 1.0259x10
7
(nPC=8) Y-block 99.51
Extract X-block 58.46 6.2269x10
−3
0.9755 4.8024x10
−3
(nPC=8) Y-block 99.48
pH X-block 58.43 0.4675 0.9789 0.0416
(nPC=8) Y-block 99.63
Sugars weight percentage X-block 58.49 34.3200 0.9790 0.3565
(nPC=8) Y-block 99.61
(a)
Limit of quantification = 10 x Err (10:1 Signal to noise ratio)
SWNIR region were obtained with 8. Such discrep-
ancy is not yet fully explainable, being only possi-
ble to affirm so far that perhaps the UV-VIS region
may contain less information correlated to the stud-
ied parameters. This is not an indication that this re-
gion has less information than the VIS-SWNIR re-
gion, because absorbance in this region may be more
well correlated with other chemical and biochemical
compounds. Figure 6 presents the coefficients in the
1st spectral decomposition during PLSR. It is observ-
able that the UV-VIS coefficients present higher auto-
correlation than the VIS-SWNIR coefficients. Fur-
thermore, for all the studied parameters the UV-VIS
region presents the highest coefficients in the region
of 420 to 480 nm. Interpretation in this region is how-
ever not straight forward, because coefficients present
high fluctuations, not being possible to interpret a
well defined peak. In the VIS-SWNIR region most of
the coefficients are high for biomass, increasing from
600nm to 1000nm and showing a peak at 900nm. The
contrary is observed for the rest of the studied pa-
rameters, where all the coefficients decrease with the
wavelength, with a lower peak at 900nm. Therefore,
one can conclude that higher absorbancies are gener-
ally correlated with higher biomass, with special rel-
evance in the SWNIR region. High absorbances in
this region is correlated with lower sugar, pH and dry
extract concentrations.
3.3 Conclusions
This exploratory research shows the feasibility of UV-
VIS and VIS-SWNIR spectroscopy for monitoring
bioprocesses. Nevertheless, both experimental and
signal processing techniques can be improved to take
advantage of the high-output information containedin
the UV-VIS-SWNIR spectra.
Improvements on the experimental methodology can
improve the quality of bioreactor monitoring in the
studied region of the spectra. For example, a better
location inside the bioreactor can be found to place
the probe, or the use of an attenuated total reflec-
tion probes can improve the signal quality in high-
density wort or high number of yeast cells. Further-
more, the measurementof moredetailed chemical and
biochemical composition of the wort during fermen-
tation, may help in the future the development of pre-
cision fermentation monitoring and control systems.
The data pre-treatment successfully remove the small
noise and scattering artifacts present in the spectra;
being possible to achieve high-quality and resolution
in the final spectra before signal treatment. Improve-
ments also should be performed in order to better un-
derstand the relationship between the chemical com-
position and the information contained in the spectra.
Methods such as the combination of the two spec-
tral regions using with n-way and multiblock PLS-R
(e.g. UV-VIS + VIS-SWNIR spectra) as well as using
wavelets or Fourier transformate for compressing and
modelling the spectra may provide better interpreta-
tion of spectra variance during bioprocesses.
In the near future, these improvements on both
experimental and data treatment may turn UV-
VIS-SWNIR a feasible technique for high-output
metabolomic studies and monitoring of Bioprocesses.
ACKNOWLEDGEMENTS
Part of this work was supported by the project Open-
MicroBio (PTDC/BIO/69310/2006) - ’A Framework
for Computational Simulation of Cellular Commu-
nities during BioProcess Engineering’; and partially
supported by CBMA, IBB/CEB and ISR/IST pluri-
anual funds through the POS-Conhecimento Program
that includes FEDER funds.
REFERENCES
Alison, A., John, C., Seetharaman, V., Liliana, M., and
Pankaj, M. (2000). At-line monitoring of a submerged
filamentous bacterial cultivation using near-infrared
spectroscopy. volume 27. Enzyme and microbial tech-
nology.
IN-SITU, REAL-TIME BIOREACTOR MONITORING BY FIBER OPTICS SENSORS
335

Avantes (2005). Avaspec-2048-4-dt/-rm.
http://www.avantes.com.
Avantes (2007). Avasoft 7.0. http://www.avantes.com.
Bruice, P. Y. (2006). Organic Chemestry: Study Guide and
Solutions Manual. Prentice Hall, 5 edition.
Cooper, J., Wise, K., Welch, W., Sumner, M., Wilt, B., and
Bledsoe, R. (1997). Comparison of near-ir, raman, and
mid-ir spectroscopies for the determination of btex in
petroleum fuels. volume 51. Applied Spectroscopy.
Denham, M. (1995). Implementing partial least squares.
5:191–202.
Denham, M. (1997). Prediction intervals in partial least
squares. 11:39–52.
Faust, C. (1992). Near-infrared spectroscopy for bioprocess
monitoring and control. Royal Society of Chemistry.
Gallager, N. B., Blake, T., and Gassman, P. (2005). Ap-
plication of extended inverse scattering correction to
mid-infrared reflectance of soil. 19:271–281.
Geladi, P. and Kowalsky, B. (1986). Partial least-squares
regression a tutorial. volume 185. Analytica Chimica
Acta.
Geladi, P. and Kowalsky, B. (1988). Partial least squares
regression: a tuturial. 185:1–17.
Jong, S. (2003). Simpls: an alternative approach to partial
least squares regression. volume 18. Chemometrics
and Intelligent Laboratory Systems.
Majara, M., Mochaba, F. M., O’connor-cox, E. S. C., Ax-
cell, B. C., and Alexander, A. (1998). Yeast pro-
tein measurement using near infrared reflectance spec-
troscopy. volume 104, 143-146. Journal of the Insti-
tute of Brewing.
Martens, H. and Naes, T. (1989). Multivariate calibration.
Wiley.
Martens, H., Nielsen, J. P., and Engelsen, S. B. (2003).
Light scattering and light absorbance separated by ex-
tended multiplicative signal correction. application to
near-infrared transmission analysis of powder mix-
tures. In Analytical Chemistry 75(9): 394-404. Amer-
ican Chemical Society.
Martens, H. and Stark, E. (1991). Extended multiplicative
signal correction and spectral interference subtraction:
new preprocessing methods for near infrared spec-
troscopy. In Journal of Pharmaceutical and Biomedi-
cal Analysis 9: 625-635. American Chemical Society.
Metrohm (2008). Metrohm 691 ph meter.
http://www.metrohm.com/.
Ocean-Optics (2008). Ocean optics catalog.
http://www.oceanoptics.com.
Ozaki, Y., Sasic, S., and Jiang, J. (2001). How can we
unravel complicated near infrared spectra? - recent
progress in spectral analysis methods for resolution
enhancement and band assignments in the near in-
frared region. Journal of Infrared Spectroscopy, 9:63–
95.
R-Project (2008). R: A programming environment for data
analysis and graphics. URL: http://www.r-project.org.
Rhiel, M., Cohen, M., Murhammer, D., and Arnold, M.
(2002). Nondestructive near-infrared spectroscopic
measurement of multiple analytes in undiluted sam-
ples of serum-based cell culture media. volume 77.
Biotechnology and Bioengineering.
Schemidt-haensch (2008). Ar12 schmidt+haensch
abbe refractometer. http://www.schmidt-
haensch.com/products.html?L=1.
Schugerl, K. (2001). Progress in monitoring, modeling and
control of bioprocesses during the last 20 years. vol-
ume 85, 149-173. Journal of Biotechnology.
Sigma (2008). Sigma 4k15 centrifuge. http://www.sigma-
zentrifugen.de.
Stavitzky, A. and Golay, M. J. E. (1964). Smoothing
and differentiation of data by simplified least squares
procuderes. Analytical Chemistry 36(8): 1627-1639.
Stuart, B. (1997). Biological applications of infrared spec-
troscopy. University of Greenwich, UK. John Wiley
& Sons, Ltd.
Wold, S., Martens, H., and Wold, H. (1983). The multivari-
ate calibration-problem in chemistry solved by the pls
method. volume 973. Lecture Notes in Mathematics.
Workman, J. (1993). A review of process near infrared spec-
troscopy: 1980-1994. pages 221–225. Journal Near
Infrared Spectroscopy.
Yano, T., Aimi, T., Nakano, Y., and Tamai, P. (1997). Pre-
diction of the concentrations of ethanol and acetic acid
in the culture broth of a rice vinegar fermentation us-
ing near-infrared spectroscopy. volume 84. Journal of
Fermentation and Bioengineering.
Yeung, K., Hoare, M., Thornhill, N., Williams, T., and
Vaghjiani, J. (1999). Near-infrared spectroscopy
for bioprocess monitoring and control. volume 63.
Biotechnology and Bioengineering.
BIOSIGNALS 2009 - International Conference on Bio-inspired Systems and Signal Processing
336
