
AUTOFLUORESCENCE SPECTROSCOPY OF A HUMAN
GASTROINTESTINAL CARCINOMA CELL LINE
Design of Optical Sensors for the Detection of Early Stage Cancer
D. S. Ferreira
1
, M. Henriques
2
, R. Oliveira
2
, J. H. Correia
1
and G. Minas
1
1
Algoritmi Centre, Universidade do Minho, Campus Azurém, 4800-058 Guimarães, Portugal
2
Department of Biological Engineering, Universidade do Minho, Campus Gualtar, 4710-057 Braga, Portugal
Keywords: Autofluorescence, Fluorophores, Cancer, Optical sensors.
Abstract: Human tissues show autofluorescence (AF) emission spectra when excited by ultraviolet or short-
wavelength visible light. The intensity and shape of these spectra are dependent on the tissues pathological
state and, therefore, its measurement gives information about the degree of malignant transformations that
could lead to cancer. In this article, it is characterized the AF spectra of one human gastrointestinal
carcinoma cell line (CACO-2). The obtained results showed significant AF signal for the presence of amino
acids. The spectral information obtained can be used for the design of fluorescence optical sensors that will
be incorporated on an endoscopic capsule, for measuring the AF emission spectra of normal and cancer
cells. This integrated optical system will innovate on the diagnosis of early stage cancer.
1 INTRODUCTION
Cancer of the gastrointestinal (GI) tract is the second
most common cause of cancer death in the United
States and industrialized countries. Patients with a
family history of colon cancer, familial polyposis,
long-standing inflammatory bowel disease, and
Barrett’s esophagus are at high risk for developing
this kind of cancer. The new innovations in
endoscopy, including capsule endoscopy, made the
GI tract one of the most frequently and completely
examined system. Despite the greater access, early
detection of neoplasia is difficult during routine
endoscopy due to the absence of typical
morphological structures and, as a result, is still
limited to blind random biopsies in patients at high
risk of developing cancer, in a both inefficient and
costly process. Therefore, more sensitive endoscopic
screening tools, which enable differentiation
between premalignant and benign lesions during
endoscopy, are of scientific and clinical interest
(Prosst, 2002; Banerjee, 2004; Georgakoudi, 2006).
When human tissues are illuminated with
ultraviolet or short wavelength visible light, they
emit fluorescence light of a longer wavelength
(Figure 1). This tissue ‘autofluorescence’ (AF) arises
from endogenous molecules within the tissue, called
fluorophores (Haringsma, 1999; DaCosta, 2002).
The GI tract tissues are composed by a complex
combination of several fluorophores that occur in
different concentrations and at different depths. The
mucosa, submucosa and muscularis propria have
distinct fluorophore compositions, so that even
though each fluorophore has a distinct fluorescence
spectrum, the total fluorescence measured comprises
contributions from the fluorophores in the various
layers. Hence, excitation and fluorescence emission
wavelength bands are often broad, relatively
featureless and overlap with one another, so that
identifying individual fluorophores in a given tissue
spectrum is difficult (Haringsma, 1999;
DaCosta, 2002).
Some research groups have explicitly studied the
AF emission of established cell lines (DaCosta,
2005). These studies, by the use of single living
cells, allow the isolation of the contribution of
intracellular fluorescence in the tissular emission,
through the elimination of the extracellular matrix
emission and the influence of light absorption and
scattering. Therefore, such studies provide a better
understanding of the biochemical changes associated
with malignant transformation. Also, cellular
61
Ferreira D., Henriques M., Oliveira R., Correia J. and Minas G. (2009).
AUTOFLUORESCENCE SPECTROSCOPY OF A HUMAN GASTROINTESTINAL CARCINOMA CELL LINE - Design of Optical Sensors for the
Detection of Early Stage Cancer.
In Proceedings of the International Conference on Biomedical Electronics and Devices, pages 61-66
DOI: 10.5220/0001539000610066
Copyright
c
SciTePress
reference spectra are needed for the modeling of the
tissue fluorescence, in view of spectral
quantification which should be very useful for
diagnostic purposes. To quantify the relatively weak
AF created by one single fluorophore, sophisticated
algorithms have been developed (Stepp, 1998;
Prosst, 2002; Villette, 2006).
Mucosa
Submucosa
Muscularis propria
Fluorophore
Chromophore
Specular
Re f lectance
Incident
Light
Diffuse
Re flectan c e
Scattering
Absorption
Fluorescence
Emis sion
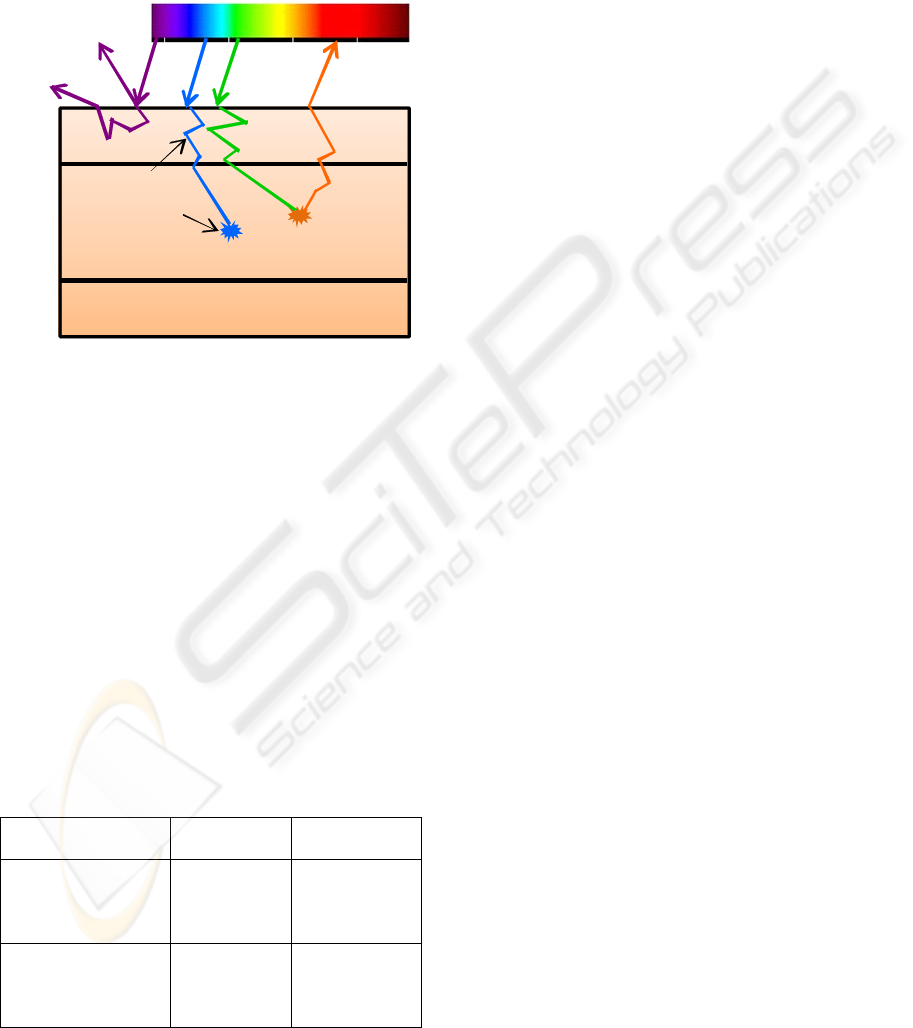
Figure 1: Light–tissue interactions include reflectance,
scattering, absorption and fluorescence. Tissue
fluorescence is originated by the absorption of light by
fluorophores.
Among the significant fluorophores in the GI
tract are: tryptophan and tyrosine (aromatic amino
acids present in cells); NADH and NADPH (cellular
metabolism related coenzymes), which assist
oxidation and reduction processes and are found
mainly in mitochondria; and flavins and flavin
nucleotides, which are mostly bound to enzymes and
concentrated in the mitochondria (DaCosta, 2005).
Each of these fluorophores has its characteristic
excitation and emission spectrum (Table 1). Thus,
different excitation wavelengths result in the
activation of different fluorophores.
Table 1: Excitation and emission maxima of some
endogenous fluorophores (DaCosta, 2002).
Endogenous
fluorophores
Excitation
maxima (nm)
Emission
maxima (nm)
Amino acids
Tryptophan 280 350
Tyrosine 275 300
Phenylalanine 260 280
Metabolic cofactors
FAD, Flavins 450 515
NADH 350 450
NADPH 336 464
Over the last decade a number of optical
techniques have been developed to try to detect early
GI neoplastic lesions. These optically-based
methods have the potential to detect the very earliest
mucosal changes at the micro structural and
molecular levels (Haringsma, 1999). Light induced
autofluorescence spectroscopy, for example, is based
on the analysis of the fluorescence emission of
endogenous fluorophores, providing information that
can be used to characterize changes that take place
as tissues become diseased. It involves delivery of
the excitation light via placement of a fiber-optic
probe in direct contact with tissue. The fluorescence
is collected by the same probe and delivered to the
input of a spectrometer. Achieving discrimination
between diseased and healthy tissue relies upon the
identification of differences either in emission
intensity, spectral distribution, fluorescence lifetime,
or crucially, a combination of these (Stringer, 2004;
Georgakoudi, 2006).
The capsule endoscopy is a relatively recent
method for GI tract evaluation that uses an
endoscopic capsule (EC). Since, presently, some of
the most promising methods for detecting cancer at
an early stage are based on tissue’s fluorescence, the
EC can play an important role in this kind of
diagnosis, once it can be equipped with miniaturized
fluorescence CMOS optical sensors. These sensors
should be incorporated in the EC for measuring the
AF emission spectra of normal and cancer cells, and
should have the higher quantum efficiency in a
defined spectral range (Delvaux, 2006; Dias, 2007).
This integrated system will certainly innovate in the
diagnosis of GI cancer.
It is important to notice that
current endoscopic capsules do not have added
diagnostic functions, such as spectroscopic analysis,
which are commonly available in conventional
endoscopes. Therefore these developments will be a
major step towards creating a new platform for
diagnosis.
In this article, it is characterized the AF spectra
of one human GI carcinoma cell line (CACO-2). The
results obtained showed significant AF signal for the
presence of amino acids, namely tryptophan. The
resulting spectral information of the CACO-2 cell
line is a good initial approach for the design of
fluorescence optical sensors, to be incorporated on
an EC. This study was performed using
spectrofluorimetry on cell monolayers, with several
excitation wavelengths, resulting in several
fluorophores emission spectra. Some of the reported
results appeared promising, being in accordance
with previously published results.
BIODEVICES 2009 - International Conference on Biomedical Electronics and Devices
62

2 EXPERIMENTAL
2.1 Human Carcinoma Cell Line
Culture
The experimental studies were performed using one
human GI carcinoma cell line - CACO-2 - that was
purchased from the European Collection of Cell
Cultures (ECACC). These cells were grown in 88%
Minimum Essential Medium Eagle’s (EMEM),
supplemented with 10% Fetal Bovine Serum (FBS),
1% Non Essential Amino Acids (NEAA), and 1%
Glutamine (2mM) in a humidified atmosphere, at
37ºC and 5% CO
2
. Cells were grown in 25 cm
2
flasks to 70 – 80% confluence and their morphology
was routinely inspected.
2.2 Preparation of CACO-2 Cell Line
for Spectrofluorimetry
The flasks of cultured cells were examined under the
inverted microscope to observe cell confluency.
After that, the old medium was removed and
discarded and cells were washed with warm (37ºC)
phosphate-buffered solution (PBS). A small volume
of trypsin (~1 mL) solution was added to the flasks
and the flasks were placed back in an incubator at
37ºC. Five to ten minutes after, cells were examined
under the inverted microscope to confirm that most
of the cells had rounded up and were detaching from
the flask surface. Finally, it was added 4 mL of fresh
growth medium to the cell suspensions. The number
of viable and dead cells/mL was determined using a
Neubauer haemocytometer and the trypan blue dye
exclusion method.
A total of eight experiments were performed for
the CACO-2 cell line. To support the cells for these
experiments it was used glass cover slips placed
inside 6-well plates; after that the final cell
suspensions were divided and placed within these 6-
well plates. The cells used were grown as
monolayers over the cover slips. After 24, 48 or 72
hours (depending on the experiment), cover slips
were collected from the 6-well plates and packed in
Petri dishes, with 3 mL of PBS solution, for the
experiments. Spectral analysis was then performed
within less than half an hour after cells were placed
in Petri dishes.
2.3 Spectrofluorimetry of CACO-2 Cell
Line
Fluorescence spectra were performed on human
carcinoma cell monolayers. The samples were
measured using a SPEX
®
FluoroLog
®
- a high
sensitivity spectrofluorometer with a SPEX1680
(0,22m) Double Spectrometer. The excitation light
was provided by a Xenon lamp of 450W with a DC
450RAM power supply, from EUROSEP
Instruments. The equipment was connected to a
computer to control and collect the data. The slit
widths of both spectrometers were adjusted in order
to provide a good spectral resolution in the
excitation and emission path.
2.4 Fluorescence Spectra of CACO-2
Cell Line
Emission spectra were recorded from 270–690 nm,
for an excitation wavelength ranging from 260 to
350 nm. These excitation wavelengths were chosen
in order to allow a comparison with data obtained
from literature. Reference spectra were obtained
with pure PBS solutions. All the spectra were
normalized subtracting the reference spectra from
the fluorescence spectra. The fluorescence emission
spectra were also corrected for the spectral response
of the spectrofluorometer. The recordings were
performed for several cell concentrations, depending
on the experiment (24, 48 or 72 hours). These cells
were maintained in PBS during the measurement,
which could in some way put in risk cell viability.
All measurements were performed under the same
experimental conditions.
3 RESULTS AND DISCUSSION
The analysis of the two epithelial cell lines AF was
performed using spectrofluorimetry on cell
monolayers. The measurements were performed on
cell monolayers to use epithelial cells as close as
possible to their in vivo tissular physiological
conditions, as cells grown as monolayers undergo
less stress than cells in suspension. This was
confirmed on previous studies on normal cells from
primary cultures, which easily grow as adherent
monolayers looking like an epithelium structure
while showing a poor viability in suspension.
Furthermore, cell monolayers can be considered as
an optically thin medium, while the acquired spectra
from cell suspensions are strongly affected by
AUTOFLUORESCENCE SPECTROSCOPY OF A HUMAN GASTROINTESTINAL CARCINOMA CELL LINE -
Design of Optical Sensors for the Detection of Early Stage Cancer
63
scattering, inducing spectral distortion (Villette,
2006).
The experiments started measuring the AF signal
of the CACO-2 cell line, with 24, 48 and 72 hours of
growth, placed inside a 6-well plate and slightly
immersed in PBS. The fluorescence measurements
were made for different excitation wavelengths (λ
ex
)
- 260, 270, 280, 335, and 350 nm - and the emission
was collected in the range 270-690 nm. The average
number of viable and dead cells was determined in
each experiment (Table 2).
Table 2: Number of viable and dead CACO-2 cells, after
24, 48 and 72 hours in culture.
Time in culture
(hours)
Live Dead
Number of
cells/mL
24 16,5x10
4
1,25x10
4
48 22,0x10
4
1,40x10
4
72 63,5x10
4
2,50x10
4
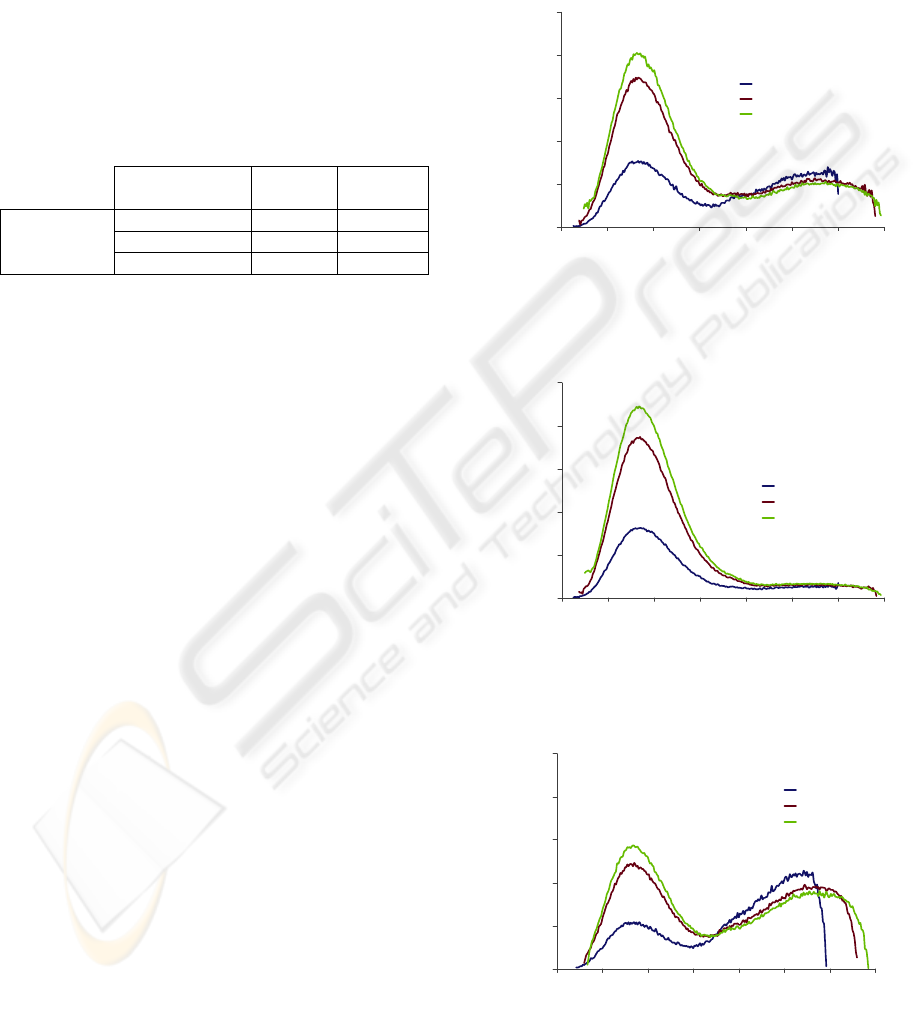
In all experiments, for λ
ex
of 260, 275 and
280 nm the emission spectra are very similar in
shape (Figures 2, 3 and 4) - all of them exhibit a
broad emission band from 310 to 370 nm, with a
peak around 340 nm, which is primarily caused by
amino acids, namely tryptophan.
However, the AF intensity diverges among all
the acquired spectra, being related with culture time.
The maximum AF intensity is achieved for a 48
hours cell culture, decreasing then as time elapses.
This can be explained by the number of viable and
dead cells. From 24 to 48 hours there is a
considerable increase in the number of viable cells,
which is translated by AF signal intensification.
From 48 to 72 hours, despite the increase in the
number of viable cells, there is a reduction in AF
signal intensity. This intensity drop (for the
minimum value) can be justified not only by the
raise in the number of dead cells, but also by an
increase in cell fragility, as cells are in culture for a
longer time, supplied by the same growth medium
(it’s important to notice that the culture medium was
not discarded and replaced by fresh growth medium
in the period of 72 hours).
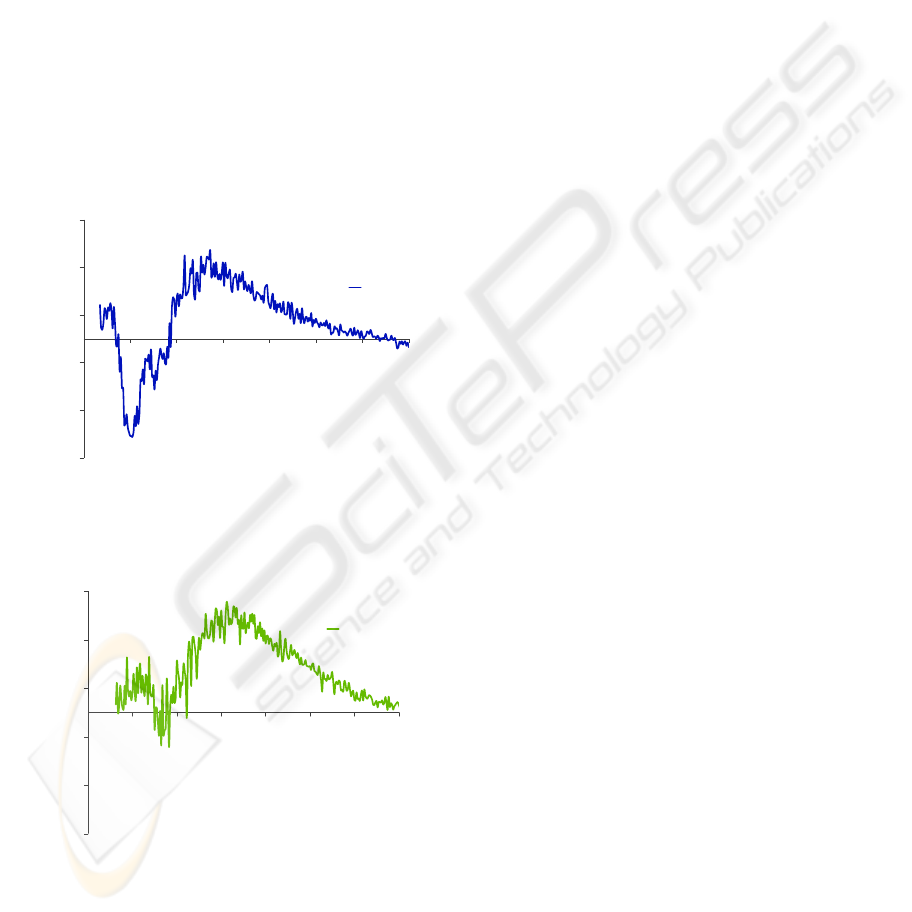
For other spectra acquired using λ
ex
of 350 and
335 nm, for the detection of NADH and NADPH,
respectively, the resulting fluorescence intensity was
approximately zero, when compared to the amino
acids AF intensity (Figures 5 and 6). This may be
justified by the fact that the AF emission from these
fluorophores, although existing, is very weak and
doesn’t superimpose over the PBS signal (reference
signal). Probably these molecules are not present in
significant amounts to contribute to a high quality
and strong signal. It may also be possible that some
other molecules partly affect the measurements by
absorbing the fluorescence or by emitting
fluorescence in the same bandwidth. These results
were very similar for all the experiments performed
(24, 48 and 72 hours growth).
0.00E+00
2.00E+10
4.00E+10
6.00E+10
8.00E+10
1.00E+11
270 310 350 390 430 470 510 550
Emissionwavelength(nm)
Autofluorescenceintensity(a.u.)
260nm
275nm
280nm
Figure 2: Autofluorescence emission spectra of a CACO-2
cell line, with 24 hours growth, obtained for different
excitation wavelengths: 260, 275 and 280 nm.
0.00E+00
5.00E+10
1.00E+11
1.50E+11
2.00E+11
2.50E+11
270 310 350 390 430 470 510 550
Emission wavelength(nm)
Autofluorescenceintensity(a.u.)
260nm
275nm
280nm
Figure 3: Autofluorescence emission spectra of a CACO-2
cell line, with 48 hours growth, obtained for different
excitation wavelengths: 260, 275 and 280 nm.
0.00E+00
1.00E+10
2.00E+10
3.00E+10
4.00E+10
5.00E+10
270 310 350 390 430 470 510 550
Emissionwavelength(nm)
Autofluorescenceintensity(a.u.)
260nm
275nm
280nm
Figure 4: Autofluorescence emission spectra of a CACO-2
cell line, with 72 hours growth, obtained for different
excitation wavelengths: 260, 275 and 280 nm.
BIODEVICES 2009 - International Conference on Biomedical Electronics and Devices
64
Recent studies have investigated the spectra of
human intestinal mucosa using a spectrofluorometer.
The measurements were performed using short
wavelengths for excitation, and revealed utility in
detecting neoplasia. The AF intensity increased with
neoplasia and had the spectral line shape of
tryptophan, indicating that AF emission from
tryptophan might represent a viable approach to the
detection of malignancy within colonic tissue
(Banerjee, 2000, 2002). A different study had
confirmed that the amount of amino acid related
fluorescence (emission between 300 and 380 nm) is
greater in adenomatous polyps than in the normal
tissues (DaCosta, 2003). Therefore, it can be said
that the results obtained, namely for amino acids AF
emission, are a good initial approach for the design
of optical sensors for the detection of GI early stage
cancer.
‐2.50E+09
‐1.50E+09
‐5.00E+08
5.00E+08
1.50E+09
2.50E+09
360 400 440 480 520 560 600 640
Emissionwavelength(nm)
Autofluorescenceintensity(a.u.)
350nm
Figure 5: Autofluorescence emission spectra of a CACO-2
cell line, with 48 hours growth, obtained for an excitation
wavelength of 350 nm.
‐2.50E+09
‐1.50E+09
‐5.00E+08
5.00E+08
1.50E+09
2.50E+09
345 385 425 465 505 545 585 625
Emission wavelength(nm)
Autofluorescenceintensity(a.u.)
335nm
Figure 6: Autofluorescence emission spectra of a CACO-2
cell line, with 48 hours growth, obtained for an excitation
wavelength of 335 nm.
4 CONCLUSIONS
There is a great interest in developing
autofluorescence-based spectroscopic systems for
the detection of early stage cancers. Understanding
the autofluorescent tissue components and how these
components change in concentration and distribution
with disease is essential in terms of optimizing
diagnostic techniques. Several endogenous
fluorophores have been identified and alterations in
concentrations of these are suggested for
discrimination of normal and malignant tissues.
In this article, it is characterized the AF spectra
of one human GI carcinoma cell line (CACO-2),
using several different excitation wavelengths,
which targeted different molecular species. The
obtained results showed significant AF signal for the
presence of amino acids, namely tryptophan. The
resulting spectral information of the CACO-2 cell
line is consistent with previously published results of
malignant colonic tissues, and is a good initial
approach for the design of fluorescence CMOS
optical sensors, to be incorporated on an EC, for the
differentiation of normal and malignant tissues. It is
important to notice, however, that when comparing
fluorescence spectra of cell monolayers with those
from in vivo or ex vivo tissues is has to be considered
the possible changes due to the physicochemical
microenvironment.
REFERENCES
Banerjee, B., Agarwal, S., Miedema, B., Perez R.,
Chandrasekhar, H. (2000). Use of a shorter
wavelength autofluorescent band to separate
adenomatous from hyperplastic polyps of the colon.
Gastrointestinal Endoscopy, 51, AB149.
Banerjee, B., Chandrasekhar, H. (2002). Use of a single
autofluorescence emission ratio for the detection of
colonic neoplasia. Gastrointestinal Endoscopy, 55,
AB129.
Banerjee, B., Henderson, J., Chaney, T., Davidson, N.
(2004). Detection of Murine Intestinal Adenomas
Using Targeted Molecular Autofluorescence.
Digestive Diseases and Sciences, 49, 54-59.
DaCosta, R. S., Wilson, B. C., Marcon, N. E. (2002). New
optical technologies for earlier endoscopic diagnosis
of premalignant gastrointestinal lesions. Journal of
Gastroenterology and Hepatology, 17, S85-S104.
DaCosta, R. S., Andersson, H., Wilson, B. C. (2003).
Molecular Fluorescence Excitation–Emission Matrices
Relevant to Tissue Spectroscopy. Photochemistry and
Photobiology, 78, 384-392.
DaCosta, R. S., Andersson, H., Cirocco, M., Marcon, N.
E., Wilson, B. C. (2005). Autofluorescence
AUTOFLUORESCENCE SPECTROSCOPY OF A HUMAN GASTROINTESTINAL CARCINOMA CELL LINE -
Design of Optical Sensors for the Detection of Early Stage Cancer
65

characterization of isolated whole crypts and primary
cultured human epithelial cells from normal,
hyperplastic, and adenomatous colonic mucosa.
Journal of Clinical Pathology, 58, 766-774.
Delvaux, M., Gay, G. (2006). Capsule endoscopy in 2005:
facts and perspectives. Best Practice & Research
Clinical Gastroenterology, 20, 23-39.
Dias, R. A., Correia, J. H., Minas, G. (2007). CMOS
Optical Sensors for being incorporated in Endoscopic
Capsule for Cancer Cells Detection. Proceedings of
ISIE 2007, 2747-2751.
Georgakoudi, I. (2006). The color of cancer. Journal of
Luminescence, 119, 75-83.
Haringsma, J., Tytgat, G. (1999). Fluorescence and
Autofluorescence. Baillière’s Clinical
Gastroenterology, 13, 1-10.
Prosst, R. L., Gahlen, J. (2002). Fluorescence diagnosis of
colorectal neoplasms: a review of clinical applications.
International Journal of Colorectal Disease, 17, 1-10.
Stepp, H., Sroka, R., Baumgartner, R. (1998).
Fluorescence endoscopy of gastrointestinal diseases:
basic principles, techniques, and clinical experience.
Endoscopy, 30, 379-386.
Stringer, M., Moghissi, K. (2004). Photodiagnosis and
fluorescence imaging in clinical practice.
Photodiagnosis and Photodynamic Therapy, 1, 9-12.
Villette, S., Pigaglio-Deshayes, S., Vever-Bizet, C.,
Validire, P., Bourg-Heckly, G. (2006). Ultraviolet-
induced autofluorescence characterization of normal
and tumoral esophageal epithelium cells with
quantitation of NAD(P)H. Photochemical and
Photobiological Sciences, 5, 483-492.
BIODEVICES 2009 - International Conference on Biomedical Electronics and Devices
66
