
LOW-COST ADAPTIVE METHOD FOR REAL-TIME ECG
BASELINE WANDER REMOVAL WITH REDUCED P AND T WAVE
DISTORTION
Rub´en Fraile and Juan Ignacio Godino-Llorente
Department of Circuits & Systems Engineering, Universidad Polit´ecnica de Madrid
Carretera de Valencia Km 7, 28031 Madrid, Spain
Keywords:
Electrocardiography, Adaptive Systems, Noise, Filtering.
Abstract:
An adaptive algorithm for the removal of baseline wander in ECG is presented. The scheme is based on
a single-tap LMS filter that estimates the baseline signal. The baseline is further processed by a moving
average filter. This way, reduced distortion of P-Q and S-T segments is achieved with a low computational
cost. Moreover, the proposed system has a short impulse response that makes it appropriate for real-time
applications.
1 INTRODUCTION
The performance of signal processing tasks on elec-
trocardiograms (ECG’s) is greatly affected by the
presence of noise artefacts. Among these artefacts,
baseline wander is a component of measured ECG’s
typically due to patient motion whose frequencycom-
ponents are usually considered to be below 0.1 Hz
(S¨ornmo, 1991). However, its energy may occasion-
ally span over a wider range of frequencies, thus
distorting the lowest frequency components of the
P-QRS-T complex, that is, P-Q and S-T segments
(Barati and Ayatollahi, 2006), which are useful for the
diagnosis of certain pathologies. Classical high-pass
filtering of the ECG for the removal of baseline wan-
der has the drawback of requiring filters with very nar-
row transition bands, therefore resulting in FIR filters
having long responses (S¨ornmo, 1991). For this rea-
sons alternative approaches have been proposed in lit-
erature up to now. As referred next, these approaches
can be roughly classified in two groups: adaptive
schemes on the one hand and methods based on ECG
signal decomposition on the other.
Adaptive schemes were firstly proposed in
(Thakor and Zhu, 1991), where a single-tap adaptive
filter based on the least mean squares (LMS) rule is
described. This filter behaves as a simple low-pass fil-
ter and introduces significant P-QRS-T complex dis-
tortion due to the width of its transition band. An im-
provement for this system which consists in an addi-
tional stage that estimates the P-QRS-T complex is
described in (Laguna et al., 1992). This procedure in-
tends to avoid the above-mentioned distortion at the
risk of masking beat-to-beat variations of the P-QRS-
T complex. A different approach consisting of a fil-
ter bank from which one output is adaptively selected
was introduced in (S¨ornmo, 1991). This scheme in-
tends to avoid distortion and does not blur beat-to-
beat variations, but it has a significantly higher com-
putational cost.
More recently, other algorithms have been pub-
lished that are based on different ECG signal de-
compositions, namely wavelet (Zhang, 2005), em-
pirical mode decomposition (Weng et al., 2006) and
independent component analysis (Barati and Ayatol-
lahi, 2006). These algorithms tend to provide better
performance than adaptive methods, but at the cost
of much higher processing delays and computational
costs, hence the difficulty to apply them to real-time
systems.
Within this paper, an adaptive filtering scheme
based on (Thakor and Zhu, 1991) is presented. This
system inherits from adaptive systems the advantage
of a low computational cost while it avoids P-QRS-T
distortion by low-pass filtering of the estimated base-
line. This has the effect of achieving a narrower tran-
sition band in frequency domain at the cost of only
a few computations more while maintaining the pro-
476
Fraile R. and Godino-Llorente J. (2009).
LOW-COST ADAPTIVE METHOD FOR REAL-TIME ECG BASELINE WANDER REMOVAL WITH REDUCED P AND T WAVE DISTORTION.
In Proceedings of the International Conference on Bio-inspired Systems and Signal Processing, pages 476-479
DOI: 10.5220/0001534304760479
Copyright
c
SciTePress
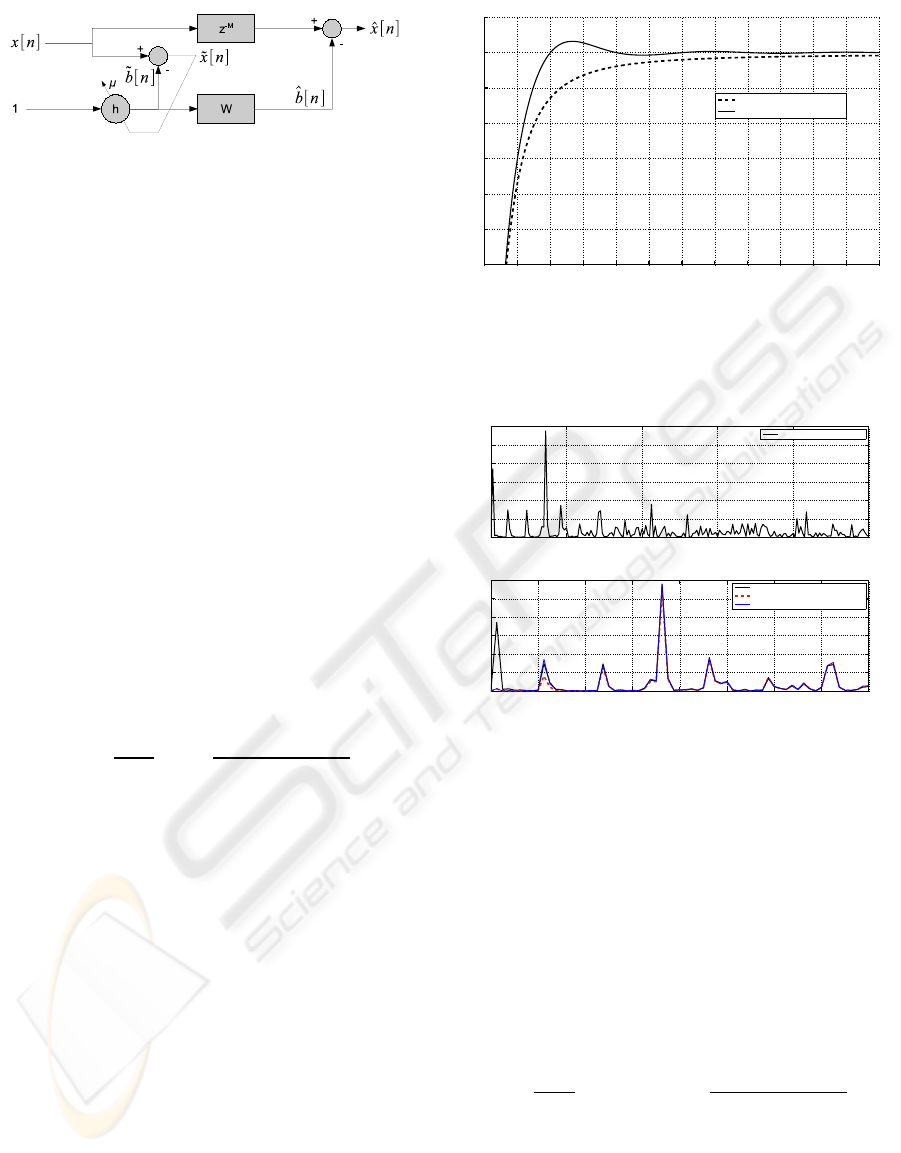
Figure 1: Block diagram of the proposed system: x[n] is the
the original ECG with baseline wander, (h,µ) is a single-
tap LMS filter,
˜
b[n] is a baseline estimate, such estimate is
smoothed to produce
ˆ
b[n], z
−M
is a delay of M samples and
ˆx[n] is the ECG without baseline wander.
cessing delay well below the duration of one heart
beat.
2 SYSTEM DESCRIPTION
The overall proposed system set-up is depicted in fig-
ure 1. The ECG signal is assumed to arrive into the
system sampled at a certain sampling frequency f
s
and superimposed to the baseline wander. This input
signal is named x[n] in the figure. It acts as the tar-
get signal of an adaptive LMS filter with a single tap
h and a constant input equal to 1. The learning rate
of the LMS algorithm is µ and its output (
˜
b[n]) is an
estimate of the ECG baseline. Thus, ˜x[n] = x[n] −
˜
b[n]
is an ECG with reduced baseline wander (Thakor and
Zhu, 1991). From the same figure, the transfer func-
tion between signals x[n] and ˜x[n] in z-domain can be
derived:
H (z) =
˜
X (z)
X (z)
= 1−
2µ
1− z
−1
· (1− 2µ)
(1)
and, from it, the frequency response (dashed line in
figure 2). This system behaves as a filter with a notch
at zero frequency and a bandwidth that depends on
the choice of µ. The graph in figure 2 indicates that
acceptable attenuation levels below 0.5 Hz can only
be achieved at the cost of unacceptable distortions
around 1 Hz.
Figure 3 (up) illustrates the relevance of the
above-mentioned distortion. An ECG is a quasi-
periodic signal whose spectrum, specially at low
frequencies, is formed by peaks placed at the fun-
damental frequency (1.12 Hz in this case) and its
harmonics. Frequency components below 5 Hz in a
clean ECG, that is, the first four or five harmonics,
correspond to the P and T waves (S¨ornmo and
Laguna, 2005). Consequently, if when removing
baseline wander (the peak below 0.5 Hz in this case)
significant distortion is allowed nearby the ECG’s
fundamental frequency and its first multiples, this
should have an effect on the form of P and T waves.
0 0.5 1 1.5 2 2.5 3 3.5 4 4.5 5 5.5 6
−6
−5
−4
−3
−2
−1
0
1
Frequency (Hz)
Amplitude reponse
Gain (dB)
Without moving average
With moving average
Figure 2: Frequency response of the adaptive scheme in
(Thakor and Zhu, 1991) for µ = 0.005 and f
s
= 360 Hz
(dashed line) and the herein proposed system (continuous
line) for the same conditions, being W a rectangular win-
dow with 361 coefficients and M = 180.
0 5 10 15 20 25
0
0.005
0.01
0.015
0.02
0.025
0.03
Frequency (Hz)
Power spectral density
0 1 2 3 4 5 6 7 8
0
0.005
0.01
0.015
0.02
0.025
0.03
Frequency (Hz)
Power spectral density
Original ECG (MIT rec. 103)
BW removed without moving average
BW removed with moving average
Original ECG (MIT rec. 103)
Figure 3: Periodogram-based spectrum estimation of ECG
MIT record no. 103 (Physionet, 2007) (up) and comparison
with processed ECG’s for baseline wander removal (down).
The previously described system, which exactly
corresponds to (Thakor and Zhu, 1991), can be easily
improved if the baseline estimate
˜
b[n] is smoothed by
a moving average filter with transfer function equal to
W(z), thus producing a smoother estimate of the base-
line
ˆ
b[n] (figure 1). The group delay of filterW(z) can
be compensated by means of a delay of M samples
introduced in x[n] before subtracting
ˆ
b[n] so as to pro-
duce a less distorted ECG ˆx[n]. This way, the system
function becomes:
ˆ
H (z) =
ˆ
X (z)
X (z)
= z
−M
− W (z)·
2µ
1− z
−1
· (1− 2µ)
(2)
If W(z) is chosen such that its value is zero for
z = e
jω
k
, where ω
k
/2π are frequencies in which the
ECG has significant components, then the whole filter
ˆ
H(z) can be ensured to have unit amplitude response
for those frequencies, thus achieving a reduction in
LOW-COST ADAPTIVE METHOD FOR REAL-TIME ECG BASELINE WANDER REMOVAL WITH REDUCED P
AND T WAVE DISTORTION
477

Figure 4: Implementation proposal for the moving average.
the distortion within those bands:
ˆ
H(e
jω
k
) = e
− jMω
k
− (3)
−W(e
jω
k
) ·
2µ
1− e
− jω
k
· (1− 2µ)
= e
− jMω
k
Figure 2 shows the frequency response of this
modified system compared to that of the original one.
It can be seen that while similar attenuations are
achieved for frequencies below 0.5 Hz, null distor-
tions are achieved for frequencies ω
k
/2π equal to 1
Hz and its harmonics. In other words, the exact fre-
quency response depends on both µ and W(z); how-
ever, the zeroes of W(e
jω
) correspond to unit am-
plitudes of
ˆ
H
e
jω
which ensure little distortion at
the frequencies of interest and, in addition, make the
whole system response less sensitive to the choice of
µ.
3 IMPLEMENTATION ISSUES
Recalling equation (1) and transforming it into time
domain:
˜x[n] = ( ˜x[n− 1] + x[n] − x[n− 1]) · (1− 2µ) (4)
Therefore, the original system requires two addi-
tions plus one product per ECG sample. The number
of necessary operations per sample of the modified
system depends on the specific implementation cho-
sen for W. In figure 4, an implementation proposal
based on a 2M-order rectangular moving average fil-
ter is drawn. Such implementation only requires two
additions and one product per sample:
ˆ
b[n] = (
ˆ
b[n− 1] +
˜
b[n] −
˜
b[n− 2M − 1]) ·
1
2M + 1
(5)
This, together with the original scheme and the ad-
ditional subtraction illustrated at the right of figure 1,
results in a total of five additions and two products
per sample. This makes the scheme especially ap-
propriate for real-time implementation. Specifically,
1 1.5 2 2.5 3
−0.5
0
0.5
1
1.5
2
2.5
Time (sec)
1 1.5 2 2.5 3
−0.5
0
0.5
1
1.5
2
2.5
Time (sec)
Original ECG (MIT rec. 103)
BW removed with moving average
Original ECG (MIT rec. 103)
BW removed without moving average
Figure 5: Original (thick line) and processed (thin line)
ECG’s for the herein proposed system (left) and the system
in (Thakor and Zhu, 1991) (right).
for f
s
= 360 Hz only 1800 additions and 720 prod-
ucts per second are required. This results in a total
of 2520 floating point operations (FLOP) that, con-
sidering that the performance of current digital signal
processors easily reaches 150 million FLOP per sec-
ond (Texas Instruments, 2008), means that less than
17 µs of computation are required per second.
4 RESULTS
Figure 5 shows the results of applying both schemes
to the same ECG record reported in (Weng et al.,
2006), namely record 103 of the MIT database (Phys-
ionet, 2007), and with the same conditions. The plots
show that the new system including the moving av-
erage W(z) produces a noticeably better match be-
tween reference and processed signals than the adap-
tive system without the moving average. Quantita-
tively, a signal-to-error ratio (see (Weng et al., 2006)
for its definition) equal to 22.9 dB can be achieved
with the herein introduced scheme for the first 2,000
samples of this record, whereas the system in (Thakor
and Zhu, 1991) reaches 17.2 dB. Note that the results
reported in (Weng et al., 2006) are also around 17.2
dB for the same part of the record and the herein re-
ported improvement up to 22.9 dB has been achieved
with a computationally simpler algorithm.
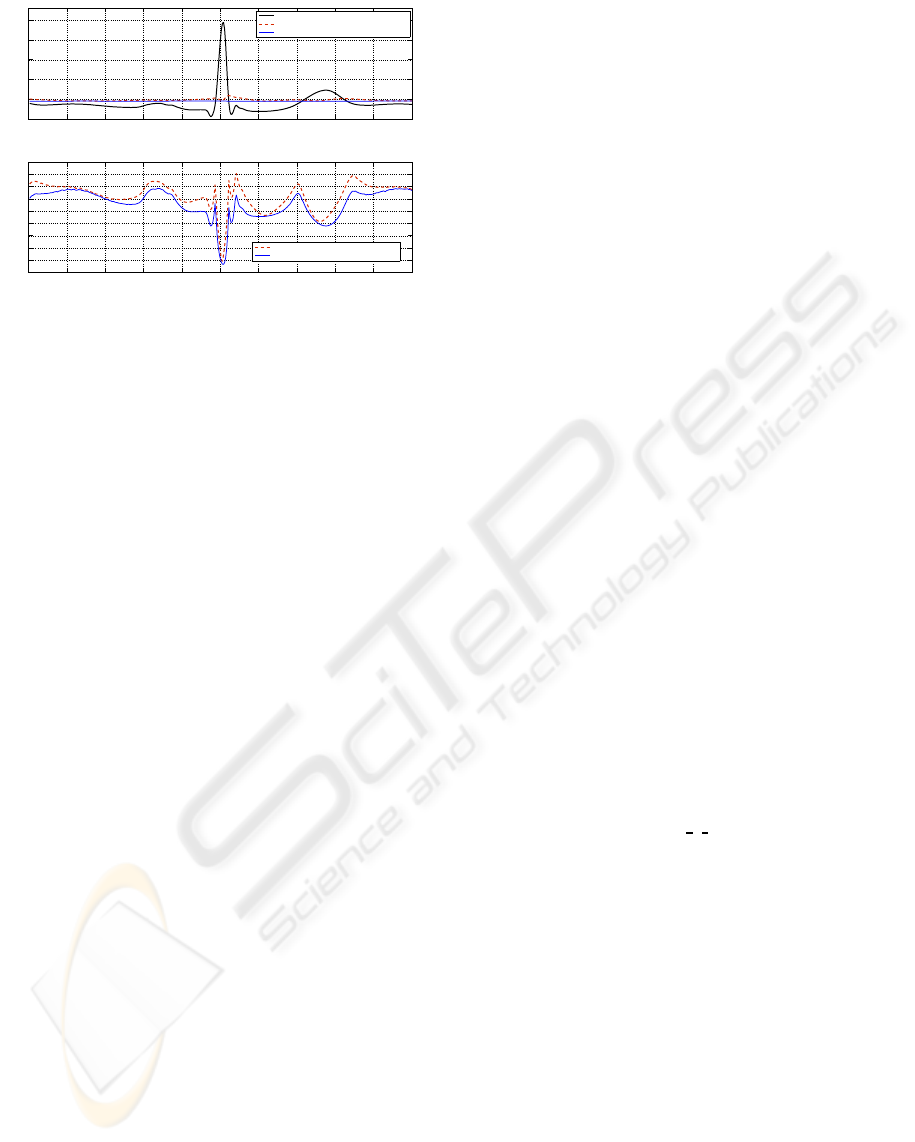
Figure 6 provides a deeper insight in the origin of
the performance improvement. The upper part of the
figure shows the root mean square (RMS) difference
between the processed ECG and the original signal
for both evaluated methods. It can be noticed how the
filter with the moving average equalises the distortion
along the whole P-QRS-T complex, while the absence
of the moving average has the consequence of some
parts of the complex being more distorted than oth-
ers. A quantification of such distortion is plotted in
BIOSIGNALS 2009 - International Conference on Bio-inspired Systems and Signal Processing
478
0 0.1 0.2 0.3 0.4 0.5 0.6 0.7 0.8 0.9 1
−0.4
0.1
0.6
1.1
1.6
2.1
2.4
Time (sec)
Amplitude
0 0.1 0.2 0.3 0.4 0.5 0.6 0.7 0.8 0.9 1
−35
−30
−25
−20
−15
−10
−5
0
5
10
Time (sec)
Normalised distortion (dB)
Average ECG complex (MIT rec. 103)
Average RMS error without moving average
Average RMS error with moving average
Average disortion without moving average
Average distortion with moving average
Figure 6: RMS error with respect to the original ECG aver-
aged per P-QRS-T complex for the full MIT record no. 103
(up) and averaged distortion along the P-QRS-T complex
in dB, calculated as the inverse of the signal-to-error ratio
(down).
the bottom graph. Namely, the inverse of the instanta-
neous signal-to-error ratio averaged for all P-QRS-T
complexes has been chosen as a measure of distor-
tion. It can be seen that improvements of up to 5 dB
are achieved for the P-Q segment, the S wave and the
end of the T wave.
This effect can also be assessed in spectral do-
main by analysing the spectra of original and pro-
cessed ECG’s. These spectra are depicted in the bot-
tom graph of figure 3. While both baseline wander
removal algorithms remove the spectral peak below
0.5 Hz, the herein proposed system achieves so with-
out affecting the first harmonic of the ECG, while a
significant distortion is produced if the moving aver-
age is not used.
5 CONCLUSIONS
Within this paper an evolved adaptive system for
the removal of ECG baseline wander has been in-
troduced. Both the low computational complexity
and the short delay (about half a beat period) of the
scheme make it useful for real-time implementation.
At the same time, preliminary tests indicate that this
system may outperform other more complex systems
in terms of signal distortion without any averaging
that lasts for more than one heart beat, and with-
out any P-QRS-T averaging at all, thus avoiding the
masking of beat-to-beat variations.
A supplementary improvement on the proposed
baseline removing system could be achieved by
adapting the lengths of the filter W and the shift
register M to the beat-to-beat period. If, within
the ECG processing posterior to baseline wander re-
moval, QRS detection is to be performed, then the
reduced distortion in frequency domain should be
achieved exactly at the harmonics of the ECG funda-
mental frequency without specifically increasing the
computational complexity of the baseline filter.
ACKNOWLEDGEMENTS
This research was carried out within projects funded
by the Ministry of Science and Technology of
Spain (TEC2006-12887-C02) and the Universidad
Polit´ecnica de Madrid (AL06-EX-PID-033).
REFERENCES
Barati, Z. and Ayatollahi, A. (2006). Baseline wandering
removal by using independent component analysis to
single-channel ECG data. In Proc. of the International
Conference on Biomedical and Pharmaceutical Engi-
neering ICBPE 2006, pages 152–156. ID: 1.
Laguna, P., Jane, R., and Caminal, P. (1992). Adaptive fil-
tering of ECG baseline wander. In Proc. of the 14th
Annual International Conference of the IEEE Engi-
neering in Medicine and Biology Society, volume 14,
pages 508–509.
Physionet (2007). The MIT-BIH arrythmia database. URL:
http://www.physionet.org/physiobank/database/mitdb/.
S¨ornmo, L. (1991). Time-varying filtering for removal of
baseline wander in exercise ECGs. In Proc. of Com-
puters in Cardiology, pages 145–148.
S¨ornmo, L. and Laguna, P.(2005). Bioelectrical Signal Pro-
cessing in Cardiac and Neurological Applications. El-
sevier Academic Press.
Texas Instruments (2008). Digital signal pro-
cessing (DSP) development tools. URL:
http://www.ti.com/home p dsp.
Thakor, N. V. and Zhu, Y. (1991). Applications of adap-
tive filtering to ECG analysis: noise cancelation and
arrhythmia detection. IEEE Transactions on Biomed-
ical Engineering, 38(8):785–794.
Weng, B., Blanco-Velasco, M., and Barner, K. E. (2006).
Baseline wander correction in ECG by the empiri-
cal mode decomposition. In Proc. of the 32nd IEEE
Annual Northeast Bioengineering Conference, pages
135–136.
Zhang, D. (2005). Wavelet approach for ECG baseline wan-
der correction and noise reduction. In Proc. of the 27th
Annual International Conference of the IEEE Engi-
neering in Medicine and Biology Society IEMBS 05,
pages 1212–1215.
LOW-COST ADAPTIVE METHOD FOR REAL-TIME ECG BASELINE WANDER REMOVAL WITH REDUCED P
AND T WAVE DISTORTION
479
