
MULTIFOCAL ELECTRORETINOGRAPHY
Early Detection of Glaucoma based on Wavelets and Morphological Analysis
J. M. Miguel, S. Ortega, I. Artacho, L. Boquete, J. M. Rodríguez
Department of Electronics, University of Alcalá, 28701 Alcalá de Henares, Spain
P. De La Villa
Department of Physiology, University of Alcalá, 28701 Alcalá de Henares, Spain
R. Blanco
Department of Surgery, University of Alcalá, 28701 Alcalá de Henares, Spain
Keywords: Wavelet transforms, Glaucoma, m-sequence, Multifocal electroretinogram, Morphological analysis.
Abstract: This article presents one of the alternative methods developed for the early detection of ocular glaucoma
based on the characterisation of mfERG (multifocal electroretinography) readings. The digital signal
processing technique is based on Wavelets, hitherto unused in this field, for detection of advanced-stage
glaucoma and the study of signal morphology by means of identity patterns for detection of glaucoma in
earlier stages. Future research possibilities are also mentioned, such as the study of orientation in the
development of the disease.
1 INTRODUCTION
Glaucoma is currently deemed to be a high-risk eye
disease since a large percentage of the population
suffer from its effects. The method proposed herein
has been developed for study and analysis of OAG
(open angle glaucoma), the commonest form in
today’s society.
The sheer complexity of the disease and its
occultation make early and reliable detection
essential. The traditional techniques for clinical
analysis of the retina are based on indirect methods
(measurement of the intraocular pressure, visual
inspection of the eyeground, campimetric tests, etc).
Their main drawback is that they do not give
objective information on the functioning of the
retinal photoreceptors (Catalá et al., 2005), essential
elements in the perception of light energy. A new
technique has recently been developed for obtaining
this retina-functioning information in a quick and
reproducible way; this technique is known as the
multifocal electroretinogram (mfERG). The mfERG
enables a functional exploration to be made of the
light sensitivity of the retinal cells and also the
spatial distribution of this sensitivity (J. M. Miguel
et al., 2007). The mfERG basically involves
recording the variations in retinal potential evoked
by a light stimulus and then mapping out the results
in a 2D or 3D diagram showing those regions that
respond to the visual stimuli (Sutter & Tran, 1992)
(Sutter EE., 2001).
The mfERG technique allows simultaneous
recording of local responses from many different
regions of the retina, building up a map of its
sensitivities. As in the conventional
electroretinogram (ERG), also called the full-field
electroretinogram, the potential is measured as the
sum of the electric activity of the retina cells. In the
full-field ERG, however, the signal recorded comes
from the whole retina surface, so it is hard to detect
smaller one-off defects that do not affect the whole
retina. The mfERG, by contrast, gives detailed
topographical information of each zone and can
therefore detect small-area local lesions in the retina
and even in its central region (fovea) (D. C. Hood et
al., 2003).
From the technical point of view, equipment is
needed for capturing the visually evoked potentials
17
M. Miguel J., Ortega S., Artacho I., Boquete L., M. Rodríguez J., De La Villa P. and Blanco R. (2009).
MULTIFOCAL ELECTRORETINOGRAPHY - Early Detection of Glaucoma based on Wavelets and Morphological Analysis.
In Proceedings of the International Conference on Biomedical Electronics and Devices, pages 17-23
DOI: 10.5220/0001430300170023
Copyright
c
SciTePress
at retina level (presented as a set of hexagons of
varying sizes and intensities). Due to the low
amplitude of the signals generated (down to
nanovolt level), the technique calls for suitable
hardware equipment (recording electrodes,
instrumentation amplifiers, digitalisation, etc) and
also signal processing algorithms (filtering,
averaging or smoothing procedures, rejection of
artefacts, etc) to ensure that the results are clinically
useful (M. F. Marmor et al., 2003).
This paper gives a description of the recording
and arrangement of the signals we have used in our
research, the signal analysis by the Wavelet
transform for recording possible advanced-stage
glaucoma markers, the detection of smaller lesions
by means of morphological analysis of the signal; it
also mentions possible future research lines.
2 METHODS
2.1 Obtaining the Signals
A total of 50 patients with diagnosis of advanced
open angle glaucoma (OAG) as well as an identical
number of healthy subjects were included in our
mfERG record database, used for obtaining markers
by means of the wavelet transform. Moreover, to
study the efficiency of our morphological analysis, a
second database was drawn up formed by 15
patients diagnosed with early-stage Glaucoma plus
an identical number of healthy controls.
The signal recording system was the VERIS 5.1
multifocal recording system (Electro-Diagnostic
Imaging, San Mateo, USA). The stimulus consisted
of an m-sequence applied to a group of 103
hexagons, as shown in figure 1, displayed on a 21-
inch monitor and covering a 45º arc of the retina.
The local luminance of each hexagon was 200 cd/m
2
in the on phase and less than 1.5 cd/m
2
in the off
phase, determined by the pseudorandom sequence.
The monitor frequency was 75 Hz and the m-
sequence was modified so that each step was
followed by 4 frames in the following order: flash-
dark-flash-dark, as shown in figure 2. In the flash
frames all the hexagons were illuminated with a
maximum luminance of 200 cd/m
2
, with a minimum
luminance of less than 1.5 cd/m
2
in the dark frames.
The background luminance of the rest of the monitor
surface surrounding the hexagons was held steady at
100 cd/m
2
. This stimulation protocol is especially
adapted for obtaining responses from the retinal
ganglion cells and their axons (Hagan R. P. et al.,
2006). It is based on the effect of the focal responses
(M) on the following global stimulus (F), which
amplifies the signals coming from the ganglion cells.
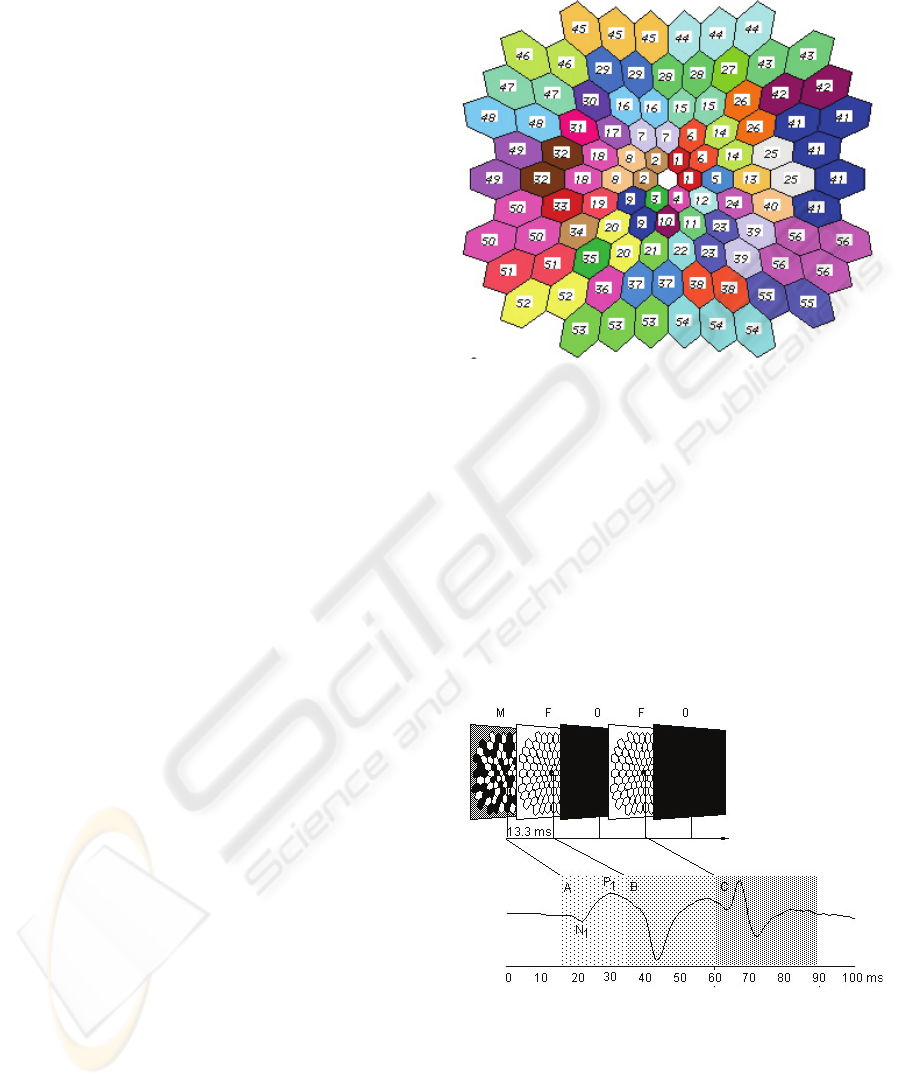
Figure 1: Geometry of the multifocal stimulus and
regrouping of the hexagons.
Basically, the protocol (M-F-O-F-O) consists of
five steps. In the first step (M) each hexagon follows
a luminous stimulation (200 cd/m
2
) determined by a
pseudorandom binary m-sequence. In the second
step the whole area is illuminated (200 cd/m
2
) (F),
followed by a dark sequence (O) (<1.5 cd/m
2
),
followed by another global flash (200 cd/m
2
) (F) and
then darkness again (O) (<1.5 cd/m
2
). This
stimulation will give us an acceptable signal-to-
noise ratio and also ensures a reasonably short
recording time (9 minutes).
Figure 2: Modification of the m-sequence.
The stimulus was displayed through
pharmacologically dilated pupils (minimum
diameter of 7 millimetres) using a Burian-Allen
bipolar contact lens (Hansen ophthalmics, Iowa
City, IA). Contact lens adaptation was facilitated by
a drop of topical anaesthetic (0.5% Proparacaine).
BIODEVICES 2009 - International Conference on Biomedical Electronics and Devices
18

The residual spherical refractive error was corrected
by the VERIS™ autorefractor, mounted on the
stimulation monitor. The alignment of the patient’s
pupil with the monitor optic and the fixation stability
are controlled by an attached infrared camera. Each
monocular recording lasts about 9 minutes
(exponent of the stimulation m-sequence = 13). To
make the process more comfortable for the patient,
the recording process was divided into eighteen 30-
second segments. Segments contaminated with
ocular movements were discarded and recorded
anew. The signals are amplified with a Grass
Neurodata Model 15ST amplification system (Grass
Telefactor, NH), with a 50,000 gain, filters with 10-
300 Hz bandwidth and a sampling interval of 0.83
milliseconds (1200 Hz).
Each participant was given a complete
ophthalmic exam, including general anamnesis, best-
corrected visual acuity, slit lamp biomicroscopy,
intraocular-pressure measurement using the
Goldmann applanation tonometer, gonioscopy,
dilated fundoscopic examination (90D lens), stereo
retinographs and a 24-2 SITA Humphrey automated
perimetry (Swedish Interactive Threshold
Algorithm. Carl Zeiss Meditec Inc.). A diagnosis of
open angle glaucoma was established where there
were at least two consecutive abnormal visual fields
in the Humphrey campimetry, (threshold test 24-2),
defined by: 1) a pattern standard deviation (PSD)
and/or corrected pattern standard deviation (CPSD)
below the 95% confidence interval; or 2) a
Glaucoma Hemifield Test outside the normal limits.
We define as abnormal an altitudinal hemifield in
the Humphrey visual field analysis giving three or
more contiguous sectors below the 95% confidence
interval, with at least one of them below the 99%
confidence interval. The visual field was dismissed
as unreliable if the rate of false positives, false
negatives or fixation losses was higher than 33%. A
control database was also established on the basis of
normal eye records established within the
longitudinal prospective study. All these normal eye
records had an intraocular pressure of 21 mmHg or
less (with no previous history of ocular
hypertension). An ophthalmic examination of the
optic papilla was also conducted to check that it fell
within the normal structural parameters.
The signals obtained from the 103 hexagons
were regrouped and averaged to build up a new 56-
sector map as shown in figure 1. The purpose of this
regrouping was to simplify the analysis and to
improve the signal-to-noise ratio. A 56-sector
topography was therefore chosen, similar to that
studied in automated campimetry, the clinical ¨gold-
standard¨ for evaluating the visual field. It should
also be noted here that sector 41 is the average of a
greater number of hexagons, since it is the area
containing the blind spot and, as such, more difficult
to analyse.
Two mfERG record databases were built up, one
containing healthy or control individuals and the
other glaucoma-affected individuals for study by
means of the Discrete Wavelet Transform (DWT).
Two other specific databases were also created to be
studied by means of an alternative technique,
Morphological Analysis, all made up by a complete
56-sector map as shown in figure 1.
Not all the sectors making up the map to be
analysed by the Wavelet Transform belonged to a
single patient; the map groups together 56 clearly
glaucoma-identified sectors from among the fifty
patients diagnosed with the same symptom.
Following a similar procedure, a sector map
comprising the control database was built up, this
time on the basis of healthy individuals.
As regards the databases used for the
morphological analysis, these were made up by two
15-record collections from the 56 sectors: the first
coming from 15 patients affected with early-stage
OAG and showing between 3 and 12 diseased
sectors, and the other built up from the 15 healthy
control subjects.
2.2 Study of Severe Lesions by Wavelet
Analysis
DWT was better than morphological analysis as a
mfERG-record analysis tool for detecting severe
retina lesions. Conversely, morphological analysis
was much more efficient for detecting early-stage
glaucoma by extracting certain markers present in
the records.
The great drawback of the Fourier transform-
based analysis is that the time information is
forfeited when the signal is transformed into the
frequency domain. The drawback is particularly
telling when the signal to be analysed is transitory in
nature or of finite duration, as in the case of mfERG
signals, whose frequency content changes over time.
The discrete wavelet transform (DWT) surmounts
this drawback by analysing the signal in different
frequencies with different resolutions, using regions
with windowing of different sizes and obtaining a
two-dimensional time-frequency function as a result.
Wavelet analysis uses finite-length, oscillating, zero-
mean wave forms, which tend to be irregular and
asymmetrical. These are the windowing functions
called mother wavelets. In principle there may be an
MULTIFOCAL ELECTRORETINOGRAPHY - Early Detection of Glaucoma based on Wavelets and Morphological
Analysis
19
infinite number of possible waves that are eligible
for use as wavelets, but in practice a more limited
number of wavelets are used, of well-known
characteristics, efficacy and implementation: Haar,
Daubechies, Coiflets, Mexican Hat, Symlets, Morlet,
Meyer, etc. In the study we are dealing with here a
great number of them were explored; it was with the
Bior3.1 wavelet that the best subjective results were
obtained for visual identification of certain markers
that help us to differentiate normal mfERG signals
from those belonging to subjects with advanced
glaucoma (J. M. Miguel et al., 2008).
The signal to be analysed is decomposed on the
basis of shifted and dilated versions of the mother
wavelet or analysing wavelet that we have decided
to use; this is all done by means of the correlation
between the signal to be decomposed and the
abovementioned versions of the mother wavelet.
Mathematically, the discrete wavelet transform
(DWT) is defined as:
/2
( , ) ( )2 (2 )
jj
nz
Cjk fn n k
ψ
−−
∈
=−
∑
(1)
where the resulting C(j,k) is a series of coefficients
indicating the correlation between the function f(n)
to be decomposed and the wavelet ψa,b(t) dilated to
a scale a=2
j
and with a shifting b=k2
j
, with j,k Є Z.
The resulting C(j,k) includes time and frequency
information of the function f(n), according to the
values of j and k, respectively. In practice we obtain
two sets of time-function signals, one of them made
up by the signals A
1
to A
n
which represent
successive approximations of increasing smoothness
or declining frequency of the signal f(n), and the
other by D
1
to D
n
which represent the successive
details, also of falling frequency.
The signals were analysed by applying up to 5
levels of wavelet decomposition to each one of the
different sectors and for two different time windows:
one from 10 to 190 ms and another from 60 to 90
ms. The first contains the global response to the
multifocal stimulus used here and the second
contains the most important information on the
induced response generated by this type of stimulus.
Several superimposed records were obtained from
different sectors to obtain an overview of the
markers that might differentiate normal signals from
abnormal signals.
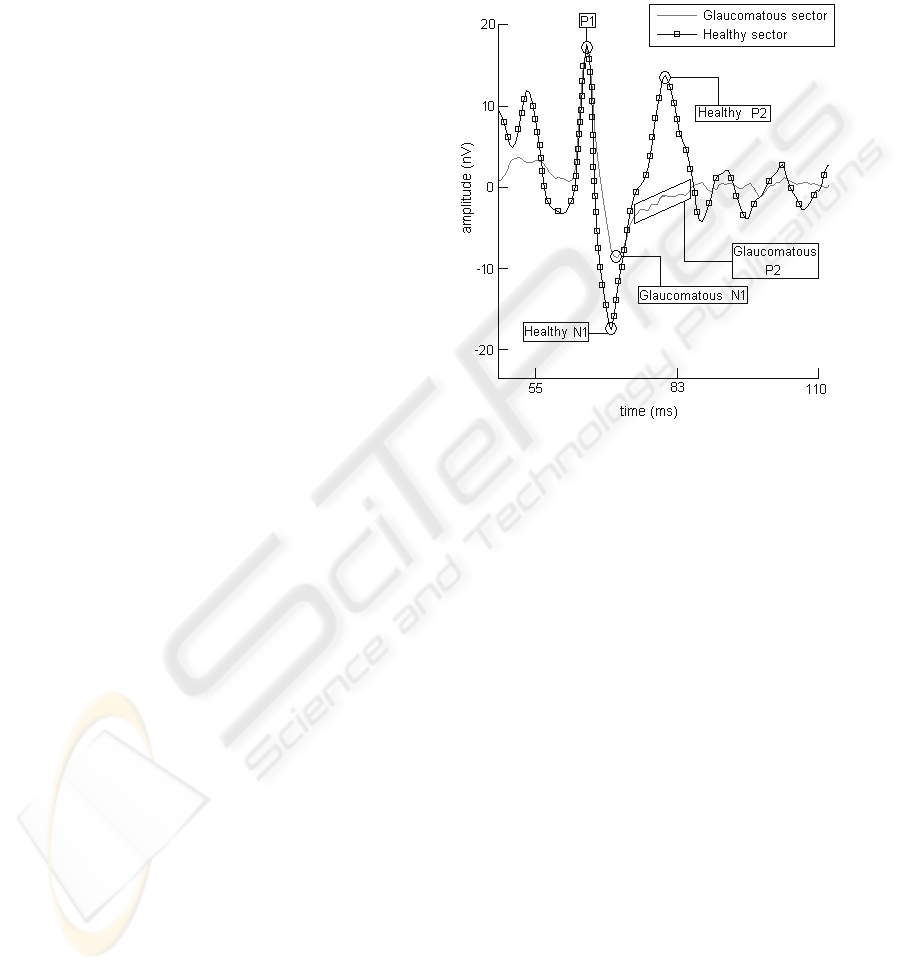
2.3 Study of Slight Lesions by
Morphological Analysis
The mfERG readings from patients with early-stage
glaucoma, with slight lesions or isolated sectors
developing the disease, do not show a uniform
pattern over the healthy or diseased retina sectors.
This makes the analysis thereof more critical. To
detect lesions of this type a morphological signal
study was conducted in the IC time interval (induced
component) falling between P1 and P2, as shown in
figure 3.
Figure 3: Morphology of the mfERG signal from one
sector.
Although the claim cannot be made across the
board for all cases, there is usually a series of
morphological characteristics held in common in the
records of healthy sectors, differentiating them from
the diseased ones. These are called identity patterns
(Brad et al., 2002). The identity pattern of the
healthy sectors shows little variation and contains a
quick signal response in and near the induced
component, thus building up more energy at mid
frequencies. This conduct reflects the behaviour of
the healthy retina cells, which tend to respond
quickly and efficiently to the mfERG stimulus. The
behaviour of a glaucomatous sector, on the other
hand, shows much more high frequency oscillatory
potentials in the IC interval, with a more blurred
definition of signal peaks and troughs and a long
drawn-out response. Given the signal characteristics
in said interval, our morphological analysis studies
the behaviour of the following signal parameters:
Localisation of points P1, N1 and P2.
Distance between P1 and P2.
Sample width at N1.
Slope in the interval N1 - P2.
Signal oscillations in the interval N1 - P2.
BIODEVICES 2009 - International Conference on Biomedical Electronics and Devices
20
The waveform of the mfERG reading changes
from one sector to another, depending on the retina
position of each one. To allow for this effect the
analyses have been carried out under different
performance parameters, depending on the sector’s
position in the retina. Results show that the
individualised study of each sector zone gives our
method an enhanced spatial resolution.
3 RESULTS
In the DWT analysis, several superimposed records
were obtained from different sectors to obtain an
overview of the markers that might differentiate
normal signals from abnormal signals.
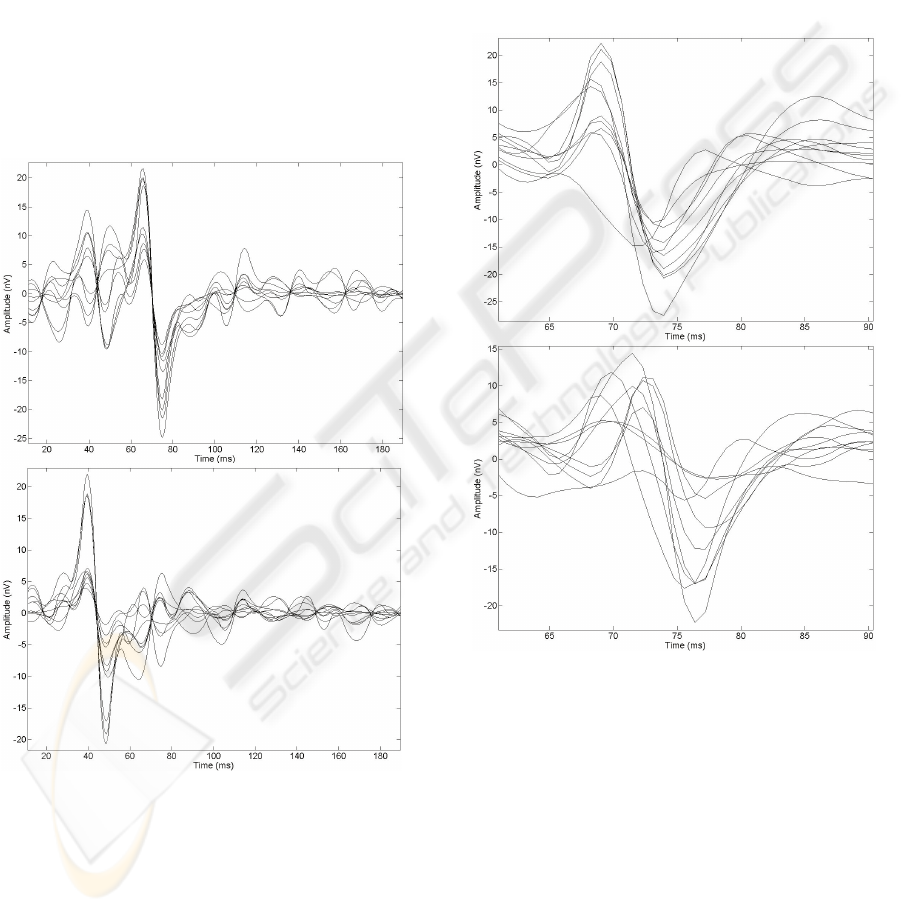
Figure 4: Detail D4 of the wavelet decomposition for 10
normal sectors (top) and 10 glaucomatous (bottom).
The top graph of figure 4 shows superimposed
the D4 details of the Wavelet decomposition
between 10 and 190 ms from ten different sectors
corresponding to various healthy individuals. The
bottom graph of the same figure shows a similar
representation for ten glaucomatous sectors and with
an identical topographical position to the former.
One of the most obvious features here is that the
signals corresponding to healthy individuals show
their greatest negative edge at about 70 ms, while
signals in the hexagons affected by glaucoma tend to
bottom out at about 45 ms. The efficiency of this
marker was quantified against a time window
running from 25 to 90 ms, looking for the greatest
negative edge. When this edge came in the first half
of the window the signal was classified as
glaucomatous, while if it came in the second half it
was classified as healthy.
Figure 5: A2 approximation of the wavelet decomposition
for 10 normal sectors (top) and 10 glaucomatous (bottom).
Figure 5 (top) shows superimposed the A2
approximations corresponding to the wavelet
decomposition between 60 and 90 ms of ten
different hexagons belonging to different healthy
individuals. The lower part of this figure shows a
similar representation for ten hexagons affected with
glaucoma and with the same topographical position
as those above. In this case a trough appears at about
73 ms for healthy signals, coming slightly later for
abnormal subjects. Since there might be more
troughs, the efficiency of this second marker is
quantified against a time window running from 65 to
MULTIFOCAL ELECTRORETINOGRAPHY - Early Detection of Glaucoma based on Wavelets and Morphological
Analysis
21
87 ms., seeking this trough. When the trough comes
in the first half of the window the signal was
classified as healthy, while if it came in the second
half it was classified as glaucomatous.
Table 1 shows the results, using both markers
separately, for true and false healthy and
glaucomatous out of a set of 56 sectors belonging to
different healthy individuals and 56 with glaucoma.
Table 1: Results obtained using DWT markers separately
(M=Marker, TH= True Healthy, FG=False Glaucomatous,
TG= True Glaucomatous, FH=False Healthy).
M TH FG TG FH
D4 55 1 48 8
A2 54 2 51 5
The morphological analysis of slight lesions
shows that the duration of the N1 interval is less in
healthy than in glaucomatous sectors, the time-lag of
P2 behind P1 is less in healthy than in glaucomatous
sectors, the amplitude of P2 has to be positive, the
glaucomatous signal shows greater sensitivity in P2
than in N1 and in P1 (accepting a 2% variation).
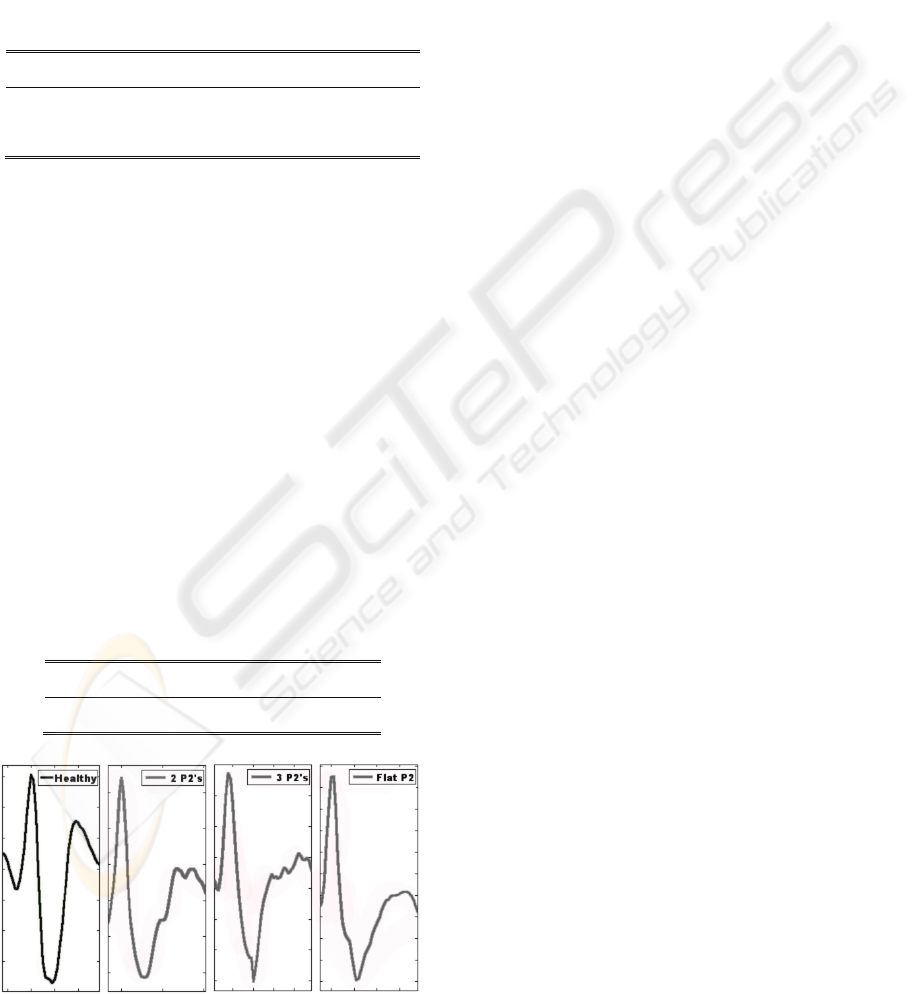
The disease also shows a change in the
deterioration of healthy sectors according to whether
the lesion is slight or severe (see Figure 6 from left
to right). This evolution can be seen in P2, changing
from a healthy sector morphology with a sharp P2
peak rising quickly from N1, to a flat morphology
with high frequency alterations in P2 (slight case)
and lastly to an even flatter P2 morphology (severe
case). The study’s statistical results are shown in
table 2.
Table 2: Results of the morphological study TH= True
Healthy, FG=False Glaucomatous, TG= True
Glaucomatous, FH=False Healthy).
TH FG TG FH
80 % 20 % 90 % 10 %
Figure 6: P2 wave morphology trend.
4 CONCLUSIONS
The morphology of the signals recorded in each
hexagon varies according to the position that this
hexagon occupies in the retina and the type of
stimulus used. It is also known that the optic nerve
head component (ONHC) is the main cause of the
asymmetries in the records (Brad et al., 2002) (Wei
et al., 2007), whereby said component arrives in
each hexagon with a different time-lag depending on
the distance between the hexagon and the optic
nerve. This will enhance or cancel out some
components as a result of the different retina levels
below the hexagon under study. Loss of the ONHC
has already been mooted as an early indicator of
glaucoma (Nalini et al., 2006) (D. C. Hood, 2000),
so there is obviously a need for adjustment of the
various time windows and types of markers used in
this study, according to the position of the hexagon
in the retina map, to optimise and fine tune the
results obtained herein.
A more in-depth investigation needs to be
carried out to adjust the parameters obtained herein
by means of DWT analysis, to find out best values in
terms of the retinal quadrants and rings to which the
sector under study belongs, in view of the
abovementioned hexagon dependency.
The type of markers used herein and the tool
used to obtain them, i.e., the Wavelet transform,
make it impossible a priori to establish any
association with a specific physiological origin,
since there are no precedents to go on. It does not
fall within the remit of this study to establish a
physiological cause-effect relationship for the
marker but rather to search for technical tools to help
experts to diagnose glaucoma in humans in its early
stages of development.
It is obvious that a joint and complementary use
of all the techniques studied herein would be the best
way to improve OAG diagnosis. In this way the
sectors detected as healthy in the Wavelet study
would be introduced into the signal morphology
analysis to check whether there might be any slight
lesions that Wavelet analysis was incapable of
picking up.
ACKNOWLEDGEMENTS
This work was supported by grants from Comunidad
de Madrid-Universidad de Alcalá (ref. nº CCG06-
UAH/BIO-0711) and Ministerio de Educación y
Ciencia (ref. nº SAF2004-5870-C02-01) awarded to
Pedro de la Villa.
BIODEVICES 2009 - International Conference on Biomedical Electronics and Devices
22

REFERENCES
Brad Fortune, Marcus A. Bearse, Jr, George A. Cioffi, and
Chris A. Johnson, 2002. Selective Loss of an
Oscillatory Component from Temporal Retinal
Multifocal ERG Responses in Glaucoma. IOVS Vol.
43, No. 8, Association for Research in Vision and
Ophthalmology, pp. 2638-2647.
Catalá Mora J., Castany Aregall M., Berniell Trota J. A.,
Arias Barquet L., Roca Linares G., and Jürgens Mestre
I., 2005. Electrorretinograma Multifocal y
Degeneración Macular Asociada a la Edad. Archivos
de la Sociedad Española de Oftalmología, Vol. 80 No.
7.
D. C. Hood, 2000. Assessing Retinal Function with the
Multifocal Technique. Progress in Retinal and Eye
Research. Vol. 19, No. 5, pp. 607-646.
D. C. Hood, J. G. Odel, C. S. Chen, and B. J. Winn, 2003.
The Multifocal Electroretinogram. J Neuro-
Ophthalmol, Vol. 23, No. 3, pp. 225-235.
Hagan R. P., Fisher A. C., and Brown M. C., 2006.
Examination of short binary sequences for mfERG
recording. Doc Ophthalmol, Vol. 113, pp. 21-27.
J. M. Miguel, R. Blanco, L. Boquete, J. M. Rodríguez, and
P. De la Villa, 2007. Electroretinography Multifocal.
Técnicas y Aplicaciones. CISTI 2007, Porto, Portugal.
J. M. Miguel, R. Blanco, L. Boquete, J. M. Rodríguez, and
P. De la Villa, 2008. Multifocal Electroretinography.
Glaucoma Diagnosis by Means of TheWavelet
Transform, IEEE CCECE 2008. ISBN: 978-1-9244-
1643-1.
M. F. Marmor, D. C. Hood, D. Keating, M. Kondo, M. W.
Seeliger, and Y. Miyake, 2003. Guidelines for basic
multifocal electroretinography (mfERG). Documenta
Ophthalmologica, Kluwer Academic Publishers, Vol.
106, pp. 105-115.
Nalini V. Rangaswamy, Wei Zhou, Ronald S. Harwerth,
and Laura J. Frishman, 2006. Effect of Experimental
Glaucoma in Primates on Oscillatory Potentials of the
Slow-Sequence mfERG. IOVS Vol. 47, No. 2,
Association for Research in Vision and
Ophthalmology, pp. 753-767.
Sutter EE., 2001. Imaging visual function with the
multifocal m-sequence technique. Vision Res. Vol. 41,
pp. 1241-1255.
Sutter EE., and Tran D., 1992. The field topography of
ERG components in man--I. The photopic luminance
response. Vision Res. Vol. 32, pp. 433-446.
Wei Zhou, Nalini Rangaswamy, Periklis Ktonas, Laura J.
Frishman, 2007. Oscillatory potentials of the slow-
sequence multifocal ERG in primates extracted using
the Matching Pursuit method. Vision Research 47,
Elsevier, pp. 2021-2036.
MULTIFOCAL ELECTRORETINOGRAPHY - Early Detection of Glaucoma based on Wavelets and Morphological
Analysis
23
