
INTEGRATING R MODELS WITH WEB TECHNOLOGIES
Mingrui Zhang
1,2
, Scott Olson
1
, Joan Francioni
1
, Tim Gegg-Harrison
1
, Nan Meng
1
Zhifu Sun
2
and Ping Yang
2
1
Department of Computer Science, Winona State University, Winona, MN, U.S.A.
2
Department of Health Science Research, Mayo Clinic, Rochester, MN, U.S.A.
Keywords: Web, Cancer Patient, Survival, Treatment, Software Tool, Lung Cancer.
Abstract: We describe a software framework designed to shorten the translation of research models from theory to
clinical practice. The framework integrates research and clinical practice into a single software architecture.
Specifically, we present a Survival Probability Predication Architecture (SPPA), which is an extensible
software platform allowing researchers to experiment with their statistical models and make rapid delivery
of these models to clinical practice without a lengthy software development cycle.
1 INTRODUCTION
With personalized medicine, information such as a
patient's genotype, molecular profiles, or clinical
phenotypes is often used to make a decision on
medication, provision of a therapy, or the initiation
of a preventative measure. To make such a decision,
health care teams need to be able to access the most
current treatment plans and adjust their strategies
accordingly and with confidence. One of the key
challenges is to make a quick delivery for such
systems at lower development costs, and allow
greater interdisciplinary collaboration in treating
patients (Tan et al., 2005).
A number of models for predicting cancer survival
have been investigated and published, but few of
them have ever been tested in clinical settings and
even fewer have been used eventually in clinical
practice. They are often developed in a statistical
programming environment, such as R (www.r-
project.org). As a statistical programming
environment is intended to be used in biomedical
research and not for clinical application, a final
software translation is usually required to code the
model into a computer system appropriate for a
clinical setting. Due to costly software development
processes, most of the models remain in literature
and their translation never actually happens.
In this paper, we present a prototype system that
integrates statistical cancer survival prediction
models into web-based applications. The system is
based on web technologies to allow for mobility and
to achieve wide user access. Its information
exchange backbone uses standard-compliant XML
formats, and it is built as a set of multiple standalone
Java applications.
2 USER INTERFACE
Our Lung Cancer Survival Prediction web
application takes as input historical information on
previous patients and specific information about a
current patient. It calculates the current patient’s
survival probability and presents the findings as a
chart and/or a table. To use this web-based tool, the
end user (e.g., a clinician or a data entry person)
enters patient clinical information and then submits
the information. Once the request is received, the
tool initiates statistical model(s) and passes the
inputs to the model(s). After completing the
calculation, the model(s) returns the results to the
tool, and the tool formats and presents the results of
the prediction model, viewable as either a chart or
table. The user can change patient information,
select different treatments, and examine the results
in real-time.
411
Zhang M., Olson S., Francioni J., Gegg-Harrison T., Meng N., Sun Z. and Yang P. (2009).
INTEGRATING R MODELS WITH WEB TECHNOLOGIES.
In Proceedings of the International Conference on Health Informatics, pages 411-415
DOI: 10.5220/0001430104110415
Copyright
c
SciTePress
2.1 Data Input
The system allows for different model(s) for various
cancer types. Even within the same type of cancer,
different models may use different sets of input from
the user. However, we assume all models require
some core inputs from the user. For example, all
models require basic information including patient’s
age, gender, and cancer cell type, stage and grade
when predicting a cancer patient’s survival
probability. Additional information such as the
patient’s smoking status and history for lung cancer,
and the treatments received by the patient could be
used in a specific model to improve prediction
accuracy. All of this information is gathered with the
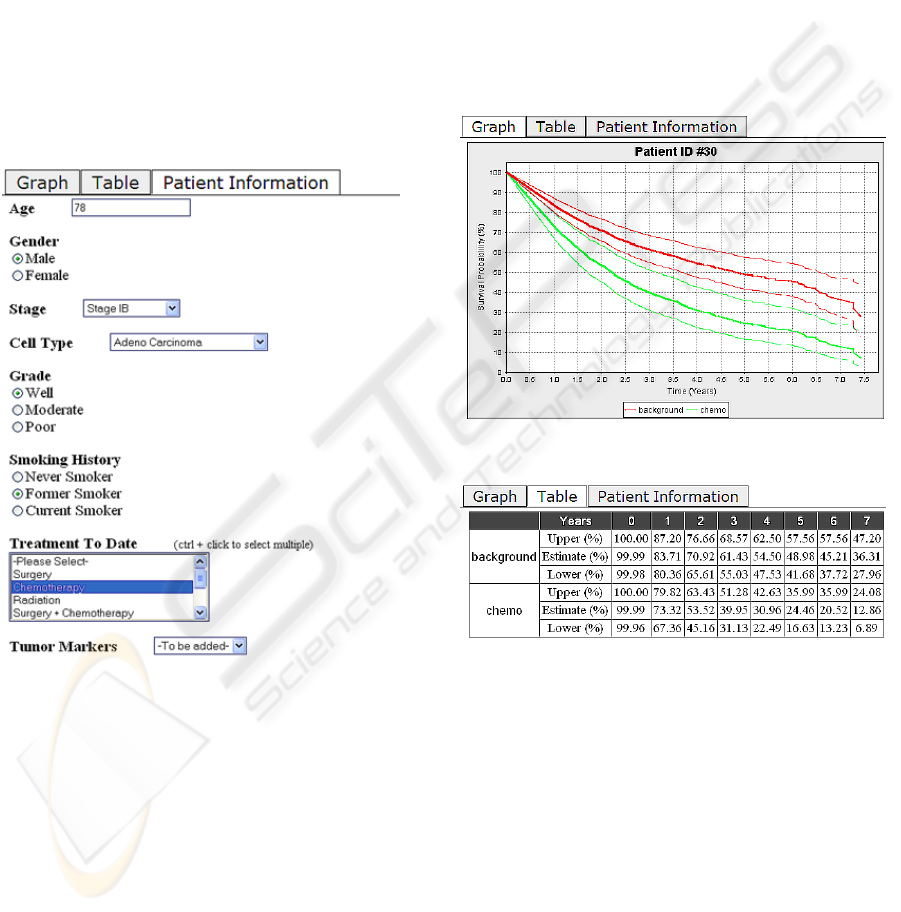
Patient Information Entry Form shown in Figure 1.
Figure 1: Patient Information Entry Form.
The tool is designed to integrate multimodality data,
such as genomic information, to make better
predictions and to aid individual physicians in
providing the best treatment for their patients. As the
models being researched and developed vary from
time to time, data input to the models will change
accordingly. Such changes require the tool to be
adjusted based on the models to be used. As
designed, the researcher can make these changes
directly by adjusting the user interface for his/her
new model without the need to consult a computer
programmer.
2.2 Presentation of the Results
The user interface presents the results of the
statistical model as graphs and tables as shown in
Figures 2 and 3 respectively. At the time a patient is
diagnosed with lung cancer, a clinician would be
able to use the tool to compare the effects of
different treatment options on the patient’s survival
probability. Over time, as the patient receives
specific treatment, more data is generated affecting
his or her survival probability. In deciding further
treatment for the patient, the clinician can use the
tool to investigate treatment options that take this
new data into account.
Figure 2: Graph View of Prediction Results.
Figure 3: Table View of Prediction Results.
3 ARCHITECTURAL DESIGN
Our platform allows researchers to add and remove
statistical models and to make changes to the input
area of the user interface. Table 1 summarizes the
functions that can be performed by researchers,
clinicians, and data entry people. In designing the
architecture of our framework, the guiding principle
was to create an environment that researchers and
diagnosticians could use to experiment with various
diagnostic models and potential treatments without
having to acquire expertise in a computer program-
HEALTHINF 2009 - International Conference on Health Informatics
412
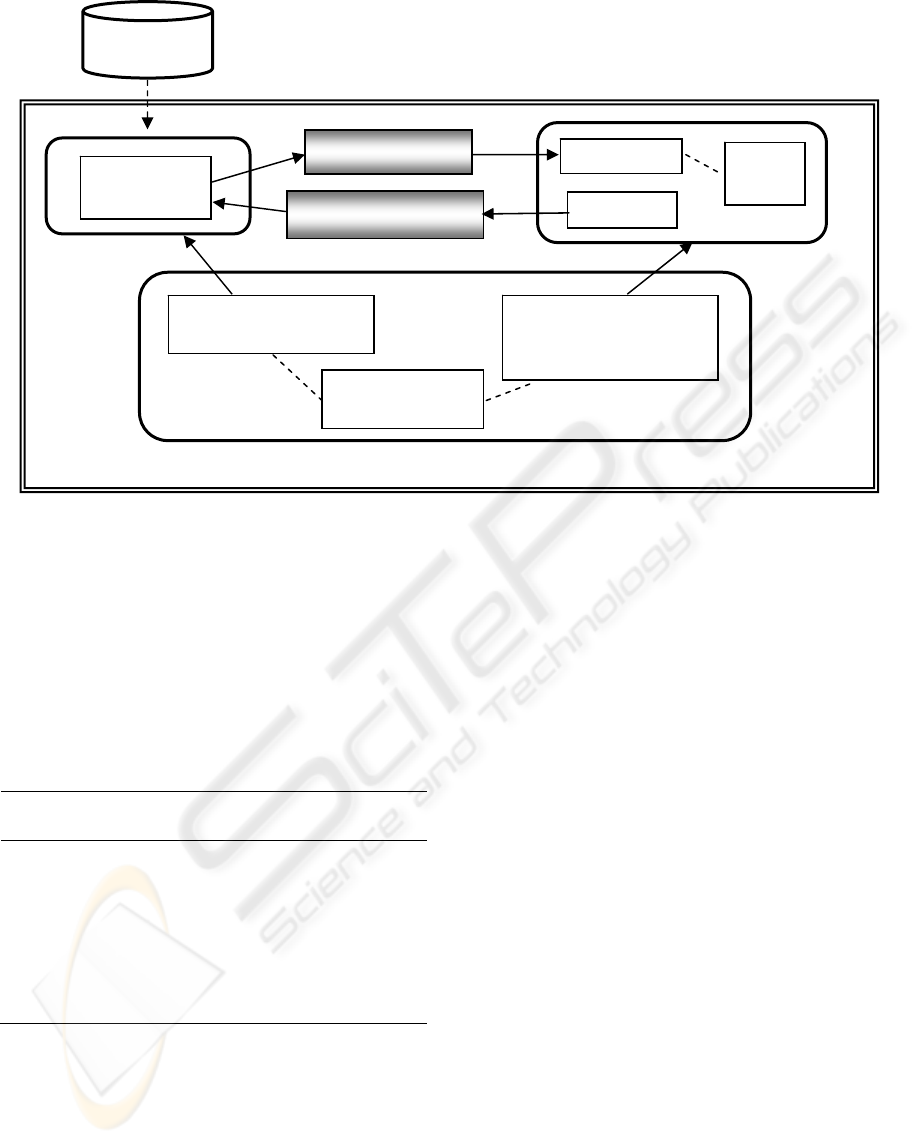
Figure 4: Survival Probability Prediction Architecture.
ming language and environment. The resulting
Survival Probability Prediction Architecture (SPPA)
is designed for experimentation with diagnostic
models and survival prediction. SPPA is based on
the Model-View-Controller architectural pattern, as
shown in Figure 4. It provides both a mechanism for
defining models and a mechanism for testing the
model in a clinical setting.
Table 1: Software Functions Provided to User Groups.
User Group Functions Supported
Researchers
Add and remove prediction
models in R; Change database for
the model; Modify user interface
Clinicians
Add, view, and modify a patient
record; Compare and select
treatments
Data entry person
Add, view, and modify a patient
record
3.1 Controller
The heart of the SPPA is the Controller. The
Controller was designed to be sufficiently general
enough to enable quick and seamless modification of
the system by non-computer specialists. Although
we expect researchers to be proficient in a statistical
programming language like R, we do not expect
them to be proficient in Java. Likewise,
diagnosticians should be able to navigate a web
page, but they should not have to generate one to be
able to view the results of a model.
In order to insulate the researchers and clinicians
from its internals, the Controller is subdivided into
three components: the Model Manager, the View
Manager, and the Variable Definition component.
The Model Manager uses JRI (www.rforge.net/JRI)
to provide an interface between the Java methods of
the Controller and the prediction model, which is
currently written in R. However, the Model Manager
enables researchers to build diagnostic models using
any statistical programming language of their
choice. At present, SPPA only supports statistical
models written in R, but it can be easily modified to
support any statistical modeling language by
extending the Model Manager to provide an
interface between Java and the new statistical
modeling language.
The View Manager is responsible for providing the
researcher and/or the clinician with the results of the
prediction model on a given patient. It consists of
two components: the Web Form Generator and the
Presentation Generator. Information (e.g., age,
gender, etc.) associated with new patients is gathered
through a web page form that is generated by the
Web Form Generator. The Web Form Generator
works with the XML definitions of the Variable
Variable Definition
- XML
R Prediction
Model
Model Manager
- Model Interface (JRI)
View Manager
- Web Form Generator
- Presentation Generator
Presentation
Input Form
Historical
Patient Data
Prediction
Current Patient’s Data
Model
V
iew
CSS
Styles
Controlle
r
INTEGRATING R MODELS WITH WEB TECHNOLOGIES
413

Definition component to dynamically create the web
form.
The glue that connects the Model with the View is
the Variable Definition component. The Variable
Definition component uses XML to define the type
and structure of the inputs that describe the state of
the patient, and defines which models use which
inputs. The XML files are used by both the Model
Manager and the View Manager. The View Manager
uses the XML definitions within the Web Page
Generator to create the Patient Information Entry
Form like the one given in Figure 1. Once the
clinician has completed the form, the inputs that
he/she entered about the patient are passed to the
prediction model via the Model Manager.
3.2 Prediction Model
There are three major components that support the
prediction model. In addition to the prediction model
itself, the Model Manager and Variable Definition
components of the Controller work together to help
researchers and clinicians work with different
prediction models. SPPA was specifically designed
to separate out the functionality of prediction
modeling so as to minimize the type and level of
modifications that are necessary to experiment with
different models.
Obviously, to experiment with different models, the
researcher needs to build a new prediction model. If,
however, the new prediction model is written in R
and uses the same input parameters as the current
prediction model then no additional modifications
are needed. The researcher need merely replace the
current R prediction model with the new one. If, on
the other hand, the researcher needs to add some
additional input parameters then he/she must also
modify the Variable Definition component of the
Controller to define the structure and form of the
new inputs in addition to replacing the current
prediction model with the newly generated one.
It is also possible to build a new prediction model
using a programming language other than R, but
such a change also requires a change to the Model
Manager. JRI serves as an interface between Java
and R. Changing to a different statistical
programming language would require embedding a
Java method that defines an interface between Java
and the new statistical programming language.
The actual prediction models we used in building the
system take inputs describing a given patient (e.g.,
age, gender, stage) along with a suggested treatment
and then predicts the survival probability of the
patient. In our previous work, we analyzed over
5,000 consecutively enrolled non-small cell lung
cancer patients and developed two models for
predicting lung cancer patient’s survival probability
(Sun et. al., 2006). The first model uses patient’s
information available at the time of diagnosis and
has been proven prognostic in our previous work. It
uses age, gender, stage, cell type, and tumour grade
as inputs. The second model uses additional
information, including the treatment options and
patient’s smoking status.
3.3 User View
The user view is controlled by the View Manager as
described above. It is not necessary to change the
Web Form Generator when adding new inputs to the
prediction model. Researchers need only change the
XML definitions in the Variable Definition
component of the Controller without making any
changes to the Web Form Generator. SPPA allows
the researcher to make changes to the inputs to
his/her prediction model without having to make
changes in the Java code. Furthermore, given the
existence of XML editors, researchers can change
XML definitions without a complete understanding
of XML.
The information that is gathered via the web page
form is stored in a file using the format defined by
the XML tags of the Variable Definition component
and then transmitted to the Prediction Model. If the
clinician is dealing with an existing patient, then the
web page form is initially filled in with that patient’s
information. The result of the Prediction Model is a
collection of data that predicts the patient’s
survivability. The Presentation Generator allows the
user to view this data using two different formats: a
graph view and a table view. The graph view of the
data, given in Figure 2, is created with a Java
freeware JFreeChart (www.jfree.org/jfreechart). The
table view, which is obtainable by selecting the
Table tab, is given in Figure 3.
4 CONCLUDING REMARKS
We developed a software framework, the Survival
Probability Prediction Architecture (SPPA), for
translation of research findings into a clinical
application in a timely fashion and at low cost. For
investigators, SPPA helps them to plug in a
HEALTHINF 2009 - International Conference on Health Informatics
414

developed statistical model, adapt a database, and
make their models available for clinical practice. A
coherent presentation of the patient’s information
and the prediction of a cancer patient’s survival
allows a physician to plan, deliver, and evaluate the
most appropriate treatment for the patient.
We compared the results from the first statistical
model with the results produced from SPPA. The
graphs and tables in both cases were virtually
identical. We have also assessed the tool’s
extensibility using the second model with additional
inputs. Variable Definition component was modified
to include the new input variables to be used in the
model, and the server was restarted. SPPA requested
the appropriate inputs for patients for the second
model and generated the correct graphs and tables. A
more comprehensive assessment of SPPA, such as
evaluations on task completion efficiency (Hu et al.,
2007) and the system’s successfulness (DeLone and
McLean, 2003), still needs to be conducted.
As a framework prototype, there are several useful
features that are not yet included in SPPA. The
inclusion of wireless support would allow a larger
variety of mobile devices to access the tool. A
database is another planned addition to the platform
for storing and retrieving patient information. We
would also like our platform to grant different
permissions to the users with authentication.
ACKNOWLEDGEMENTS
This project is partially funded by a grant through
HealthForce Minnesota.
REFERENCES
Delone, W. H. & Mclean, E. R. (2003) The Delone And
Mclean Model Of Information Systems Success: A
Ten-Year Update. J. Manage. Inform. Syst., 19, 9-30.
Hu, P. J.-H., Zeng, D., Chen, H., Larson, C., Chang, W.,
Tseng, C. & Ma, J. (2007) System For Infectious
Disease Information Sharing And Analysis: Design
And Evaluation. Ieee Trans. Information Technology
In Biomedicine, 11, 483-492.
Sun, Z., Aubry, M. C., Deschamps, C., Marks, R. S.,
Okuno, S. H., Williams, B. A., Sugimura, H.,
Pankratz, V. S. & Yang, P. (2006) Histologic Grade Is
An Independent Prognostic Factor For Survival In
Non-Small Cell Lung Cancer: An Analysis Of 5018
Hospital- And 712 Population-Based Cases. J Thorac
Cardiovasc Surg., 131, 1014-1020.
Tan, J., Wen, H. J. & Awad, N. (2005) Health Care And
Services Delivery Systems As Complex Adaptive
Systems. Communications Of The Acm, 48, 36-44.
INTEGRATING R MODELS WITH WEB TECHNOLOGIES
415
