
EVALUATION OF PSD COMPONENTS AND AAR PARAMETERS AS
INPUT FEATURES FOR A SVM CLASSIFIER APPLIED TO A
ROBOTIC WHEELCHAIR
Andr´e Ferreira, Teodiano Freire Bastos-Filho, M´ario Sarcinelli-Filho
Department of Electrical Engineering, Federal University of Espirito Santo, Vit´oria, Brazil
Jos´e Luis Mart´ın S´anchez, Juan Carlos Garc´ıa Garc´ıa, Manuel Mazo Quintas
Department of Electronics, University of Alcala (UAH), Alcal´a de Henares, Spain
Keywords:
Adaptive autoregressive parameters, Power spectral density components, Support-vector machines, Brain-
computer interfaces, Robotic wheelchair.
Abstract:
Two distinct signal features suitable to be used as input to a Support-Vector Machine (SVM) classifier in
an application involving hands motor imagery and the correspondent EEG signal are evaluated in this paper.
Such features are the Power Spectral Density (PSD) components and the Adaptive Autoregressive (AAR)
parameters. Different classification times (CT) and time intervals are evaluated, for the AAR-based and the
PSD-based features, respectively. The best result (an accuracy of 97.1%) is obtained when using PSD com-
ponents, while the AAR parameters generated an accuracy of 94.3%. The results also demonstrate that it is
possible to use only two EEG channels (bipolar configuration around C
3
and C
4
), discarding the bipolar con-
figuration around C
z
. The algorithms were tested with a proprietary EEG data set involving 4 individuals and
with a data set provided by the University of Graz (Austria) as well. The resulting classification system is now
being implemented in a Brain-Computer Interface (BCI) used to guide a robotic wheelchair.
1 INTRODUCTION
A Brain-Computer Interface (BCI) is a system that in-
cludes a way of acquiring the signals generated by the
brain activity, a method/algorithm for decoding such
signals and a subsystem that associates the decoded
pattern to a behavior or action (Sajda et al., 2008).
The BCI and its inherent challenges, involving areas
such as signal processing, machine learning and neu-
rosciences, have been the focus of several important
research groups. The results of this new technology
could be applied to improve the qualityof life of many
people affected by neuromotor disfunctions caused by
diseases, like amyotrophic lateral sclerosis (ALS), or
injuries, like spinal cord injury.
A basic structure of a BCI, according to the previ-
ous definition, is presented in Figure 1. This paper is
related to the phases of feature extraction and feature
translation or classification, both indicated in the fig-
ure. The objective here is to evaluate Power Spectral
Density (PSD) components and Adaptive Autoregres-
sive parameters as inputs for a Support-Vector Ma-
chine (SVM) classifier. The SVM is supposed to be
able to distinguish two mental tasks related to hands
motor imagery, based on these two features extracted
from the EEG signal. Two data sets (a proprietary
one acquired in the University of Alcala and one pro-
vided by the University of Graz) are used to evaluate
the implemented algorithms. Configurations of three
EEG channels (bipolar aroundC
3
, C
z
and C
4
) and two
EEG channels (bipolar around C
3
and C
4
) are tested.
The preliminaries and the results of such evalua-
tion are hereinafter presented as follows: Section 2
contextualizes this work, introducing some previous
works involving a robotic wheelchair commanded by
a BCI; the methodology used to reach the objective
is explained in Section 3, where the feature extraction
and the classifier are described in details. The results
obtained with the two data sets aforementioned and
some comments are presented in Section 4, which is
followed by Section 5, where the main conclusions of
this work are highlighted.
7
Ferreira A., Freire Bastos-Filho T., Sarcinelli-Filho M., Luis Martín Sánchez J., Carlos García García J. and Mazo Quintas M. (2009).
EVALUATION OF PSD COMPONENTS AND AAR PARAMETERS AS INPUT FEATURES FOR A SVM CLASSIFIER APPLIED TO A ROBOTIC
WHEELCHAIR.
In Proceedings of the International Conference on Biomedical Electronics and Devices, pages 7-12
DOI: 10.5220/0001379100070012
Copyright
c
SciTePress
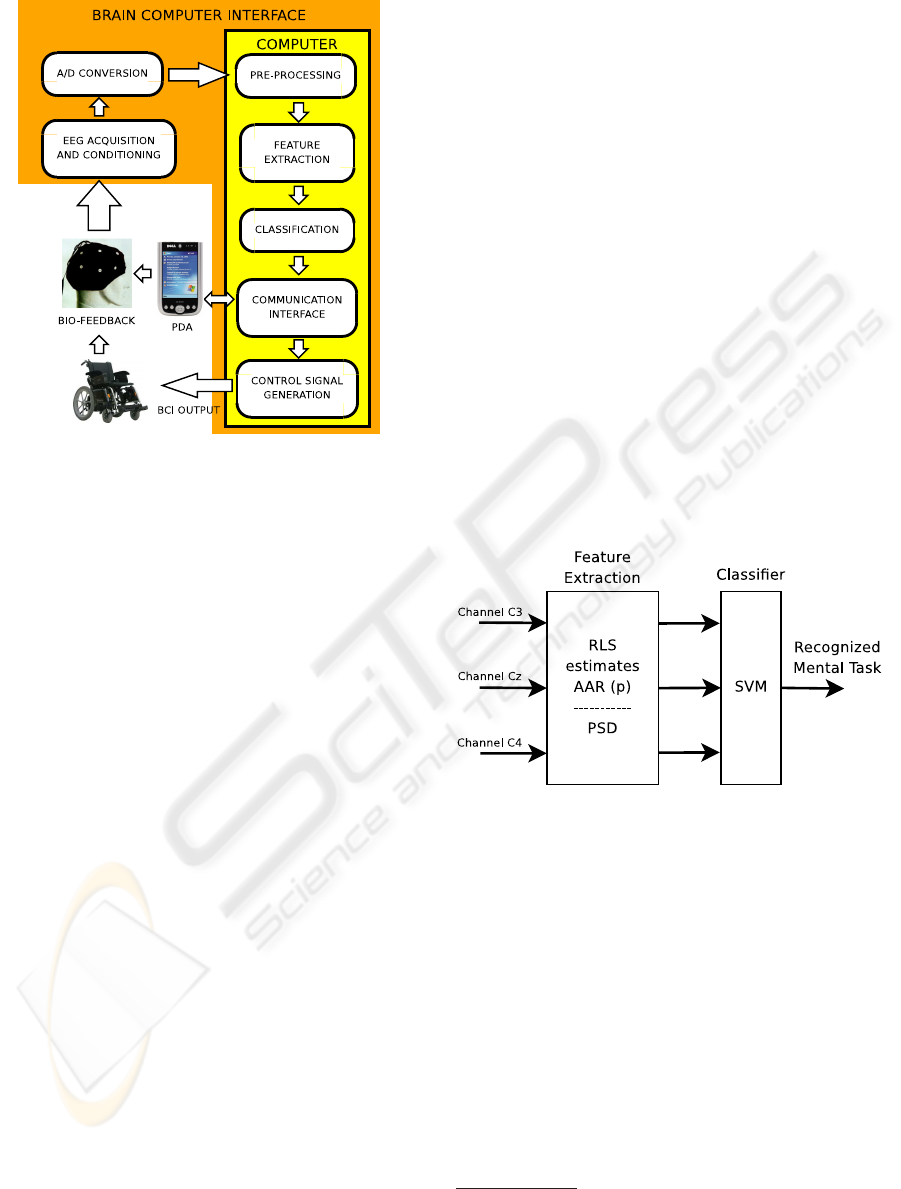
Figure 1: Brain-Computer Interface available at UFES.
2 BACKGROUND
A robotic wheelchair commanded through a BCI is
being developed at the Federal University of Espirito
Santo, Brazil. The users of such BCI can select move-
ments to be executed by the wheelchair from a set of
options presented in the screen of a PDA connected to
the BCI, as illustrated in Figure 1.
A drawback of this approach is the need of eye-
closing to generate the desired pattern, in this case an
ERS (Pons, 2008). An user who is not able to close
the eyes for a while to select an option of movement,
for example, will not get any profit using the current
version of the BCI implemented in the wheelchair. In
order to overcome such problem, other EEG informa-
tion should be used.
In such a context, hands motor imagery is being
tested here, in connection to a SVM-based classifier,
to check the possibility of using this approach to im-
plement a BCI to be used to command the robotic
wheelchair aforementioned. The idea underlying this
study is to use imaginary hand movements, instead of
eye-closing, to generate recognizable EEG patterns.
3 METHOD
The focus of this paper is to evaluate the use of PSD
components and AAR parameters, associated to EEG
signals acquired in the region of the motor cortex of
the human brain, as inputs of a classifier based on a
SVM. The system is supposed to classify two differ-
ent mental tasks related to hands motor imagery, aim-
ing at allowing to implement a BCI to be used to com-
mand a robotic wheelchair (Pons, 2008). In order to
perform such evaluation, the following methodology
was carried out:
1. evaluate two different approaches: PSD-SVM and
AAR/RLS
1
-SVM, according to the sketch of Fig-
ure 2;
2. evaluate different channel configurations:
[C
3
C
z
C
4
] and [C
3
C
4
]
2
;
3. PSD approach: evaluate for different time inter-
vals (3-5s, 4-6s, 5-7s, 6-8s and 7-9s);
4. AAR/RLS approach: evaluate for different Clas-
sification Times (CT) (Schl¨ogl et al., 1997). The
CTs used are 3s, 4s, 5s, 6s, 7s and 8s;
5. evaluate the algorithms using the proprietary
UAH dataset and search for the best configuration
(feature extractor and SVM classifier);
6. apply such configuration to the Graz dataset and
evaluate the results.
Figure 2: A representation of the systems being evaluated.
3.1 Graz Dataset
The Graz dataset was provided by the Department
of Medical Informatics, University of Graz (Austria),
during the BCI Competition 2003. It is named Data
set III and is related to motor imagery. In this pa-
per, 140 trials of this dataset, and the respective la-
bels, were used, 70 related to left hand motor imagery
and 70 related to right hand motor imagery. Each trial
lasts 9 seconds, with a sampling rate of 128 Hz, re-
sulting in 1152 samples/channel/trial. The data was
obtained using a bipolar configuration around the po-
sitions C
3
, C
z
and C
4
, according to the 10-20 Interna-
tional System, as presented in Figure 3. In the same
1
Recursive Least Squares
2
Actually, the channels are bipolar, with electrodes
placed around these positions, as shown in Figure 3
BIODEVICES 2009 - International Conference on Biomedical Electronics and Devices
8
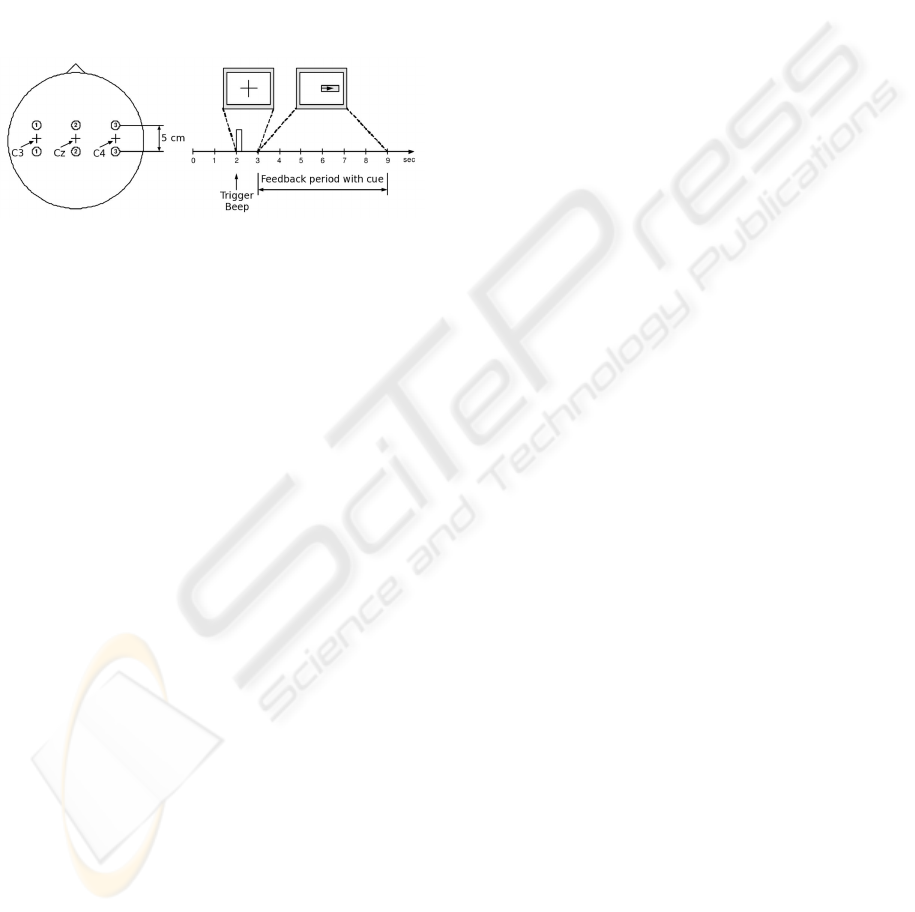
figure (on the right side), an illustration of the proto-
col used during the experimental phase is presented.
After the 2 initial seconds, a beep sounds and a cross
is presented in the center of the screen, calling the
subject’s attention to the beginning of the experiment.
One second later (t = 3 s), an arrow pointing left or
right is presented to the operator, suggesting which
mental task should be accomplished, and lasts for 6
seconds (until t = 9 s). The data was filtered, keep-
ing the spectrum ranging from 0.5 Hz to 30 Hz, and
visual feedback was used (more details can be found
in (Schl¨ogl, 2003)).
Figure 3: Electrodes Placement and the experimental proto-
col associated to the Graz dataset.
3.2 UAH Dataset
Experiments similar to those described in Sec-
tion 3.1 were accomplished at the University of Al-
cala (UAH), Spain. The mental tasks are the same of
the Graz dataset, also related to hands motor imagery.
The dataset was recorded from 4 normal subjects in
different sessions. Each session corresponds to 60 tri-
als (half to each one of the two mental tasks consid-
ered) and each trial was 9 s long, resulting in 9 min-
utes/session. Three subjects participated in 3 sessions
and one subject participates in 4 sessions, thus result-
ing in 780 trials. The bio-signal amplifier g.BSamp
and the subsystem g.16sys compound the g.tec sys-
tem used to record the EEG data, the software being
implemented in Matlab. The data was also filtered to
keep only the spectrum from 0.5 Hz and 30 Hz, but
the volunteer had no visual feedback.
3.3 Feature Extraction: PSD
Due to the fact that EEG rhythms have been de-
fined mainly in the frequency domain, the Power
Spectrum Density (PSD) analysis of the signal is the
non-parametric technique used for feature extraction.
Other reasons that motivate this choice are the com-
putational efficiency involved, the direct relation be-
tween PSD and power, power components can be in-
terpreted in terms of cerebral rhythms and the esti-
mations (via FFT) of spectral components are not bi-
ased as those estimated via AR models, as described
in (Mouri˜no, 2003).
The PSD is estimated here via he Welch’s Method,
computed over sections of 1 s, averaging spectral es-
timates of 3 segments of 0.5 s each (64 samples, sam-
pling rate of 128 Hz) with 50% of overlap between
segments. The maximum size of each segment is im-
portant in order to consider the stationary behavior of
the EEG signal (Mouri˜no, 2003; McEwen and Ander-
son, 1975). A weighting Hanning window is applied
to the signal due to its considerable attenuation in the
side-lobes. The spectral components extracted from
the signal and used as features spans from 8 Hz to
30 Hz, with a frequency resolution of 2 Hz. Thus,
12 components are generated, in connection to each
channel. This feature extraction procedure is illus-
trated in Figure 4.
3.4 Feature Extraction: AAR/RLS
The other technique used for feature extraction is
based on AdaptiveAutoregressive parameters (AAR),
estimated via Recursive Least Squares (RLS) algo-
rithm, as described in (Schl¨ogl et al., 1997; Haykin,
2001). This procedure is performed according to
E
t
= Y
t
− a
T
t−1
Y
t−1
(1)
r
t
= (1−UC)
−1
A
t−1
Y
t−1
(2)
k
t
= r
t
/(Y
T
t−1
r
t
+ 1) (3)
a
t
= a
t−1
+ k
t
E
t
(4)
A
t
= (1−UC)
−1
A
t−1
− k
t
r
T
t
, (5)
where
a
t
= [a
1,t
... a
p,t
]
T
(6)
Y
t−1
= [Y
t−1
...Y
t−p
]
T
. (7)
The initial values adopted were A
0
= I, a
0
= 0
and UC = 0.007, and the model order was chosen as
p = 6. Although the RLS algorithm has a higher com-
putational complexity in comparison with the Least
Mean Squares (LMS), it has some advantages: the
faster convergence, the higher accuracy of the esti-
mate and the fact that no matrix inversion is neces-
sary. Figure 5 shows the temporal evolution of six
AAR parameters. In this case, the channel C
3
of the
first trial included in the Graz dataset was considered.
3.5 Classifier: SVM
Although the concept of Support-Vector Machines
(SVM) was introduced in COLT-92 (Fifth An-
nual Workshop on Computational Learning Theory)
(Boser et al., 1992), its evaluation in BCIs is quite re-
cent.
Briefly speaking, the main idea of a SVM is to
find an optimal separating hyperplane for a given fea-
ture set. Given a training set of instance-label pairs
EVALUATION OF PSD COMPONENTS AND AAR PARAMETERS AS INPUT FEATURES FOR A SVM
CLASSIFIER APPLIED TO A ROBOTIC WHEELCHAIR
9
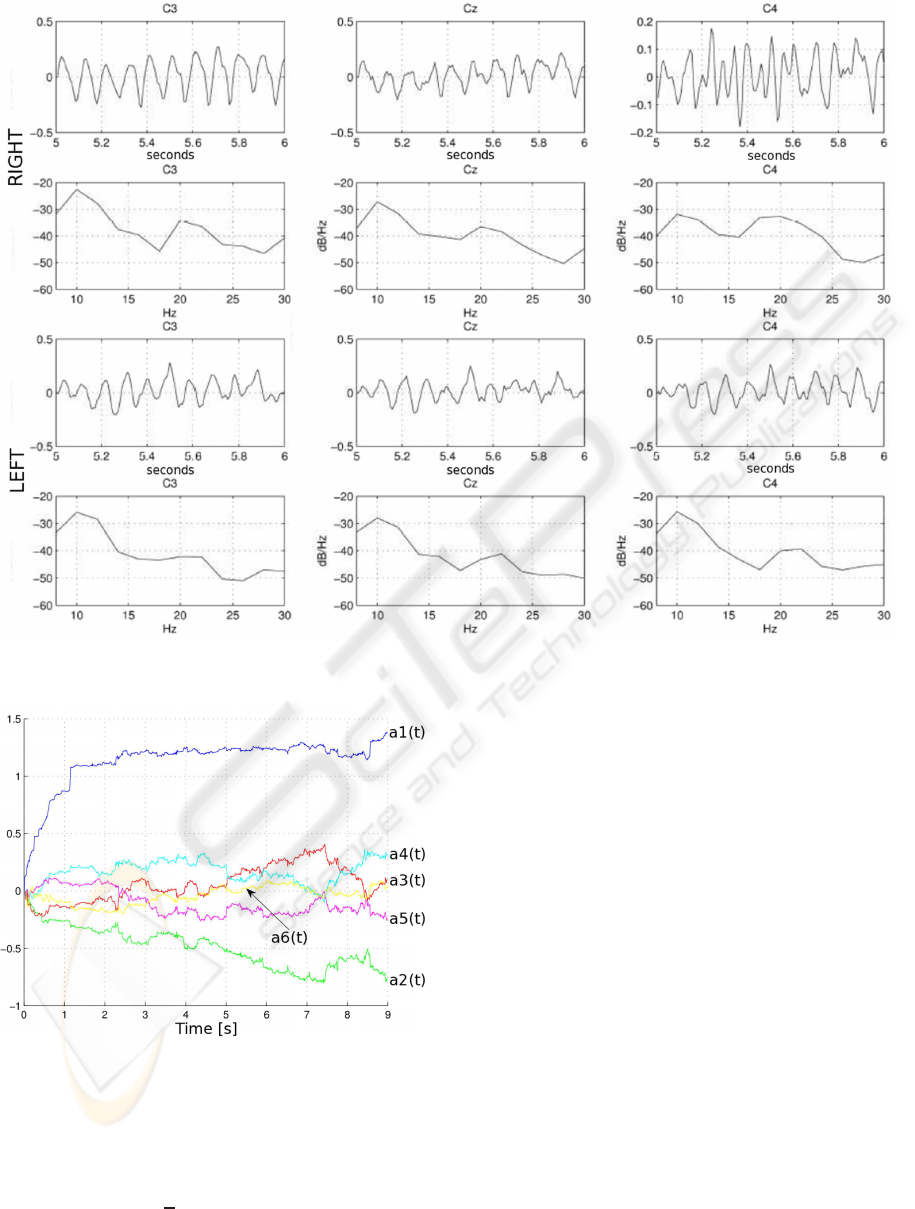
Figure 4: Example of feature extraction using PSD components. Signals related toC
3
,C
z
andC
4
(bipolar) during hands motor
imagery. PSD is presented from 8 up to 30 Hz in dB/Hz.
Figure 5: Temporal evolution of six AAR parameters.
(x
i
,y
i
),i = 1,... ,l, where x
i
∈ R
n
and y ∈ {1, −1}
l
,
the SVM requires the solution of the optimization
problem
min
w,b,ξ
1
2
w
T
w+C
l
∑
i=1
ξ
i
, (8)
subject to
y
i
(w
T
φ(x
i
) + b) ≥ 1 − ξ
i
(9)
ξ
i
≥ 0. (10)
Training vectors x
i
are mapped into a higher di-
mensional space (maybe infinite) by the function φ.
The SVM finds a linear separating hyperplane with
the maximal margin in this higher dimensional space.
C > 0 is the penalty parameter of the error term. The
function K(x
i
,x
j
) ≡ φ(x
i
)
T
φ(x
j
) is called kernel. The
kernel function used in this paper is a Radial Basis
Function (RBF) defined as
K(x
i
,x
j
) = exp(−γkx
i
− x
j
)k
2
),γ > 0. (11)
The choice of a SVM-based classifier and a RBF
kernel function relies on previous works that consid-
ered this configuration (Shoker et al., 2005; Guler
and Ubeyli, 2007; Khachab et al., 2007). Further-
more, a SVM classifier has improved the accuracy
in 13% when compared to LDA (Linear Discriminant
Analysis) and 16.3% when compared to NN (Neural
Networks), using the same features (Nicolaou et al.,
2008).
BIODEVICES 2009 - International Conference on Biomedical Electronics and Devices
10
Table 1: PSD + SVM (UAH dataset).
2 channels (C
3
C
4
) 3 channels (C
3
C
z
C
4
)
Subject 3-5s 4-6s 5-7s 6-8s 7-9s 3-5s 4-6s 5-7s 6-8s 7-9s
S
01
71.1 71.1 73.3 73.3 66.7 73.3 80.0 66.7 75.6 64.4
S
02
68.7 80.0 73.3 73.3 71.1 75.6 75.6 73.3 73.3 66.7
S
03
68.3 76.7 66.7 66.7 66.7 68.3 70.0 66.7 65.0 70.0
S
04
75.6 91.1 82.2 84.4 84.4 73.3 86.7 82.2 84.4 75.6
Table 2: AAR/RLS + SVM (UAH dataset).
2 channels (C
3
C
4
) 3 channels (C
3
C
z
C
4
)
Subject 3s 4s 5s 6s 7s 8s 3s 4s 5s 6s 7s 8s
S
01
66.7 73.3 66.7 68.9 62.2 73.3 66.7 73.3 64.4 66.7 71.1 66.7
S
02
66.7 68.9 66.7 80.0 57.8 57.8 68.9 68.9 64.4 73.3 64.4 64.4
S
03
60.0 66.7 73.3 61.7 66.7 73.3 58.3 61.7 68.3 66.7 65.0 70.0
S
04
66.7 71.1 86.7 82.2 75.6 73.3 66.7 73.3 86.7 77.8 71.1 75.5
Table 3: PSD + SVM (Graz dataset).
2 channels (C
3
C
4
) 3 channels (C
3
C
z
C
4
)
Subject 3-5s 4-6s 5-7s 6-8s 7-9s 3-5s 4-6s 5-7s 6-8s 7-9s
S
Graz
88.6 97.1 85.7 74.3 77.1 85.7 94.3 85.7 80.0 71.4
Table 4: AAR/RLS + SVM (Graz dataset).
2 channels (C
3
C
4
) 3 channels (C
3
C
z
C
4
)
Subject 3s 4s 5s 6s 7s 8s 3s 4s 5s 6s 7s 8s
S
Graz
65.7 74.3 91.4 91.4 82.9 80.0 74.3 68.6 91.4 91.4 80.0 80.0
The scripts developed during this work are based
on the library libsvm (Chang and Lin, 2001).
4 RESULTS
Taking into account the data distribution, 75% of each
dataset was used for training and validation, while
the other 25% were used for test. After evaluating
two different techniques for feature extraction (based
on PSD components and AAR parameters), the re-
sults are presented in the following four tables. The
first one (Table 1) shows the classification accuracy
obtained for each subject of the UAH dataset, when
PSD+SVM is used. The gray cells represents the
best classification accuracy found for each subject.
The higher values are related to the central period of
the experiment (4-6s) and, except by the subject S
01
,
these values are obtained with only two channels.
Table 2 contains the results for the other explored
configuration (AAR/RLS+SVM). Four subjects of the
UAH dataset are evaluated using different CTs and
channel configuration. Once more, the gray cells rep-
resents the best classification values for each subject
during the test. Equal values are all highlighted (gray
cells) to show in which situations they can appear. As
in PSD case, the higher classification rates are related
to the middle of the experiment (Table 1 and Table 2
(4-6s)). The best results can also be reached with only
2 channels, taking into account that all the high values
obtained with 3 channels appear on the left side of the
Table 2 (2 channels).
Thus, the best results with the UAH dataset can be
found using PSD+SVM, 2 channels (C
3
C
4
) and in the
middle of the experiment. A summary of the results
is presented in Table 5.
Table 5: Best Results (UAH dataset).
Subject Accuracy Configuration
S
01
80.0 PSD+SVM,C
3
C
z
C
4
,4-6s
S
02
80.0 PSD+SVM,C
3
C
4
,4-6s
S
03
76.7 PSD+SVM,C
3
C
4
,4-6s
S
04
91.1 PSD+SVM,C
3
C
4
,4-6s
As the next step of the proposed methodology, this
configuration was applied to the Graz dataset, in order
to evaluate it. The results obtained for this configura-
tion and the other are shown in Tables 3 e 4.
EVALUATION OF PSD COMPONENTS AND AAR PARAMETERS AS INPUT FEATURES FOR A SVM
CLASSIFIER APPLIED TO A ROBOTIC WHEELCHAIR
11

5 CONCLUSIONS
This paper evaluates the use of two set of features
(PSD components and AAR/RLS parameters of an
EEG signal) as inputs for a SVM classifier, in order to
distinguish between two mental tasks related to hands
motor imagery.
The approach based on PSD (Welch’s Method)
components and a SVM (RBF kernel) generated the
best results. The highest classification rates are re-
lated to the middle of the experiment, usually be-
tween seconds 4 and 6. It can be explained taking
into account that the subject needs some time to setup
him/herself (the cue, an arrow, is presented to the sub-
ject at instant t = 3 s) to the end of the trial (the trial
finishes at t = 9 s).
The best results can be accomplished using only
2 channels, four electrodes placed around positions
[C
3
C
4
] of the 10-20 International System.
After evaluating the system with the UAH dataset,
the algorithms were applied to the Graz dataset and
the best classification rate (accuracy) was 97.1%
(99.4% to mental task 1 and 93.5% to mental task 2).
The replacement of the method currently used to
select a symbol in a PDA, which requires a brief eye-
closing, by another based on motor imagery, such as
the one here discussed, is the next step of our research.
In other words, the idea is that motor imagery of a
hand (the one with higher accuracy) it is enough to
the user without eyes control to select desired symbols
in the PDA that will be translated into commands to
the robotic wheelchair or into some communication
outputs, also available in this system.
ACKNOWLEDGEMENTS
The authors thank CAPES, a foundation of the
Brazilian Ministry of Education (Project 150/07),
and FACITEC/PMV, a fund of the Vitoria City Hall
to support scientific and technological development
(Process 061/2007), for their financial support to this
research.
REFERENCES
Boser, B. E., Guyon, I. M., and Vapnik, V. N. (1992). A
training algorithm for optimal margin classifiers. In
COLT’92: Proceedings of the Fifth Annual Workshop
on Computational Learning Theory, pages 144–152,
New York, USA.
Chang, C.-C. and Lin, C.-J. (2001). LIBSVM: a library for
support vector machines. Software available at
http:
//www.csie.ntu.edu.tw/
˜
cjlin/libsvm
.
Guler, I. and Ubeyli, E. (2007). Multiclass support vector
machines for EEG-signals classification. 11(2):117–
126.
Haykin, S. (2001). Adaptive Filter Theory (4th Edition).
Prentice Hall.
Khachab, M., Kaakour, S., and Mokbel, C. (2007). Brain
imaging and support vector machines for brain com-
puter interface. In Proc. 4th IEEE International Sym-
posium on Biomedical Imaging: From Nano to Macro
ISBI 2007, pages 1032–1035.
McEwen, J. A. and Anderson, G. B. (1975). Modeling the
stationarity and gaussianity of spontaneous electroen-
cephalographic activity. (5):361–369.
Mouri˜no, J. (2003). EEG-based Analysis for the Design
of Adaptive Brain Interfaces. PhD thesis, Universitat
Polit`ecnica de Catalunya, Barcelona, Spain.
Nicolaou, N., Georgeou, J., and Polycarpou, M. (2008).
Autoregressive features for a thought-to-speech con-
verter. In Proceedings of the International Conference
on Biomedical Electronics and Devices - BIODE-
VICES 2008, pages 11–16, Funchal, Portugal.
Pons, J. L. (2008). Wearable Robots: Biomechatronic Ex-
oskeletons (1st Edition). Wiley, Madrid, Spain.
Sajda, P., Muller, K.-R., and Shenoy, K. (2008). Brain-
computer interfaces [from the guest editors]. Signal
Processing Magazine, IEEE, 25(1):16–17.
Schl¨ogl, A. (2003). Data set: BCI-experiment.
http://ida.first.fraunhofer.de/projects/
bci/competition\_ii
.
Schl¨ogl, A., Neuper, C., and Pfurtscheller, G. (1997). Sub-
ject specific EEG patterns during motor imaginary
[sic.: for imaginary read imagery]. In Neuper, C., edi-
tor, Proc. 19th Annual International Conference of the
IEEE Engineering in Medicine and Biology society,
volume 4, pages 1530–1532.
Shoker, L., Sanei, S., and Sumich, A. (2005). Distin-
guishing between left and right finger movement from
EEG using svm. In Sanei, S., editor, Proc. 27th
Annual International Conference of the Engineering
in Medicine and Biology Society IEEE-EMBS 2005,
pages 5420–5423.
BIODEVICES 2009 - International Conference on Biomedical Electronics and Devices
12
