
DATA VISUALIZATION IN A PERSONAL HEALTH RECORD
USING RICH INTERNET APPLICATION GRAPHIC
COMPONENTS
Francois Andry, Goutham Naval, Daren Nicholson, Michelle Lee
Igor Kosoy and Liliya Puzankov
InterComponentWare Inc., One Waters Park Drive – Suite 280, San Mateo, CA 94403, U.S.A.
Keywords: Personal Health Record, Medical Data Visualization, Internet, Web Application, Graphs, RIA, GUI.
Abstract: Patients with chronic diseases such as diabetes have to monitor complex sets of medical observations and
behaviors. This includes blood glucose, weight, cholesterol, HbA1c, blood pressure, as well as diet,
exercise and medication. We have developed a set of web-based, highly interactive graphic modules that are
integrated in a personal health record to provide an easy and pleasant way for patients to browse through
their historical data. By using a Web 2.0 framework with technologies such as AJAX and Flash/Flex,
coupled with a mechanism of loading data on demand, we minimized the amount of data passed between
the server and the browser and we were able to build a highly interactive and responsive graphic user
interface that displays two-dimensional graphs for diabetic patients. As a result, the patients are using their
personal health record on a daily basis, resulting in a more accurate, complete and useful application.
1 INTRODUCTION
Chronic diseases requiring repetitive tests and
procedures often result in the collection of large
amounts of medical observations and data over a
long period of time.
In recent years, web-based Personal Health
Records (PHRs) have been providing a way to store,
display and share medical observations. These
applications can be very useful not only for the
patient and their caregivers, but also for their
relatives/friends to monitor and communicate
important health information (Ralston et al. 2004)
(Lowes R. 2006).
Studies have shown that, when patients are
provided with proper tools that promote
involvement, empowerment and active management
of their illnesses, better results can be observed in
both health status and clinical outcomes (Stroetmann
and Pieper 2003).
Presentation of medical data to internet patient
users via a web application can be a challenging
task, especially for users with little or no medical
background (AHIMA 2005). While it is important to
provide as much relevant medical information as
possible to the users, it is crucial to keep the
application interface simple, easy to use and
appealing (AJMQ 2006), so the users keep using it
on a regular basis (Hassol et al. 2004). A PHR will
also be valuable if it provides instant feedback on
health conditions as well as improve personal
satisfaction (Andry et al. 2008).
In this paper, we describe how we have designed
and implemented a set of rich internet graphic
components and integrated them into the LifeSensor
personal health record for patients with type 2
diabetes.
2 DATA COMPLEXITY
2.1 Tracking Observations
Diabetes is a chronic disease that requires long-term
monitoring and treatment. Medical observations
such as weight, cholesterol and HbA1c have to be
measured on a regular basis, some of them (blood
pressure, blood glucose) up to several times a day. In
addition to this, it is important for the patient to keep
track of their medications, diet, exercise and skin
condition to avoid complications. A regular and
111
Andry F., Naval G., Nicholson D., Lee M., Kosoy I. and Puzankov L. (2009).
DATA VISUALIZATION IN A PERSONAL HEALTH RECORD USING RICH INTERNET APPLICATION GRAPHIC COMPONENTS.
In Proceedings of the International Conference on Health Informatics, pages 111-116
DOI: 10.5220/0001378801110116
Copyright
c
SciTePress
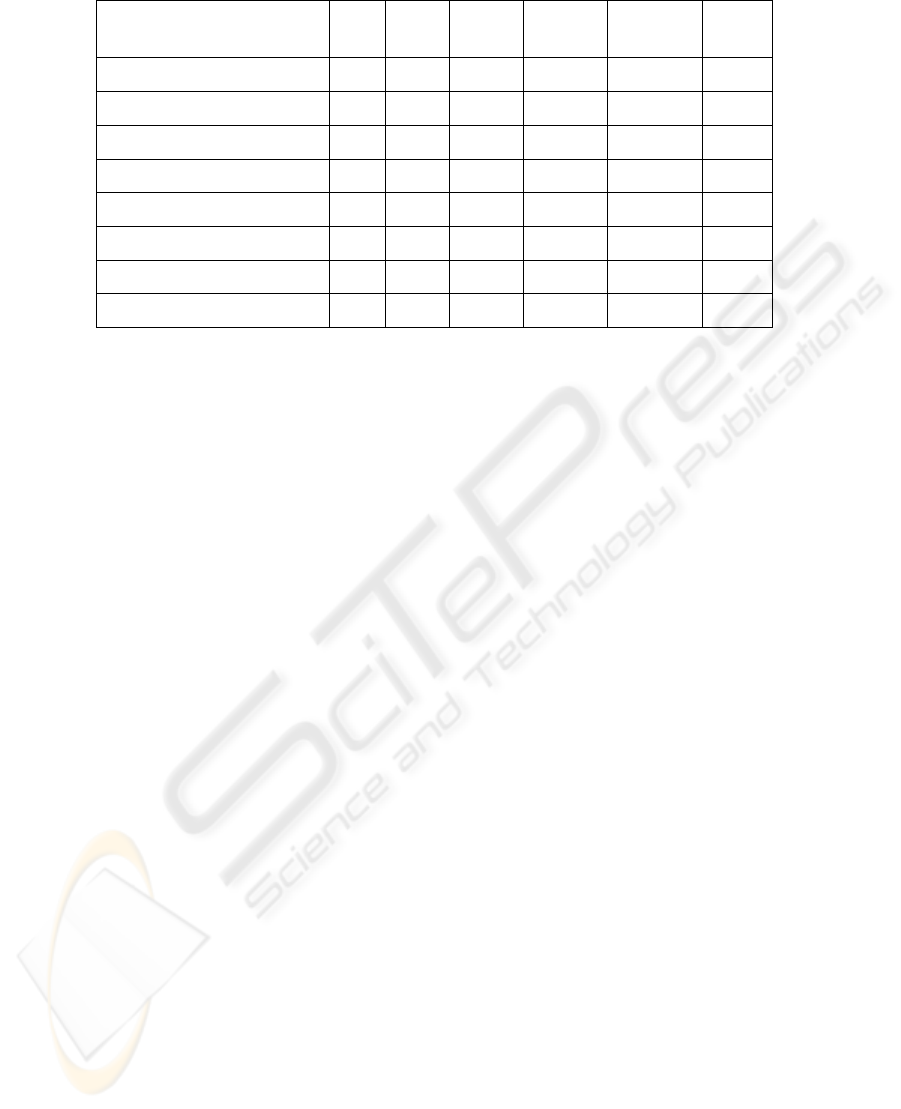
Table 1: Granularity of Health Related Observations for a Diabetic Patient.
1 day 7 days 30 days 12 weeks 12 months 3 years
Blood Glucose
Weight
Exercise
Diet
Medication
Cholesterol
HbA1c
Blood Pressure & Heart Rate
systematic recording of these vital signs, conditions
and behaviours are even more important for patients
that have a combination of multiple chronic diseases
(diabetes, coronary heart disease, arthritis, asthma,
kidney and/or heart conditions, etc.).
Graphs and charts are visual representations of
numerical or spatial data. Health related
observations are well suited to graphs, however
designing graphs that are easy to read and interpret
is not trivial (Cleveland and R. McGill 1985).
Certain principles can be applied when creating
graphs:
Data should stand out from the rest of the graph
(e.g. not mixed with labels).
Reduce clutter on the graph (e.g. avoid too
many tick marks).
Overlapping symbols or lines must be optional
and easily recognized
A common property of medical observations, and
the patient behaviour we want to capture, is that they
are associated with a time stamp (a specific date and
time), and hence can be all represented along a
common time axis. This makes comparison and
correlation between observations easier. For
example, by comparing an exercise or a diet chart
alongside the blood glucose chart, the user can see
the benefit of exercising or dieting to better control
blood glucose. Moreover, by using a common
generic observation object representation, we
facilitated the storage, transmission and
manipulation of these observations.
2.2 Granularity of Observations
The frequency of health related observations for a
diabetic patient is not identical for each type of
observation (e.g. blood glucose has to be determined
several times a day, whereas cholesterol or HbA1c
analysis are done only few times a year). As a
result, it is important to display certain observations
with a very granular time frame (e.g. daily blood
glucose results before and after each meal) and only
display other types of results over a longer period of
time (Table 1).
In addition, observations do not have the same
types of values, so we separated them into two
different groups and represent them by two different
types of graphs:
Health Targets (blood glucose, weight,
cholesterol, HbA1c, blood pressure, heart rate)
These observations have a specific value and
unit (mg/dL, kg, etc) associated to them. We
represent them with 2D line charts and candle
-like charts for average values views.
Activities (exercise, diet, medication)
We have rated these observations using
ordinal values such as poor, fair, good, or very
good. We used histograms for their
representation.
3 PHR DATA MANAGEMENT
3.1 Add-on to LifeSensor PHR
The graphic visualization components we developed
to display the patient observations were integrated
into the diabetes module of InterComponentWare’s
(ICW) personal health record (PHR), branded as
LifeSensor. This PHR is a layered, multi-tier web
application accessible by a web browser, a set of
HEALTHINF 2009 - International Conference on Health Informatics
112
web-services or a software development kit (SDK).
The patient observations are acquired and
managed either by the general PHR health record
application (e.g. weight, height) or by the specific
diabetes module add-on (e.g. blood glucose).
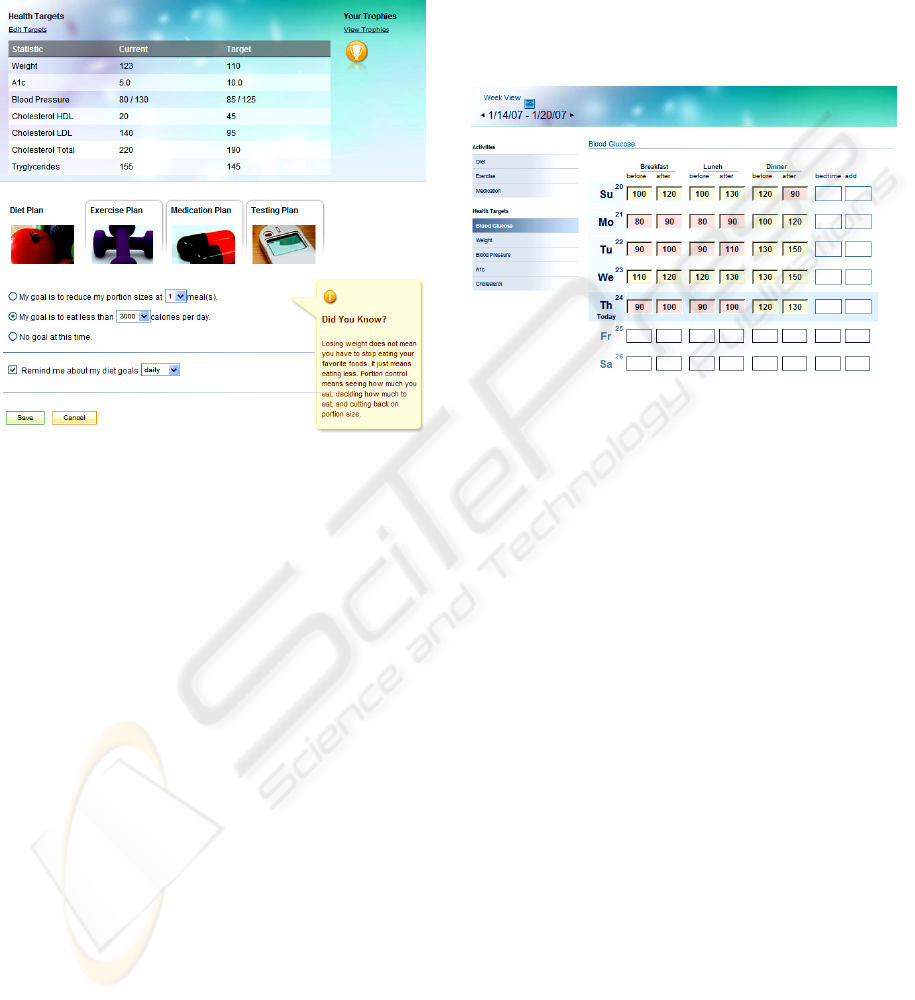
Figure 1: Health targets overview in LifeSensor Diabetes.
The diabetes module of LifeSensor is specifically
designed to optimize data acquisition (Andry et al.
2008). It also offer overviews (Figure 1) of vital
signs and critical observations together with
motivation information—goal progress and action
plans pertaining to important disease management
issues—that can be a starting point to drill down to
specific historical data visualization.
A log section is used to enter and update
measurements (e.g. self-monitored blood glucose
levels and blood pressure readings). The log section
uses Web 2.0 technology such as Asynchronous
Javascript and XML (AJAX). The data input is
facilitated by dynamically offered tips and
recommended default values from professional
associations such as the American Diabetes
Association. This validation of the observations is
done immediately field by field with no need to
submit the entire page. Also, each observation field
is immediately assigned a color background (green
or red) to indicate that the observation is within an
acceptable value range. The log section uses Web
2.0 technology such as Asynchronous JavaScript and
XML (AJAX).
The log section offer overviews (Figure 2) of the
vital signs and most critical observations together
with motivation information, goal progress and
action plans pertaining to important disease
management issues that can be a starting point to
drill down to specific historical data visualization
Improvements in patient observation acquisition
would include auto-completion functionality for
certain data entry fields and the aggregation of data
using LifeSensor device integration support.
Figure 2: Log section in LifeSensor Diabetes.
Using either the LifeSensor SDK or ICW’s Tele-
monitoring solution, it is possible also to
automatically import observations from various
medical devices (glucometers, arm blood pressure
monitors, weight scales, etc). The data can also be
exported to Care and Disease Management systems
(CDM) to be used by the physicians and nurses.
4 ARCHITECTURE
4.1 Data Visualization Architecture
Requirements
Navigating through a large amount of data using a
web browser can be difficult. Since the data resides
on the server, it is important to minimize the
exchange of data between the server and the browser
in order to maintain good application performance
and to continue to offer a good user experience. A
combination of techniques such as caching and
dynamic data upload can be used at runtime to solve
this problem.
In addition to this, it is better to try to render the
graphic views/images on the client than sending
large images across the network between the server
and the client.
DATA VISUALIZATION IN A PERSONAL HEALTH RECORD USING RICH INTERNET APPLICATION GRAPHIC
COMPONENTS
113
The architectural requirement was to design a graph
container that provided the ability to:
• Parse the data on client side and render
graphic view, rather than sending large
processed images across the network between
server and the client.
• Minimize the exchange of data between the
server and the browser in order to maintain a
good performance
• Easily add, remove or modify a particular
data visualization module,
• Provide features at runtime to offer pluggable
rules to compare data between observation
types,
• Easily customizable
• Minimize the footprint of the application in
the browser
By using a combination of Web 2.0 technologies
such as HttpService calls to fetch raw data on
demand from the server in JSON format (a
technique very similar to AJAX), and Flash/Flex
graphic components on the client, we managed to
make web pages feel more responsive. Most of the
processing necessary to render the graphic user
interface is done on the client in the Flash player.
4.2 Modularization
We have created a generic graph container module
that has the ability to load and unload modules from
the server based on the context of the data
visualization and the need of the user. A set of eight
modules (Exercise, Diet, Medication, Blood
Glucose, Weight, Cholesterol, HbA1c, Blood
Pressure/Heart Rate) can be dragged and dropped
into a visualization zone where two graphs can be
displayed and synchronized on the time axis.
Another advantage of such modularization is that
the components can be repackaged easily in other
web containers/applications. In fact, some of the
modules have been re-packaged as widgets and
portlets.
4.3 Integration with LifeSensor
The graph container (Flex application) acts as a data
controller. It requests data from PHR LifeSensor
either when a new graphic module (Flex module) is
loaded, or when the user navigates beyond the
default data ‘tiled’ time span for each module. The
default data time span is typically a couple of
months of data before and after the date cursor used
for data browsing. Initially the current date cursor of
a loaded module is the current day and time.
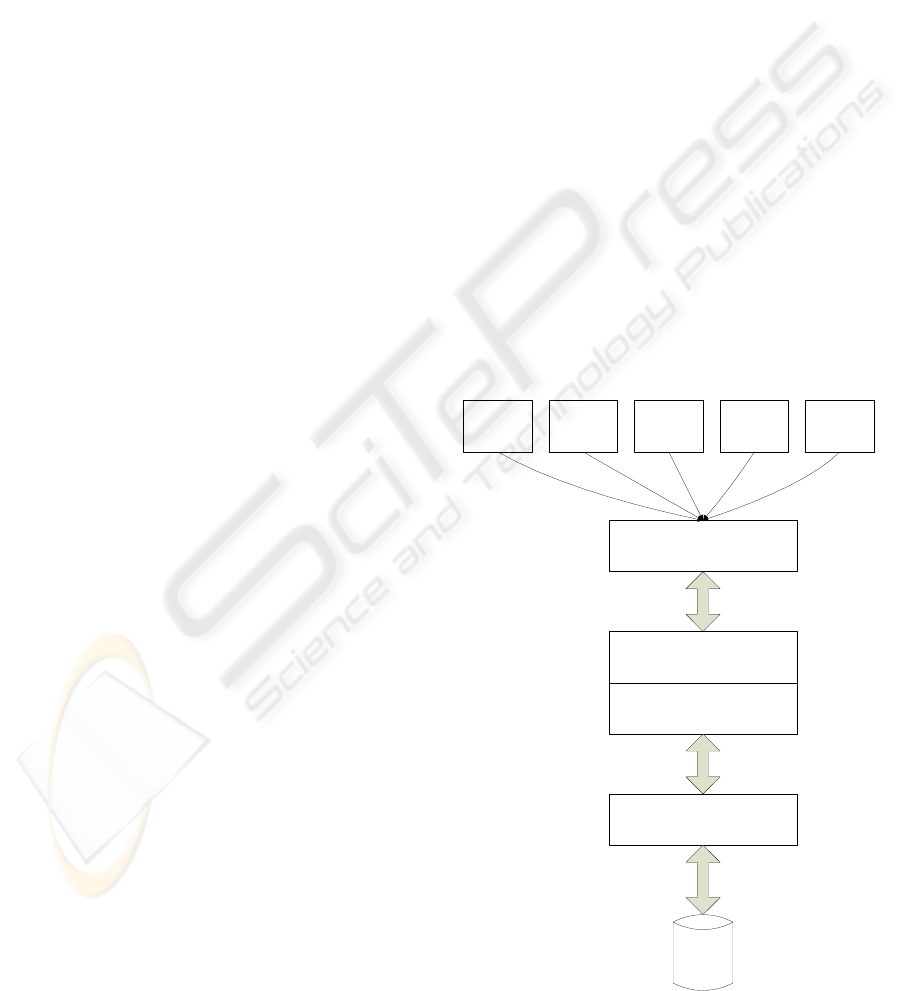
A java servlet in LifeSensor answers
HTTPService calls from the Flex graph container
and supplies very compact JSON formatted data
including a combination of a key and value for the
observation, time stamp, as well as target and
standard values for the observations (optionally
shown as overlays on the graph). The data is then
sent to an observation filter to extract the values
necessary for the current graph (Figure 3).
4.4 User Interaction
The Flex modules are embedded into the statistic tab
of the diabetes component (JSF/HTML) with the
same look and feel as the rest of the page
augmenting the application with highly interactive
features. Each graph has a horizontal axis
representing a specific time period, from a single
day to several years. The graphs also have one or
two vertical axes to show a combination of data
results. Graphs such as cholesterol test results, blood
glucose values, and hemoglobin A1c percentage use
only a single y-axis. Multiple y-axes are used to
display data pairings such as weight and body mass
index or blood pressure and heart rate.
The user can also decide to dynamically overlay
Blood Glucose
Graph Module
Blood Pressure
Graph Module
Diet Graph
Module
Exercise Graph
Module
Graph Container
LifeSensor PHR
ICW open eHealthFramework
HTTPService/JSON
oeHF framework API
...
LifeSensor Diabetes
Data
Storage
Figure 3: Module integration with LifeSensor.
HEALTHINF 2009 - International Conference on Health Informatics
114
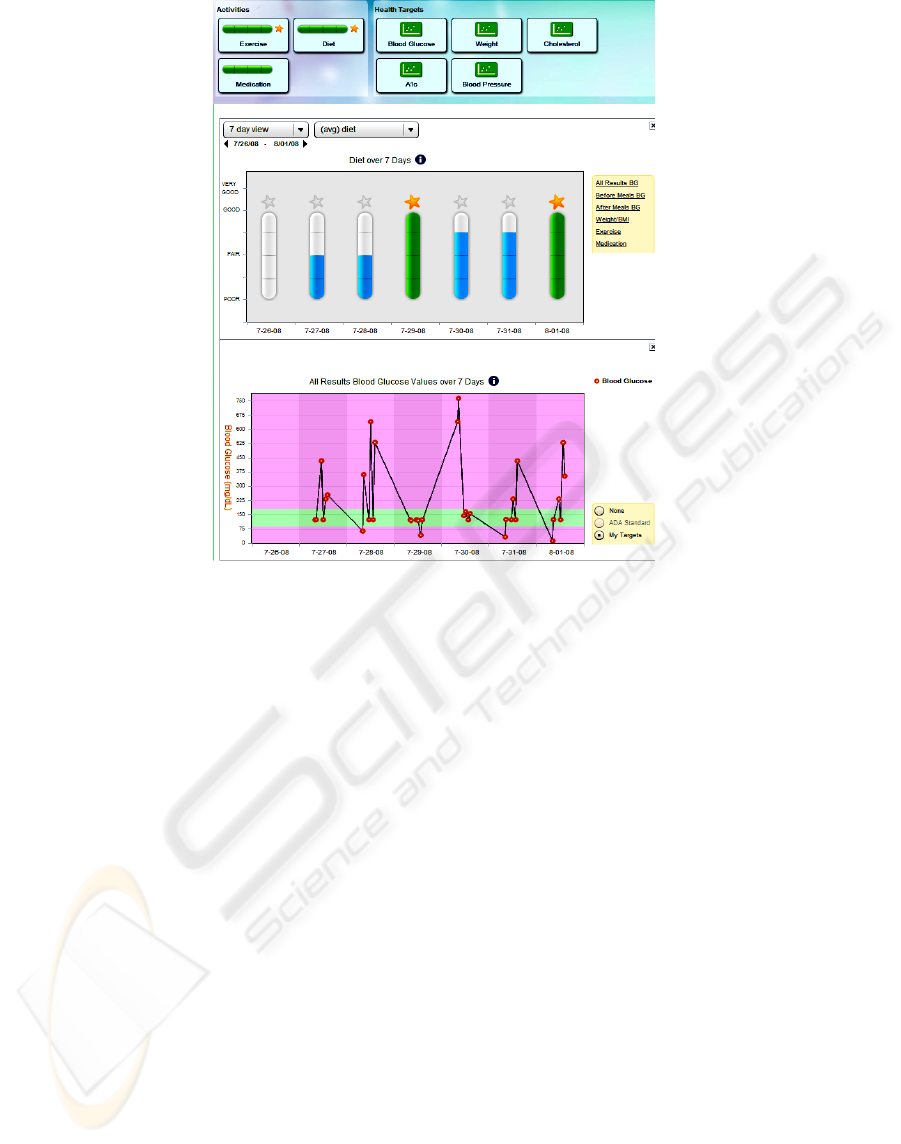
Figure 4: Synchronization between Diet and Blood glucose graphs.
"normal" ranges. These "normal" ranges are either
specified by the user or recommended by health
experts such as the American Diabetes Association.
Dynamic tool-tips are used to provide contextual
help and to reveal detailed data.
The user can very easily navigate to a specific
date by clicking on the previous or next date period
span displayed above the top. If the viewing area
contains two graphs, both graphs will be modified
and synchronized (Figures 4). This will also happen
when the user chooses a different time period (1 day,
7 days, 30 days, etc).
The associated graph at the bottom of the
viewing area can also be removed or replaced based
on the result of the user choice (Figure 5).
The Flex graphic rendering is a vector-based
format that makes the look and feel more
professional and portable across various client
platforms.
4.5 Toolset and Platform
The LifeSensor PHR itself is built upon the ICW
eHealth Framework. This framework provides
lower-level infrastructure modules and libraries
conforming to HL7 and other standards. The
framework enables health application developers to
build interoperable, cutting-edge web applications.
The Framework is based on proven open source
technologies and tools such as AJAX, FLEX, JSF,
Java Enterprise, Spring, Hibernate, Maven and
Eclipse.
Parts of this proprietary framework have been
released as open source software in the Open
eHealth Foundation (OeHF) established by ICW,
SUN Microsystems, and Agfa HealthCare at
HIMSS08.
5 CONCLUSIONS
Data visualization in a Personal Health Record
should be complete and precise, but simple enough
not to overwhelm the user with information.
The use of Web 2.0 technologies makes the
graphic user interface more interactive, appealing
and pleasant to use. Performance is also crucial in
order to offer a pleasant user experience. This allows
the patient to display personalized information based
on his or her specific conditions and helps track
medical observations.
The ability to navigate through historical data
with various level of granularity is a powerful tool
for communication between the patient and his/her
DATA VISUALIZATION IN A PERSONAL HEALTH RECORD USING RICH INTERNET APPLICATION GRAPHIC
COMPONENTS
115
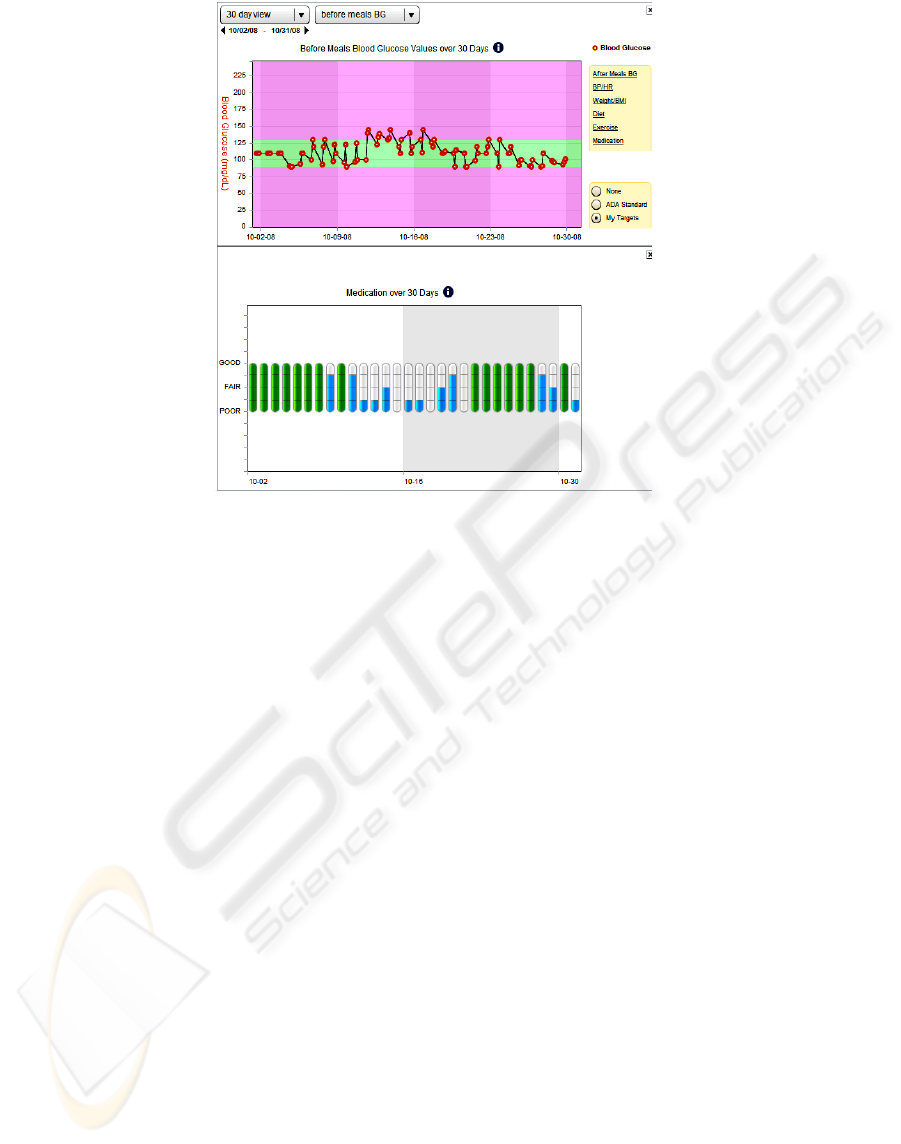
Figure 5: Synchronization between Medication and Blood glucose graphs.
care givers. It also gives the patient a sense of
empowerment that is very valuable in helping to
manage chronic diseases.
ACKNOWLEDGEMENTS
Thank you to the Frog Design team for their help
creating the mock-up for data visualization. A
particular thanks to John Gillson, Christian Grail,
Dirk Dinger and Andreas Kaltenbach for their
technical contributions, improvements and support
for Flex. Thank you to both the ICW BAS and PHR
teams for providing and maintaining the ICW
eHealth Framework and the LifeSensor PHR
application on top of which we have built these
graphic modules. Finally thanks also to Ben Vigil
for helping in reviewing this paper.
REFERENCES
AHIMA e-HIM Personal Health Record Work Group.
"Defining the Personal Health Record." In Journal of
AHIMA 76, no.6 (June 2005): 24-25.
Electronic Personal Health Records Come of Age, In
American Journal of Medical Quality (AJMQ), Vol.
21, No. 3 suppl, 5S-15S (2006)
Francois Andry, Larry Freeman, John Gillson, John
Kienitz, Michelle Lee, Goutham Naval, Daren
Nicholson, 2008, Highly-Interactive and User-
Friendly Web Application for People with Diabetes, In
IEEE International Conference on Communication
Systems (HEALTHCOM 2008), pp. 118-120.
W.S. Cleveland and R. McGill, 1985, Graphical
perception and graphical methods for analyzing
scientific data, In Science 229 (1985), pp. 828–833.
Connecting for Health. "Achieving Electronic
Connectivity in Healthcare: A Preliminary Roadmap
from the Nation's Public and Private-Sector Health-
care Leaders" Markle Foundation & Robert Wood
Johnson Foundation (2004).
Hassol A, Walker JM, Kidder D, Rokita K, Young D,
Pierdon S, Deitz D, Kuck S, Ortiz E., 2004, Patient
experiences and attitudes about access to a patient
electronic health-care record and linked Web
messaging, In Journal of Medical Informatics
Association, Nov 2004. 11(6); 505-513.
Lowes R., 2006. Personal health records: What's the status
now? In Feb 2006. 83(4); TCP 13-4,16.
HIMSS conference 2008. Health-care Information and
Management Systems Society. http://www.himss.org/
JSON, JavaScript Object Notation http://json.org/.
OeHF, Open eHealth Foundation http://
www.openehealth.org/
Ralston JD, Revere D, Robins LS, Goldberg HI., 2004.
Patients' experience with a diabetes support program
based on an interactive electronic medical record:
qualitative study, In British Medical Journal, May
2004. 328(7449); 1159.
Stroetmann, K.A., Pieper M., and Stroetmann V.N., 2003.
Understanding Patients: Participatory Approaches for
the User Evaluation of Vital Data Presentation, In
ACM Conference on Universal Usability, Vancouver,
British Columbia, Canada, pp. 93-97.
HEALTHINF 2009 - International Conference on Health Informatics
116
