
AN EXPLOITATION OF THE SELF-ORGANIZING MAP FOR
HUMAN MOTION ANALYSIS
W. Kurdthongmee
Division of Computer Engineering, School of Engineering and Resources, Walailak University
222 Thaibury, Tha-sa-la, Nakorn-si-thammarat 80160, Thailand
P. Kurdthongmee
Center for Scientific and Technological Equipment, Walailak University
222 Thaibury, Tha-sa-la, Nakorn-si-thammarat 80160, Thailand
Keywords: Kohonen Self-organizing map, Motion analysis, Gyroscope, Accelerometer.
Abstract: Falls are the most common type of home accidents among elderly people and are a major threat to their
health and independence. Evaluating the risk of falling is important because it enables the provision of
adapted assistance and of taking preventive measures with subjects deemed at risk of falling. Currently, the
risk of falling has been evaluated by using questionnaires with their associated problems of subjectivity and
limited accuracy in recall. The Kohonen Self-Organizing Map (SOM) has found applicability in a wide
range of application areas. Our research as a whole has a final objective to
employ the concept SOM to
implement an adaptive fall risk detection and warning system. In this paper, we present the preliminary
results from our research to utilize SOM to analyze the motion parameters from a miniature sensor with
integrated gyroscopes and accelerometers attached to the chest of an individual. The results clearly indicate
that SOM can be successfully used to cluster the activities by means of their motion parameters. This is very
promising results to extend the concept to implement our final objective system.
1 INTRODUCTION
Falls are the most common type of home accidents
among elderly people and are a major threat to their
health and independence (Najafi, 2002). Thirty-two
percent of a sample of community dwelling persons
75 years and older fell at least once a year. Among
them, 24% sustained serious injuries (Tinetti, 1988)
In addition, falling can dramatically change an
elderly people’s self-confidence and motivation,
affecting their ability to function independently.
Considering the growing proportion of old people
(over 75) in the populations of industrial countries,
falls will be one of the major problems of this
important part of the population (Askham, 1990) In
2050, 16.4% of the world population and 27.6% of
the European population are projected to be 65 years
and above, and in 14 countries, including nine
European countries, more than 10% of the total
population will be 80 years or older. Most cases of
falls sustained by elderly people appear to result
from the cumulative effect of multiple specific
disabilities. Among these, balance and gait disorders
play a key role (Tinetti, 1986).
Our research has the following major goals: (1)
to investigate the changes of an individual’s motion
parameters over a period of time, (2) to
experimentally proof that SOM can be used to learn
an individual’s motion parameters and make the
decision for an unsafe motion that could be a fall
risk, and (3) to present the prototype of a SOM-
based adaptive system for monitoring and warning
of the fall risk motions. In this paper, we present the
results that fulfil part of the second objective. We
have a strong postulation that different persons have
different styles of motion, different activities to
perform in the daily life. In addition, it is very likely
that the styles of motion and activities are likely to
change over time. This calls for an automatic system
that is capable of learning along with the wearer and
warning if the motion parameters are out of normal
conditions previously and continuously learnt by the
system.
151
Kurdthongmee W. and Kurdthongmee P. (2009).
AN EXPLOITATION OF THE SELF-ORGANIZING MAP FOR HUMAN MOTION ANALYSIS.
In Proceedings of the International Conference on Biomedical Electronics and Devices, pages 151-156
DOI: 10.5220/0001225901510156
Copyright
c
SciTePress

Evaluating the risk of falling is important
because it enables the provision of adapted
assistance and of taking preventive measures with
subjects deemed at risk of falling. The risk of falling
has generally been evaluated by using questionnaires
with their associated problems of subjectivity and
limited accuracy in recall (Cummings, 1988). Risk
of falls can also be evaluated by clinical and
functional assessment including posture and gait,
independence in daily life, cognition, and vision
(Tinetti, 1986). However, no simple objective
method is available.
A method of evaluating the characteristics of
postural transition (PT) and their correlation with
falling risk in elderly people is described in (Tinetti,
1988). With respect to the report, the time of sit-to-
stand and stand-to-sit transitions and their duration
were measured using a miniature gyroscope attached
to the chest and a portable recorder placed on the
waist. The comparison between two groups of
elderly subjects (with high and low fall-risk) showed
that the computed parameters were significantly
correlated with the fall risk as determined by the
record of falls during the previous year, balance and
gait disorders, visual disorders, and cognitive and
depressive disorders. From our point of view, the
drawbacks of the proposed system are three folds.
Firstly, the differences in the collected data among
different persons, or even within the same person,
but different time are not taken into account.
Secondly, the history of falls in the part was used as
an input parameter for the system. This could be an
incomplete data due to the limitation of memory of
the studied group. Finally, the proposed monitoring
and warning system is in a class of a pre-
programmed system. This is in contrast to our
proposed final system that will rely on using SOM to
make it adaptable. The exploitations of gyroscopes
and accelerometers for monitoring and warning
applications were also described in several patents
(Patent, 2008). They, however, lacked the
adaptability features.
Javanov et al. (Javanov, 2005) present a
prototype wireless body area network (WBAN)
system with unobtrusive, commercially available
sensor platforms that have minimum size and
weight. The prototype relies on using their proposed
algorithms to monitor wearer’s activity with a
minimal number of accelerometers to reduce the
price of future systems. The obvious difference
between this prototype and our proposed one is that
the prototype, itself, does not perform any adaptive
feature on board at all. Its main function is only to
transfer the accelerometer and electrocardiogram
(ECG) data to be analyzed by the remote server.
In (Hwang, 2004), a novel algorithm and real-
time ambulatory monitoring system for fall detection
in elderly people were described. The system
comprised of accelerometer to measure kinetic force,
tilt sensor and gyroscope to estimate body posture.
The BlueTooth® module was integrated to the
system to send real-time data to a personal computer
for data analysis and warning. The system was
evaluated by attaching to the chest for fall detection
on three people aged over 26 years. The experiment
of four cases; forward fall, backward fall, side fall
and sit-stand, was repeated ten times and the
experiment in daily life activity was performed one
time to each subject. The results showed that the
system and the proposed algorithm could distinguish
between falling and daily life activity. Moreover, the
accuracy of fall detection is 96.7%. From our
opinion, the system required adjustment to be suited
for different persons since it lacks the feature to
automatically adapt the decision making rules.
The objective of this paper is to present the
experimental results of applying SOM to learn an
individual’s motion parameters and correctly cluster
the motion parameters by means of the activities.
The remaining of this paper is organized as follows.
Our method is presented in Section 2, and
experiments and results are detailed and analyzed in
Section 3. Section 4 draws conclusions and
introduces future work.
2 METHODS
2.1 Data Gathering System
As mentioned earlier that individuals are likely to
have different styles of motion and different daily
activities to perform. In addition, it is very likely that
the styles of motion and activities change over time
and age. In our research, we developed an
experiment to confirm this postulation. A simple
low-cost data logger was developed in-house to
fulfil this purpose. The prototype of the system,
illustrated in Figure 1, consists of a microcontroller
(dsPIC30F2010), a couple of EEPROMs with total
capacity of 256 KB (2 of AT24C1024) and a special
purpose chip to serve as a voltage level converter
between TTL and RS232 standards. The RS232 is
used as a communication channel between a
personal computer and the data logger. The Analog
Devices Inc’s ADIS16350 tri-axis inertial sensor
(triple axes gyroscopes plus triple axes
accelerometers) sensor is used to measure both
angular and linear accelerations.
BIODEVICES 2009 - International Conference on Biomedical Electronics and Devices
152
A Windows based application software on a
personal site was specially developed to control the
operations of the data logger; i.e. time stamp setting,
sample time setting and data capturing for analysis.
Figure 2 shows the screenshot of the results from the
data logger during the period of 12:43:30 –
12:49:00. The first three columns are the time stamp
of the recorded data which are arranged in the
following format: the angular accelerations in the x,
y and z axes and the linear accelerations in the x, y,
and z axes. It is noted that the data logger was
programmed to sample data every 1 second period
but it is capable of immediate recording the new
incoming data if and only if all parameters change
more than the predefined acceptable delta which are
6 units in this case. Also, it is noted that in order to
get the true value of both angular and linear
accelerations the recorded values must be multiplied
by 0.07326
o
/s
2
and 2.522 mg, respectively.
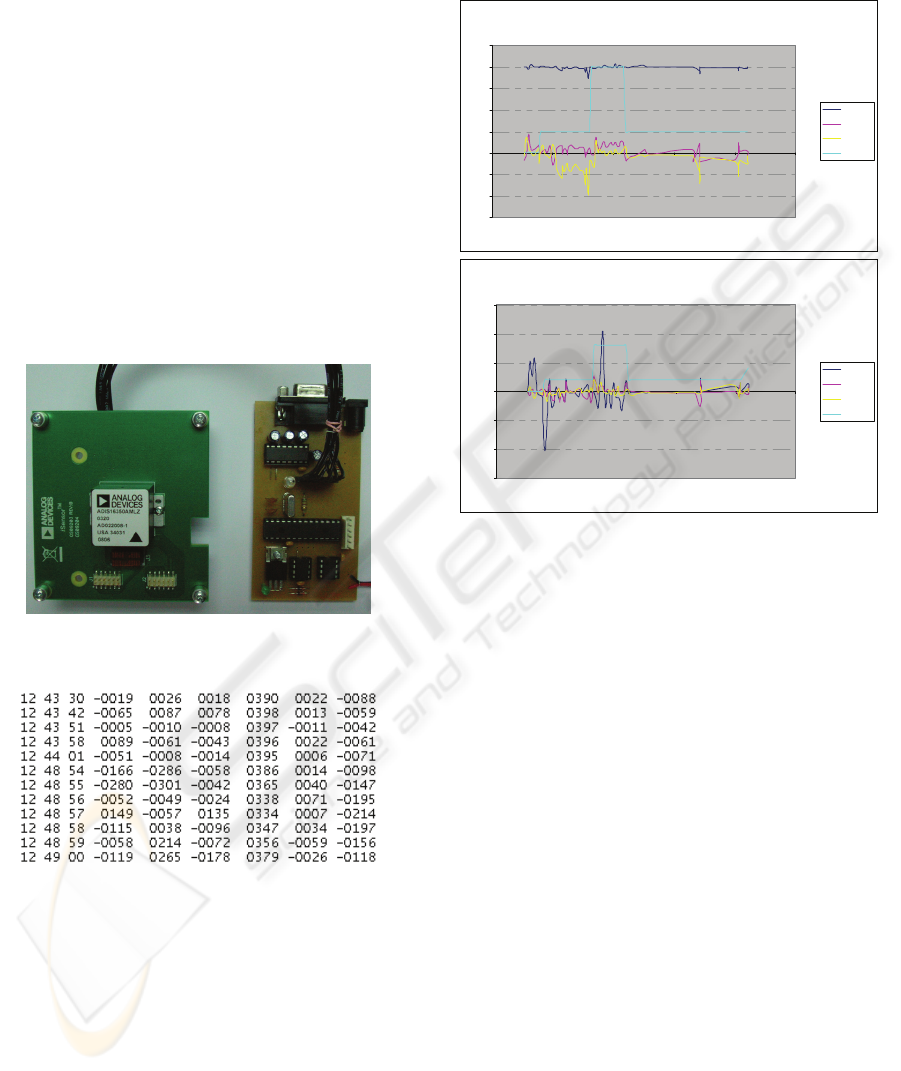
Figure 1: A photograph of the data logger system (right)
and a miniature gyroscopes and accelerometers (left).
Figure 2: The screenshot of the results obtained from the
data logger during the period of 12:43:30 – 12:49:00.
Figure 3 show two snapshots of the experimental
results from recording the motion, time and activity
of a male volunteer of 39 years old. The legends of
the activities are as follows: (0) Walking, (1) Sitting,
(2) Walking Downstairs, (3) Walking Upstairs, (6)
Jogging and (7) Sleeping. It is noted that during the
period of our experimentations, these activity types
were approximately inserted offline after the data
had already been transferred to a personal computer.
This was done in order not to interrupt and disturb
the normal activities of our volunteers. It can be
observed that there are some patterns in the graphs
which have some relations with the activities. These
are very promising input data for training SOM.
Raw Data from Accelerometers at Different Times & Activities
-300
-200
-100
0
100
200
300
400
500
3:43 PM 3:50 PM 3:57 PM 4:04 PM 4:12 PM 4:19 PM
Time Stamp
Accel X
Accel Y
Accel Z
Activity
Raw Data from Gyroscopes at Diffe rent Times & Activities
-1500
-1000
-500
0
500
1000
1500
3:43 PM 3:50 PM 3:57 PM 4:04 PM 4:12 PM 4:19 PM
Time Stamp
Gy ro X
Gy ro Y
Gy ro Z
Activity
Figure 3: The snapshots of the experimental results from
recording motion, time and activity of a volunteer from the
accelerometers (top) and the gyroscopes (bottom).
2.2 A Brief Introduction to SOM
A 2-D map is defined by k locations or k cells
arranged as a 2-D lattice. Each location contains an
n-dimensional model vector which comes to
resemble n-dimensional input (teaching) data during
the unsupervised learning process, the self
organization (Joutsiniemi, 1995). As a result of
SOM process, the distribution of the model vectors
in the n-dimensional space will approximate the
probability distribution of the input vectors. The
topographic organization of the map will also
approximate the matrix ordering relations in the
input space. Thus, similar inputs project near each
other onto the map. Increasing the number of
locations k increases the accuracy of the
approximation, which means that k should be chosen
according to the computing power available. In our
experiment, we chose k = 500. (a hexagonal lattice
with dimensions 25 and 20).
In our experimentation, the maps were
initialized, taught, and evaluated using the routines
in the SOMPAK package. The learning consisted of
two phases. In the first phase, the learning
coefficient
α
(t) decreased from 1.0 to 0 in 100,000
AN EXPLOITATION OF THE SELF-ORGANIZING MAP FOR HUMAN MOTION ANALYSIS
153

steps, while the radius of the neighbourhood
decreased from 15 to 1. In the second phase,
α
(t)
decreased from 0.125 to 0 in 10,000 steps, while the
radius of the neighborhood decreased from 3 to 1.
The data retrieved from the sensors were modified to
have zero mean and one standard deviation
(Zachrison, 2006). This was down in order to
restrain one of the input dimensions from becoming
too dominant. The time stamps were not used
directly for self organization process but they were
instead transformed into the “period of change” of a
consecutive pair of motion parameters. By doing this
way, it made the resulting map to be in a more
readable form with highly cluster groups of data.
3 RESULTS AND DISCUSSIONS
The resulting map after training process with an
individual’s input data of 7 dimensions, which are
the period of change, the angular accelerations
and the linear accelerations in the x, y, and z
axes, is shown in Figure 4(a) (lines separating
different clusters and labels within the clusters were
manually inserted). In total, the data used during the
learning stage consisted of 1,044 records. In order to
get as general results as possible with the limited
data, a leave-one-out procedure was used. This was
done by taken out 10 percents of the records of the
motion parameters for each activity from the training
dataset and analyzed using a map trained with the
parameters of the remaining records. The activities
of the former set of data records were known to us
but they were invisible with respect to SOM. It can
be seen that the self-organization process produced
the final map with different distinguishable clusters.
In Figure 5(a), the clusters are grouped and the
corresponding activities are labeled manually with
the guidance of the data resulting from the labeling
process of the SOMPAK program.
It is noted that with respect to the results after the
SOMPAK labeling process, some cells in the map
were labeled by many activities. Also, some cells
were completely left unlabelled. For the former case,
this means that some activities share common
motion parameters. These activities are “walking
upstairs” and “downstairs.” For the latter case, such
cells could be matched to a group of motion
parameters which could be a fall risk. The
investigation of the properties of these cells is
beyond the scope of this paper.
At this point, consider the leave-one-out testing
results which was performed by querying the trained
SOM with an unknown motion parameters with
respect to the SOM (the one which was taken out
from the training dataset), the results are presented
in the middle column of Table 1 (within group). It is
clear that, with respect to the proposed set of motion
parameters for SOM training, all activities could be
correctly classified with the mean and the standard
deviation of 73.45 percents and 16.08, respectively.
It is noted that the hundred percents could not be
achieved because some activities were matched to a
group of cells of the SOM map which were
previously labeled by many activities.
Table 1: The results from the leave-one-out testing
procedure: within group and cross validation.
Activities
Percent Correctness
Within
Group
Cross
Validation
Walking (W)
61.54 56.24
Sitting (S)
86.67 62.00
Walking Downstairs (D)
64.29 42.85
Walking Upstairs (U)
61.54 50.00
Jogging (J)
50.00 42.71
Sleeping (SL) 100.00 87.00
Table 2: The probability of being matched of all activities
after presenting to SOM with the known activity motion
parameters (Use the abbreviations from Table 1).
Act
The Probabilities of Matched to Activities
W S D U J SL
W
0.62 0.07 0.07 0.08 0.10 0.00
S
0.15 0.87 0.29 0.00 0.20 0.00
D
0.18 0.05 0.64 0.08 0.15 0.00
U
0.00 0.00 0.00 0.62 0.05 0.00
J
0.03 0.00 0.00 0.15 0.50 0.00
SL 0.03 0.02 0.00 0.08 0.00
1.00
The rightmost column of Table 1 presents the testing
results after performing the similar testing
procedures with the dataset of the motion parameters
from different volunteer: the cross-validating test. It
was expected prior to performing the test that the
results could not be as good as the previous testing.
The outcomes show that the mean of correctness is
only 58.97 percents with a standard deviation of
15.19. This confirms that different persons have
their own set of motion parameters. To correctly
classify the activities of an individual, SOM is
required to be trained with the motion parameters of
the individual.
There are some interesting results if we
reconsider the probability of being matched to all
activities after presenting the unknown motion
parameters to SOM. The results are shown in Tab. 2.
Column 2 – 7 are the types of activity whose motion
parameters were presented to SOM for querying and
all rows are the resulting probabilities that SOM
BIODEVICES 2009 - International Conference on Biomedical Electronics and Devices
154
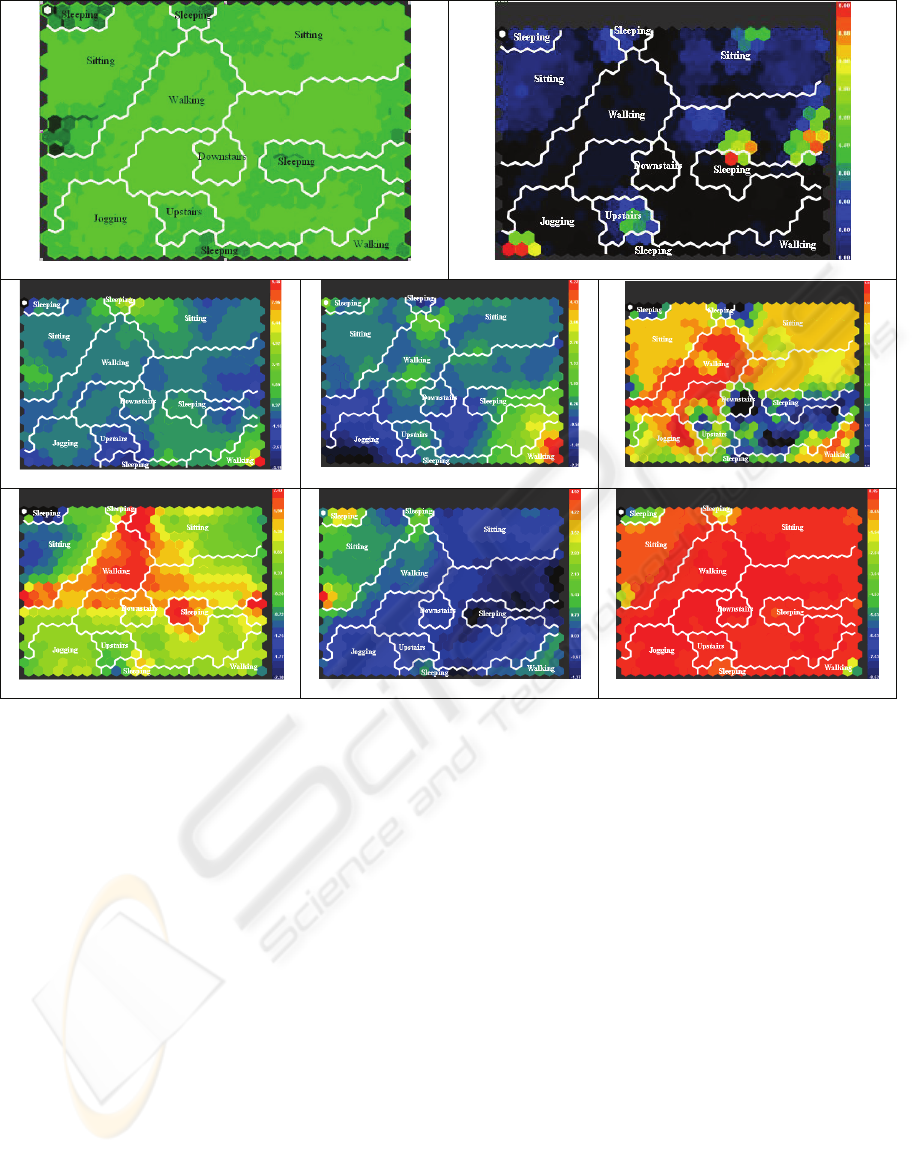
(a)
(b)
(c)
(d)
(e)
(f)
(g)
(h)
Figure 4: (a) The resulting map after clustering and labelling, the projection maps in (b) – (h) show the relationships
between the activities and the training parameters: period of change, angular and linear accelerations in the x, y, and z axes.
matched those parameters to the activities. It can be
seen that (“walking”, “walking downstairs”),
(“sitting”, “walking downstairs”) and (“jogging”,
“walking downstairs”, “sitting”) share some
common motion parameters. It is quite clear for the
first group but question could be arisen for the
second and third one. This can be explained that the
volunteer could be moving while sitting.
After all activities were clustered, it is now
possible to analyze the relationships between
different training parameters and the activities.
Figure 5(b) – (h) show the projection maps with
respect to individual motion parameters. Consider
the map of the x and y axes of gyroscope, Figure
5(c) and (d), both maps show almost the similar
clusters and the scales of the motion parameters
which are reflected from their colour appearances
(see the legend on the right side of the maps.) It is
surprised to see that only the activity of type
“walking” can make a prominent high value to the
sensors in these axes. This could come from the fact
that our volunteer’s walking style causes a more
forward movement comparing to “jogging” and
“walking upstairs and downstairs”. Also, the
projection map of the z-axis gyroscope in Figure
5(e) which clearly shows different clusters of
activities, comparing to the previous 2 maps,
indicates that “walking” and “jogging” cause this
sensor to output a very high level.
The maps with respect to the accelerometers
shown in Figure 5(f) – (h) obviously indicate that
SOM is capable of clustering “sleeping” which
differs from the rest activities in the way that the
motion parameters in all axes are completely
changed. Also, the maps in Figure 5(f) which
projects onto the x axis accelerometer clearly show
the clusters of “walking.” There are some variations
in the motion parameters of “sitting” with respect to
the accelerometers which could be interpreted that
our volunteer could be moving while sitting. It is
noted that these variations could not be correctly
recorded during the period of our experimentations.
AN EXPLOITATION OF THE SELF-ORGANIZING MAP FOR HUMAN MOTION ANALYSIS
155

Lastly, consider the last projection map, the period
of change, in Figure 5(b). The map reveals some
interesting points in the “jogging” cluster on the
bottom left part, also the “sitting”, the “walking
upstairs” and the “sleeping” clusters. These points
can be interpreted that there were suddenly changed
of the motion parameters during performing such
activities. It is easy to understand these cases for
“jogging” and “walking upstairs” which always
cause the sudden changes of these motion
parameters. For “sleeping” and “sitting”, such the
changes could be resulted from the immediate
change of motion patterns; i.e. move backward and
change to forward immediately during sitting or
quickly lie before sleeping.
4 CONCLUSIONS
In this paper, we presented the results that partly
fulfilled an objective of our overall research project
which is intended to develop an adaptive system to
detect motion parameters that are fall-risk. We
experimentally proved that SOM could be trained
with an individual’s motion parameters: the period
of change of a consecutive pair of parameters, the
angular and linear accelerations in (x, y, z), resulting
in clustering of similar motion parameters. Also,
SOM could match between normal activities and the
clusters of motion parameters on the maps with as
high as 73.45 percents of correctness. However, the
matching between abnormal motion parameters that
could be a fall risk still needs more efforts to pursue.
From the experiment results, it can be concluded that
different activities of an individual have different
motion parameters (period of change is also
included). SOM can successfully and correctly
cluster these activities in relation to the motion
parameters. It is worth noting that in order to
classify the activities of a person with a high degree
of correctness, SOM needs to be trained with the
motion parameters of that person. With positive
experimental results, we expect that SOM can be
utilized to make the decision for an unsafe motion
that could be a fall risk in an adaptive way.
ACKNOWLEDGEMENTS
The author would like to thank Analog Devices Inc
for providing ADIS16350 sample. This work is
supported by the Assistive Technology Program of
Thailand’s National Electronics and Computer
Technology Centre (NECTEC).
REFERENCES
J. Askham, E. Glucksman, P. Owens, C. Swift, A. Tinker,
and G. Yu, 1990, Home and leisure accident research:
A review of research on falls among elderly people,
Age Concern Institute of Gerontology, King’s
College, London, UK.
S. R. Cummings, M. C. Nevitt, and S. Kidd, 1988,
Forgetting falls: The limited accuracy of recall of falls
in the elderly, J. Amer. Geriatr. Society, vol. 36, pp.
613–616.
J. Y. Hwang, J.M. Kang, Y.W. Jang, H. C. Kim, 2004,
Development of Novel Algorithm and Real-time
Monitoring Ambulatory System Using Bluetooth
Module for Fall Detection in the Elderly, Proc. of the
26th Annual Int. Conf. of the IEEE EMBS, San
Francisco, CA, USA.
E. Jovanov, A. Milenkovic , C. Otto, P. de Groen , B.
Johnson, S. Warren, G. Taibi, 2005, “A WBAN
System for Ambulatory Monitoring of Physical
Activity and Health Status: Applications and
Challenges,” Proc. of the 27th Annual Int. Conf. of the
IEEE Engineering in Medicine and Biology Society,
Shanghai, China.
S. L. Joutsiniemi, S. Kaski and T. A. Larsen, 1995, Self-
Organizing Map in Recognition of Topographic
Patterns of EEG Spectra, IEEE Trans. on Biomedical
Engineering, vol. 42, no. 11, pp. 1062 - 1068.
B. Najafi, K. Aminian, F. Loew, Y. Blanc, and P. A.
Robert, 2002, Measurement of Stand–Sit and Sit–
Stand Transitions Using a Miniature Gyroscope and
Its Application in Fall Risk Evaluation in the Elderly,
IEEE Trans. on Biomedical Engineering, Vol. 49, No.
8, pp. 843 – 851.
M. Oja, S. Kaski, T. Kohonen, 2002, Bibliography of Self-
Organizing Map (SOM) Papers: 1998-2001
Addendum, Neural Computing Surveys, 3, 1-156,.
Patent, 2008, Patents: 5823845, 7141026, 6165143,
6095991, 6059576, 5919149, Available from
http://www.patentstorm.us (accessed on 16/06/2008).
M. E. Tinetti, T. F. Williams, and R. Mayewski, 1986, Fall
risk index for elderly patients based on number of
chronic disabilities,” Amer. J. Med., vol. 80, pp. 429–
434.
M. E. Tinetti, M. Speechley, and S. F. Ginter, 1988, Risk
factors for falls among elderly persons living in the
community, N. Eng. J. Med., vol. 319, pp. 1701–1707.
A. Zachrison and M. Sethson, 2006, Detection of System
Changes for a Pneumatic Cylinder Using Self-
Organizing Maps, Proceedings of the 2006 IEEE
Conf. on Computer Aided Control Systems Design,
Munich, Germany, pp. 2647 – 2652.
BIODEVICES 2009 - International Conference on Biomedical Electronics and Devices
156
