LABEL FREE BIO SENSING METHOD USING RADIO
FREQUENCIES SPECTROSCOPY FOR CELL DETECTION AND
DISCRIMINATION
Claire Dalmay, Arnaud Pothier, Pierre Blondy
XLIM – UMR 6172 Université de Limoges/CNRS, France
Fabrice Lalloue, Marie-Odile Jauberteau
Homéostasie cellulaire et Pathologies, Université de Limoges, France
Keywords: Bio sensor, Electrical bio-impedance, Microelectronics, RF planar devices.
Abstract: This paper presents an original label free bio sensing method allowing the study of electrical properties of
human cells and so potentially cell identification and discrimination. The proposed bio sensor is based on a
planar resonator operating at microwave frequencies, fabricated using a standard microelectronic process.
As the result its microscopic sensitive areas allow an improved detection at the cell scale which represents a
significant step in the study of many biological phenomenon. Thanks to a specific experimental protocol, we
present in this paper a simple method allowing electrical parameters measurement on a small number of
cells with a good accuracy.
1 INTRODUCTION
In recent years, biosensors known a great interest as
there is an important need for tools that can quickly
and accurately analyse biological elements like bio
molecules or cells. Current optical and chemical bio
detection techniques can effectively analyse
biological systems but present some drawbacks ;
especially their requirement of specific labels to
enhance the signal generation. These labelled
methods make the sample preparation more
complex, expensive and time consuming. In
addition, the sample can be largely chemically
altered prior analysis. In the other way, electronic
detection techniques are very interesting methods as
they allow the development of label free methods
(Kim et al. 2007). Thanks to microelectronic
technology a significant improvement of electrical
sensor detection performance can be expected since
resulting miniaturized biosensors are now able to
work at the cell scale.
In this paper, is presented an electric label free
method allowing to evaluate cell inside medium
permittivity and conductivity in the gigahertz
frequency domain. Actually, these two specific
parameters are influenced by the cell type and
morphology but also by their physiological state.
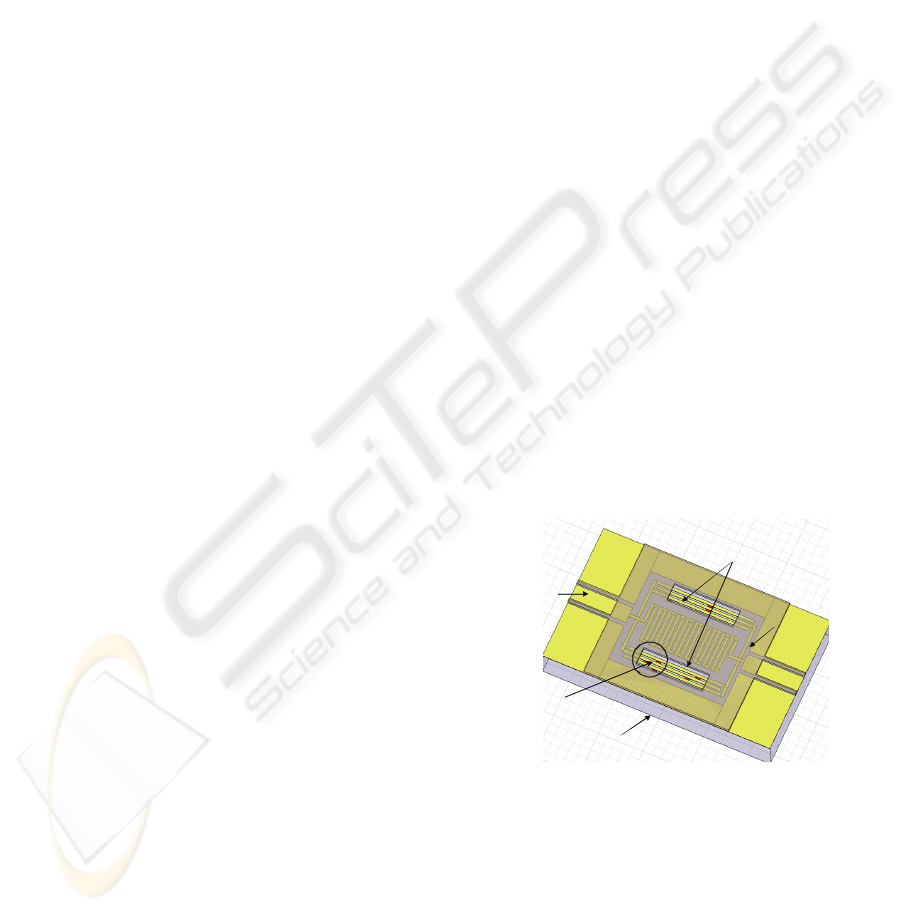
Culture chamber
Substrate (fused silica)
CPW access for
on wafer RF
measurements
Hydrophobic ring
Analysed cells
Figure 1: Schematic of the studied biosensor.
As example, tumorous cells are well known to
present a larger conductivity and permittivity than
normal cells (Blad and Baldetorp, 1996). Hence,
individual cell electrical properties measurement
represents a complementary tool allowing efficient
cell identification.
Developed biosensors are actually based on a
coplanar microwave resonator design (figure 1) able
to operate at radio frequencies with a significant
3
Dalmay C., Pothier A., Blondy P., Lalloue F. and Jauberteau M. (2009).
LABEL FREE BIO SENSING METHOD USING RADIO FREQUENCIES SPECTROSCOPY FOR CELL DETECTION AND DISCRIMINATION.
In Proceedings of the International Conference on Biomedical Electronics and Devices, pages 3-6
DOI: 10.5220/0001122800030006
Copyright
c
SciTePress
sensitivity to tiny concentrations of biological
medium that interacts with the sensor. Moreover its
planar configuration will make easier a coming
integration in microsystems with microfluidic flow-
through network enabling accurate cell sorting
applications as example.
2 BIO DETECTION METHOD
2.1 Biosensor Design
In this study a resonant structure has been favoured
because by nature much more sensitive to very small
cell concentration in comparison with wide band
device (
Denef et al, 2004). But in the other way,
available analysis spectrum will be limited to a
narrow band around the sensor resonant frequency.
Wider band investigation will so require fabricating
several resonators with different resonant
frequencies.
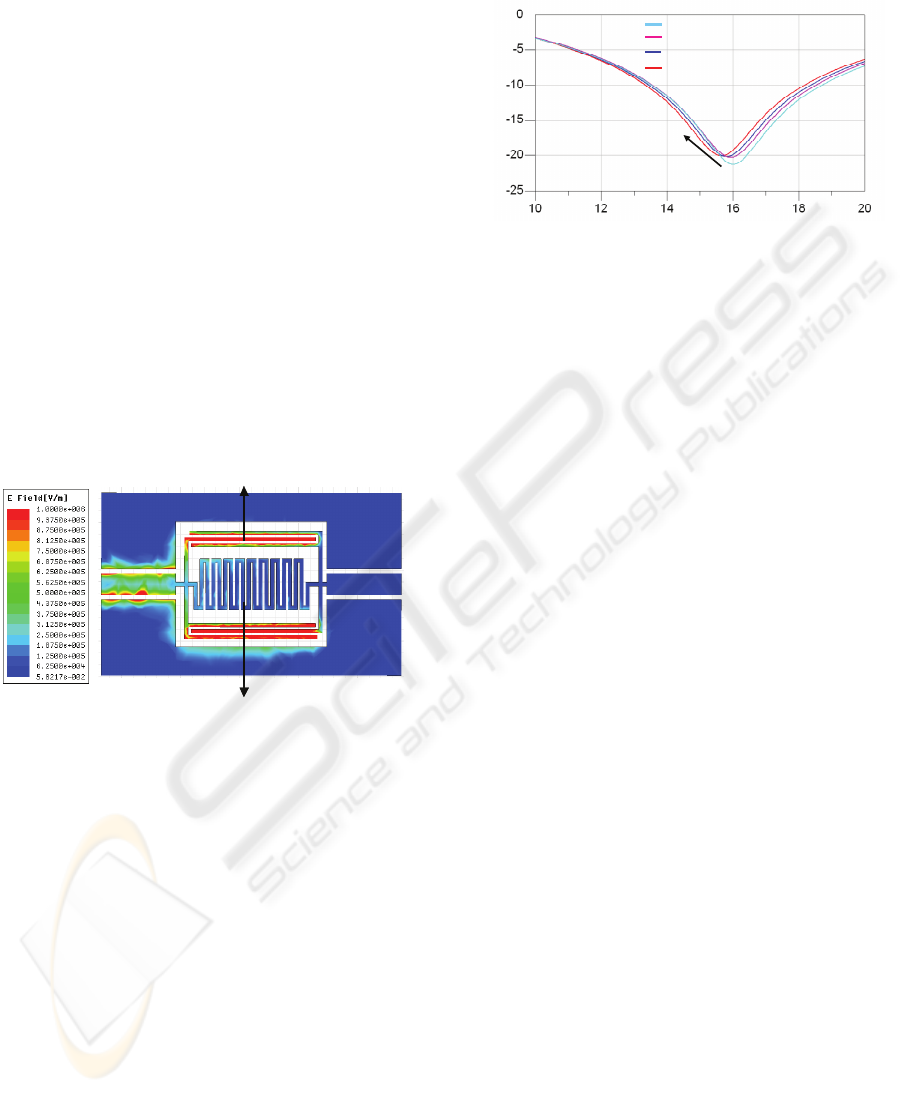
Meandered inductor
Interdigital capacitor
Meandered inductor
Interdigital capacitor
Figure 2: RF Electromagnetic field distribution plot at
resonance frequency.
The developed micro biosensor has been
designed as a coplanar RLC resonator made with a
meandered inductor associated in parallel with an
inter-digital capacitor. In our case, used resonators
present a RF signal attenuation which becomes
maximum at the resonant frequency. As shown on
figure 2 at this frequency, the electromagnetic field
distribution is strongly concentrate in the capacitive
part of the device which represents the more
interesting interaction area for a capacitive detection.
Indeed, the introduction of any biological media
even in very small concentration will meaningfully
disturb the EM field distribution inducing a
detectable shift in the measured resonance frequency
of the sensor (figure 3). This frequency shift will be
all the more significant if cells are located close to
gaps between metallic lines where the
electromagnetic field is strong.
Frequency (GHz)
S
21
(dB)
Unlooaded sensor
Sensor loaded by 4 cells
Sensor loaded by 6 cells
Sensor loaded by 8 cells
Cell number
increasing
Figure 3: Electromagnetic simulation of the cell number
influence on the sensor RF response:S
21
parameter relies
on the RF signal attenuation through the resonator.
Hence, the detection resonator performance
strongly relies on the biosensor sensitivity
capabilities where two parameters play a major role.
First, interaction between the EM field and cells to
be analysed must be maximized using an
appropriated sensor design with gaps between
metallic lines in the same order of magnitude of
analysed cell sizes: in the present case considered
gaps will be close to 10 µm. Then, a sufficient
resonator unloaded quality factor (relative the
resonator intrinsic loss) has to be also considered; as
it controls how the resonant frequency pick will be
narrow and so the sensor frequency sensitivity to a
small frequency shift.
Once biological cells will be present on the
sensor surface, both their location and their number
will directly influence its response. As shown on
figure 3, following our approach the detection of a
low number of cells (at least less than ten) can be
expected.
In the end, a microfluidic network will certainly
be required but in order to demonstrate the sensor
capability, we have chosen to develop a specific
experimental protocol for instance, allowing an
easier test procedure with the cost of the difficulty to
work with real alive cells. This protocol will be
presented in the following paragraphs.
2.2 Biosensor Fabrication Process
Micro sensors are fabricated using standard
microelectronic process with biocompatible
materials (figure 4).
BIODEVICES 2009 - International Conference on Biomedical Electronics and Devices
4
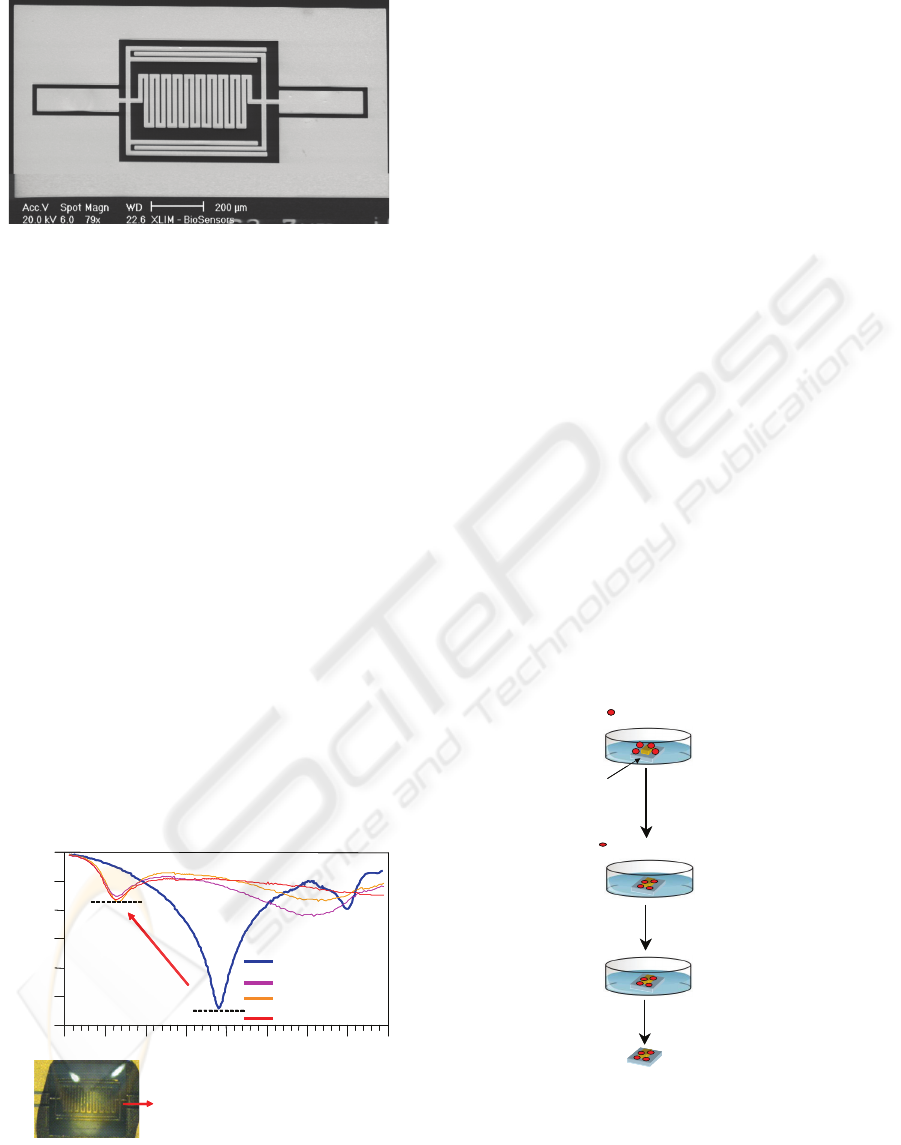
Figure 4: SEM photograph of the fabricated micro sensor.
A fused silica substrate has been preferred to
classical silicon one especially for its lower loss
properties in the RF frequency domain and also for
its transparency that makes easier the observation of
cells throw it. A classical photolithography allows to
define thin gold lines which are next electroplating
up to a thickness of 3 µm. Then a SU8 photoresist
from Microchem is used to create a 20µm thick well
localised culture micro-chamber on the sensor
surface.
2.3 Experimental Protocol
During characterizations, we have to ensure the
integrity of cells. Usually, a support biological
media, in which cells could be protected, is required.
As shown on figure 5, most of support medium
commonly used in biology are aqueous saline
solutions which present very strong losses for RF
signal especially when the sensor is fully cover with
it. Actually in this configuration, the biological
media alters in a too important manner the RF
performance of the device avoiding any accurate
detection.
5 10152025303504
0
-25
-20
-15
-10
-5
-30
0
1: Empty sensor
3: Distilledwater
2: PBS
4: Culture media
(GHz)
1
2
3
4
Biological
me di a
deposition
Drop of biological media
Frequency
S
21
(dB)
5 10152025303504
0
-25
-20
-15
-10
-5
-30
0
1: Empty sensor
3: Distilledwater
2: PBS
4: Culture media
(GHz)
1
2
3
4
Biological
me di a
deposition
Drop of biological media
Frequency
S
21
(dB)
Figure 5: Influence of different biological support media
20nl drops on the sensor RF performances.
A first solution could be to limit used biological
media to a very small volume, typically implying a
microfluidic flow-through system.
Another alternative will be to perform analysis in
a specific low loss support media, as done in
previous work (Dalmay et al., 2008) using ficoll (a
polymeric gel of sucrose). Hence, once dried, the
ficoll drop allows to protect cells to be analysed in a
low permittivity polymeric matrix with the cost of a
aleatory cell location on the sensor surface and in the
ficoll matrix that induces a significant error in their
electrical parameter extraction. Consequently, there
is a great interest in developing an experimental
protocol without any biological support media.
Actually with the proposed approach in this
paper, cells are directly grown on the sensor surface
submerged in a classical culture media. Few days are
required to allow a sufficient cell adhesion on the
sensor surface. Then sensor are washed in deionised
water following by paraformaldehyde 4 % bath
(PFA) in order to definitively fixe cells and so to
avoid cell degradation during the measurement
sequence. Since most of cell adhesion occurs
preferentially on the silica substrate than on gold
lines or on SU8 resist, most of fixed cells are located
only between gold lines in the culture micro-
chamber (figure 1). Number of cell on the sensor are
roughly controlled both with the cell concentration
initially dispersed in culture media and the culture
time.
After 5 days in
the culture
medi a
10 min
PFA4% with
deionised water
Sensor drying
Adherent cells
floating cells
Biosensor
After 5 days in
the culture
medi a
10 min
PFA4% with
deionised water
Sensor drying
Adherent cellsAdherent cells
floating cells
BiosensorBiosensor
Figure 6: Experimental protocol process.
After PFA bath, cells are no longer alive, but
their original form, their intracellular content and
their electrical properties have been kept as in living
conditions. Then sensor are again washed in
deionised water and dried just before measurement.
LABEL FREE BIO SENSING METHOD USING RADIO FREQUENCIES SPECTROSCOPY FOR CELL DETECTION
AND DISCRIMINATION
5
3 EXPERIMENTAL RESULTS
All characterizations are performed using classical
microwave measurement techniques with on wafer
probing; as it allows a quick and a successive sensor
measurements.
First, for each sensor, the transmitted microwave
signal attenuation across the unloaded resonator is
recorded using a calibrated vector network analyser.
Then cell culture is performed; at the end, loaded
sensors with fixed cells are measured following the
same procedure than before cell growth. Hence, the
induced resonator frequency shift value, related to
the cells electrical properties can be extracted.
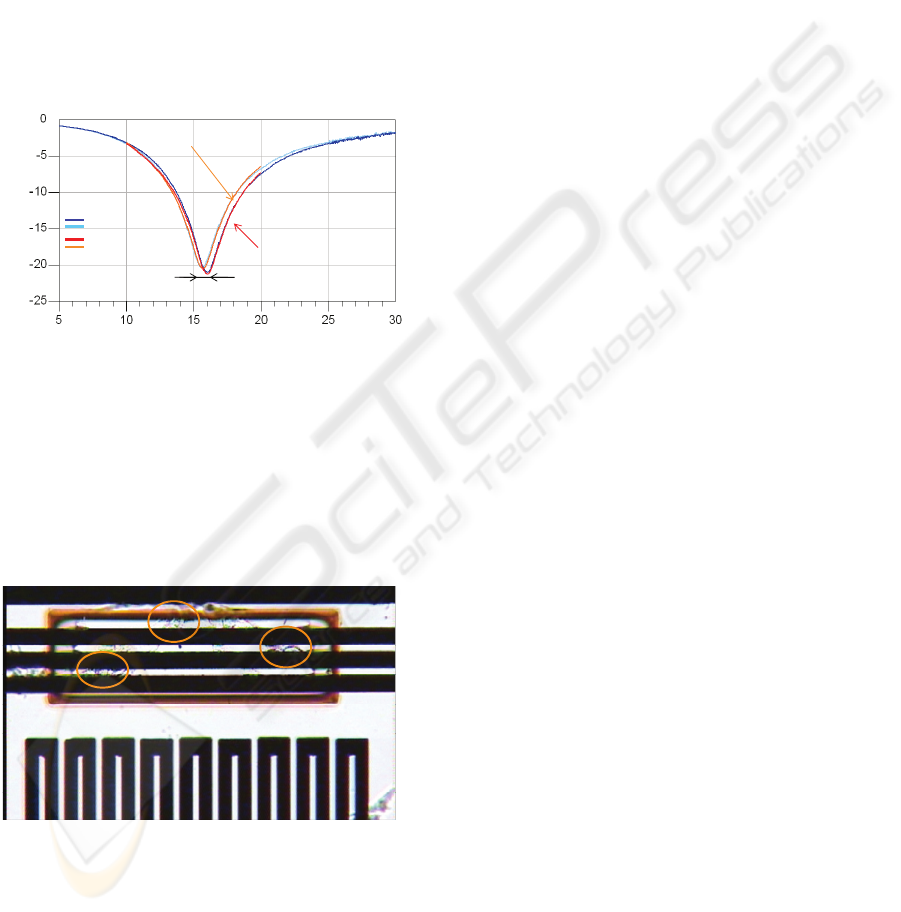
Frequency (GHz)
S
21
(dB)
Unloaded sensor
EM simulation
Measurement
Sensor after cell growth
370MHz
Figure 7: Biosensor measured response before and after
the cell growth and simulated one.
Figure 7 shows results of experimentations with
glial-cells-derived tumour glioblastoma coming
from human nervous system cells. Used biosensors
initially resonate at 16 GHz and shift down to 15.63
GHz when it is loaded with only 8 glial-cells (figure
8).
Figure 8: Photograph of the sensor after the cell growth.
Fullwave simulations, based on finite element
method (HFSS from ANSOFT), are then used to
extract individual cell electrical properties. Cells EM
modelling is done assuming that they are
homogenous, source-free and linear dielectric
volume. Hence, on a narrow frequency bandwidth
around the sensor resonant frequency, cell global
permittivity and conductivity can be extracted with a
good accuracy by fitting simulations data with
measured one, as shown on figure 7.
Hence in the case of analysed glial-cells, we
have obtained an effective permittivity value of 36 ±
1 while global conductivity has been estimated
0.100 ± 0.003 S/m at 16 GHz and 20°C. These
results agree very well with previous analysis done
with ficoll media (Dalmay et al., 2008) and can be
compared to the effective permittivity of pure water
which is closed to 45 at 20°C. Other
characterizations are currently done with other
cellular types, to demonstrate that it is possible with
this approach to discriminate between different cell
types.
4 CONCLUSIONS
An original label free bio-sensing approach for
cellular analysis at radio frequencies has been
demonstrated. Thanks to their sub millimetric size,
used sensors are able to work at the cell scale with a
very limited number of cells and can potentially be a
novel promising tool for cell discrimination. Further
work is ongoing to evaluate experimentally the
minimum number of cell analysis achievable and to
improve the sensor design and experimental process
for one single cell analysis.
REFERENCES
Young-Il Kim, Yunkwon Park, Hong Koo Baik, 2007.
“Development of LC resonator for label-free
biomolecule detection”, Sensors and Actuators A.
B. Blad, and B. Baldetorp, 1996. “Impedance spectra of
tumour tissue in comparison with normal tissue; a
possible clinical application for electrical impedance
tomography”, Physiol.Meas., vol. 17, pp. 105- 115.
T. W. Athey, M. A. Stuchly, S. S. Stuchly, 1982.
“Measurement of radio frequency permittivity of
biological tissues with an open-ended coaxial line :
Part I,” IEEE Trans. Microwave Theory Tech,. vol.
82, pp. 82-86.
N. Denef , L. Moreno-Hagelsieb, G. Laurent, R. Pampina,
B. Foultier, J. Remacle, D. Flandre, 2004. “RF
detection of DNA based on CMOS inductive and
capacitive sensors”, EUMW Conference Digest, pp.
669-672.
C. Dalmay, 2008. “Label free biosensors for human cell
characterization using radio and microwave
frequencies”, IEEE MTT-S International Microwave
Symposium Digest, IMS 2008.
BIODEVICES 2009 - International Conference on Biomedical Electronics and Devices
6
