
A FIELD-VALIDATED LOCATION CONSCIOUS QOS
PREDITION TOOL FOR WLL NETWORKS
Hicham Bouzekri, Tajjeeddine Rachidi
School of Science & Engineering
Alakhawayn University, Ifrane, Morocco
Yassine Moussaif, Tarik Janati
Wana Corporation, Morocco
Keywords: WLL QoS prediction, Field Measurement campaigns, Network Coverage Planning, GIS Map-based
propagation modeling.
Abstract: Wireless Local Loop (WLL) has become a viable alternative for the last mile problem, especially for
emerging countries. However the success of a large scale deployment of such a technology relies on careful
network planning taking into account existing building layout to achieve predictable quality of service
(QoS) for each customer. This paper proposes an approach where actual geographical layout of the area to
be covered is taken into account to distinguish line-of-sight (LOS), Obstructed Line-of-sight (OLOS) and
non-LOS (NLOS) regions and uses adequate propagation models for each case. By doing so a more accurate
prediction on achievable QoS is possible for each point of the area. The output of the tool is a point-by-point
quantitative measure of received average signal strength prediction and an optimized overall coverage
quality. Finally, field measurements and benchmarking were used to validate the approach adopted.
1 INTRODUCTION
In a net savvy world, broadband internet is as
important as having access to the power grid. Large
areas of the developing world still lack today the
wired infrastructure on which xDSL can run. Given
the prohibitive cost of running such installations, a
WLL solution is really the only viable alternative.
But unlike a twisted pair channel, which offers a
dedicated channel with highly predictable bandwidth
for a given distance from the local office, a WLL
operates over a channel which depends not only on
distance but also on actual obstacles between
transmitter and receiver. In order for an operator to
guarantee a QoS for its customers, an accurate
prediction of achievable performance for each
customer is required taking into account actual
position of base transceiver station BTS, customer
premises equipment (CPE) as well as landscape.
This paper proposes a field validated, benchmarked,
Geographic Information System (GIS) based tool
providing point by point received signal strength
prediction and a simulation-based BTS placement
optimization algorithm. Next, Section II discusses
the system model. Section III covers the propagation
models and tool description. Section IV presents
validation methodology and results, before the last
section draws some conclusions and proposes future
work directions.
2 SYSTEM DESCRIPTION
In order to accomplish the goals set for this research,
an awareness of the exact layout of propagation
environment between transmitter and receiver had to
be harnessed. This feat was accomplished in a two
stage process: first, natural elevation of the area had
to be taken into account and for the purposes of our
work the Digital Terrain Elevation Data (DTED)
files made available by National Imagery and
Mapping Agency (NIMA) were used. Second, actual
buildings laying in between transmitter and receiver
needed also to be taken into account, we made use of
a GIS map (in the publicly available ESRI shapefile
format; (ESRI shapefile 2008) of the desired area.
This map provides not only delimiting points of each
building in the area of interest but also their height.
157
Bouzekri H., Rachidi T., Moussaif Y. and Janati T. (2008).
A FIELD-VALIDATED LOCATION CONSCIOUS QOS PREDITION TOOL FOR WLL NETWORKS.
In Proceedings of the International Conference on Wireless Information Networks and Systems, pages 157-162
DOI: 10.5220/0002024401570162
Copyright
c
SciTePress
The height information is not complicated to get as
cities obey strict zoning regulations that determine
for every zone building heights. By combining this
information we are able to accurately distinguish
LOS, OLOS and NLOS areas. The combination of
elevation information and GIS map gives the system
a complete knowledge of the propagation
environment as Figure1 shows.
Figure 1: Tool display of a Map of the Azrou Region
(Morocco).
3 PROPAGATION MODELS AND
TOOL DESCRIPTION
3.1 Propagation Models
Given that interest in this study is average received
signal strength in an urban environment, a
deterministic channel model approach (such as ray
tracing) is clearly unusable. Although Ray tracing is
very popular among researcher in this area, we think
that given the high number of reflections arriving at
the receiver and their dynamic nature, it would be
unreasonable to exhaustively enumerate and track
them. The assumption of a few dominant paths is
also inaccurate in the case of NLOS. The only valid
approach for a dynamic urban layout is to use
empirical propagation models (Rappaport, T, 1996
).
However the models for LOS, OLOS and NLOS
environment are vastly different. In our approach,
for every point in the map, a line-of-sight assessment
is applied between the location of the BTS and each
potential receiver antenna position. The tool uses an
OpenMap API to import ESRI shapefile of the area
augmented by DTED.
In case of a Line of Sight (LOS) environment,
the Free Space Loss (FSL) (Rappaport, T, 1996
)
model is used, provided the first Fresnel zone is
clear. This is a reasonable assumption as although
transmitted signal reflected replicas do arrive at the
receiver in the case of an urban environment, the
receiver will lock on the highest-power first arriving
path.
The second possible case is that of OLOS. In
case an obstruction is within the First Fresnel zone,
whose width depends on the transmission frequency,
neither the LOS nor the NLOS models are
appropriate. After a careful review of appropriate
models to be used for this case, the choice was made
to adjust the LOS path loss with an Excess Path Loss
(EPL). The most appropriate method for calculating
EPL was found to be the Deygout method
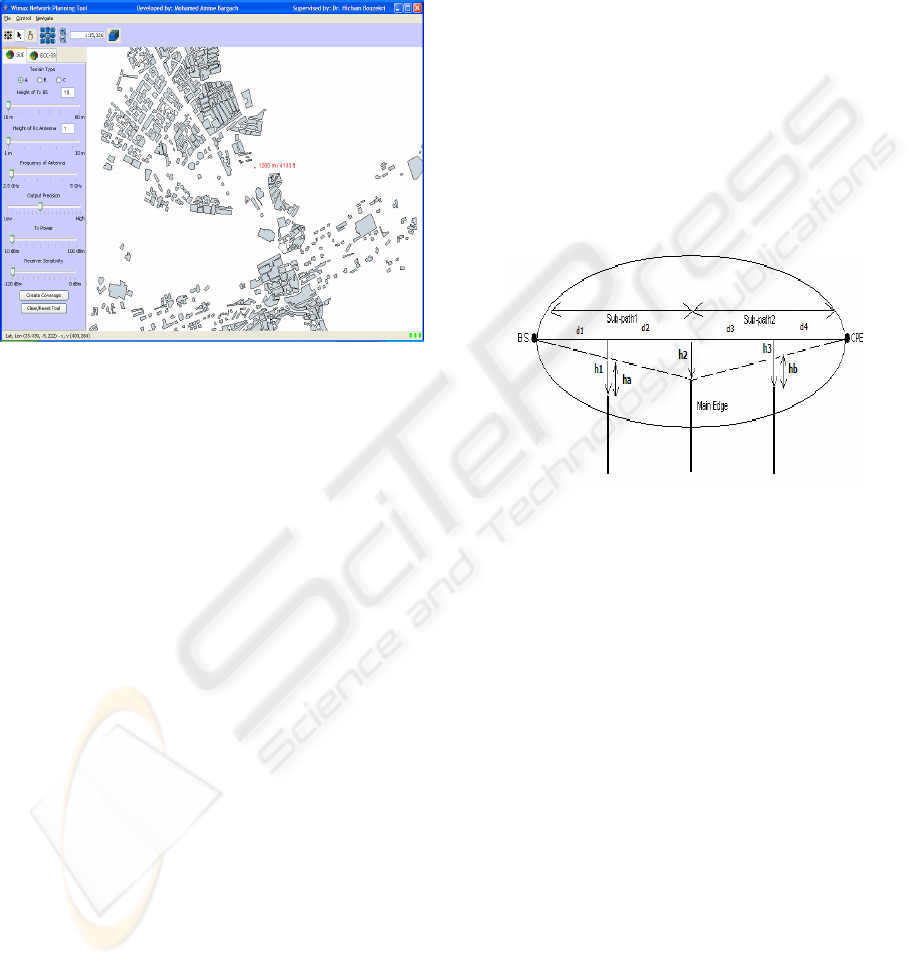
(Saunders, 2006 ). As Figure 2 shows all edges
(obstructions) in the Fresnel zone are taken into
account. In this illustration the main edge (closest to
the LOS path) defines two sub-paths. The method is
then recursively applied to these sub-paths
Figure 2: Edges inside Fresnel zone.
For a single edge in the Fresnel zone, the EPL is
given by the following formulas:
Gd = 0 for v <-1
Gd = 20 * Log
10
(0.5 – 0.62 * v) , -1 < v < 0 (1)
v= h/r sqrt(2) & r= sqrt (2(d1+d2)/(c/f)(d1.d2)
h being the negative height of the main edge
compared to the LOS path; d1 is the linear distance
from BS to the edge and d2 the distance from the
main edge to the CPE. f is the carrier frequency and
c the speed of light.
Naturally, in an urban deployment of a Wireless
Local Loop (WLL), some of the CPEs, if not most,
lack the privilege of having this clear, unobstructed
line of sight to the BTS. Consequently, empirical
propagation models have to be used in
(Abhayawardhana, 2005
), three models were
evaluated, namely the Stanford University Interim
(SUI) model, the COST-231 Hata model and the
ECC-33 model which showed the closest agreement
with the measurement results. In our paper both
models (ECC-33 and SUI), (IEEE 802.16 standards,
2008
) will be simulated to validate against measured
results.
WINSYS 2008 - International Conference on Wireless Information Networks and Systems
158

Figure 3: Predicted Coverage of the Azrou region (Normal Mode).
3.2 Tool Description
The Graphical User Interface (GUI) of the tool
allows the operator to enter all relevant information
for the simulation such as carrier frequency, height
of BTS and CPE, transmitter power and sensitivity
of the receiver as well as desired precision of the
output map. This last parameter directly impacts the
run time. The operator can then either pinpoint the
position of the BTS or make use of an optimization
algorithm for positioning the BTS.
Theoretically the algorithm would attempt all
possible locations for the BTS, however network
planning obeys business constraints. The tool
expects from the operator axes (typically along
major avenues) along which to search for optimum
positions. In the case of multiple BTSs, the
exponentially complex algorithm of finding joint
optimum positions can be replaced with disjoint
local optimum positions. This trade-off allows for
faster convergence of the algorithm at the expense of
the precision for the proposed placements.
QoS has taken various meanings depending on
the context it is being used in. For the work
presented in this paper, we are interested in the
average received signal strength as an indicator for
QoS, either the area average for the optimization
algorithm or individual for each point in the map.
For example the 802.16 standards (
Wimax Forum,
2008. ) tie the signal strength received to different
modulation formats used (from 64 QAM to QPSK)
translating into different data rates and different
error rates and hence different QoS.
4 SIMULATIONS AND TOOL
VA L I D AT I O N
This section presents results obtained: the first
subsection displays graphically the point-by-point
received signal strength prediction while the second
subsection details the approach and the results of the
tool validation.
4.1 Simulations
Figure 3 shows the output of the tool for the Azrou
region in Morocco. The different colors highlight
different received signal strengths with a scale
displayed in the bottom and a summary table on top
displaying BTS number, position (latitude and
longitude), height, frequency and overall area
average received signal strength.Figure. 4 shows the
output of the optimization algorithm for three BTS.
Each BTS position is optimized along a separate
axis to achieve overall best average Rx power.
4.2 Tool Validation
In order to validate the estimates provided by the
tool, field measurement campaigns had to be
conducted. This section details the approach used
and the results obtained.
Through a university-operator partnership a
street signal strength measurement campaign was
held in the city of Rabat during summer 2007. The
area of the city where measurements were conducted
A FIELD-VALIDATED LOCATION CONSCIOUS QOS PREDITION TOOL FOR WLL NETWORKS
159
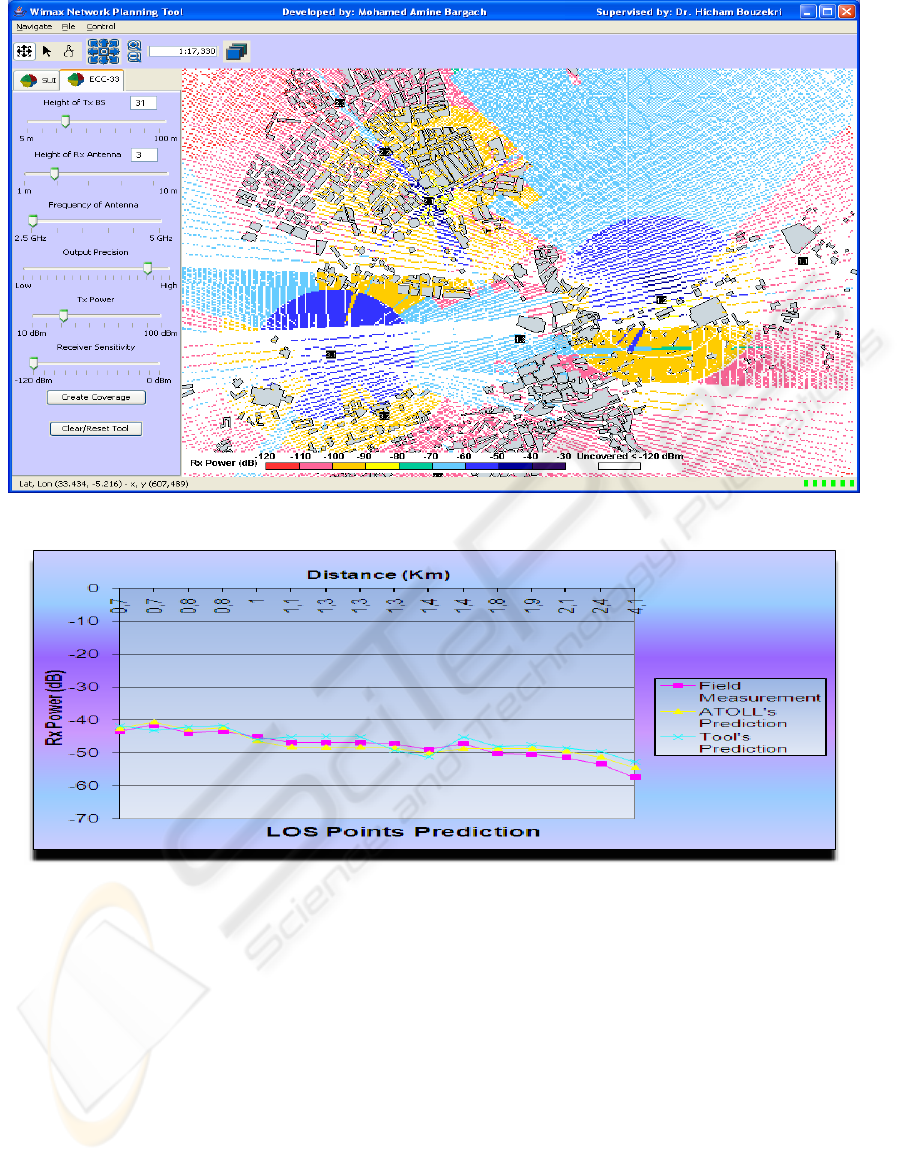
Figure 4: Optimized positions for 3 BTS.
Figure 5: Comparison with measured values LOS areas.
is a medium density city with up to 5-floors
buildings. The interest was not in determining
instantaneous signal strength but rather time average
signal strength as these were influencing the QoS the
operator was able to provide.
The operator had several CPEs deployed around
the city and a centralized control and monitoring
system collected regularly signal strength signals
received at CPEs. Most of the installed CPEs were
in a LOS configuration, and the collected
measurements were used to validate the estimates
obtained by the tool. To complete this study a field
measurement campaign was conducted using a
spectrum analyzer and an omni-directional antenna
mounted on a vehicle. In addition to LOS areas, the
campaign targeted OLOS and NLOS areas in
increasing distances from the BS.
As the operator was using a commercial RF
planning tool (ATOLL), we have run a simulation to
obtain a commercial tool benchmark for our tool. In
order to validate each propagation model separately
the results were categorized as either LOS, OLOS or
NLOS.
For areas having an unobstructed LOS view of
the base station of the WLL, the results obtained by
the tool are very close to the benchmark commercial
tool and are almost identical to the field measured
values as can be seen from Figure 5.
The good match between these results can be
considered a validation of the FSL model of
WINSYS 2008 - International Conference on Wireless Information Networks and Systems
160
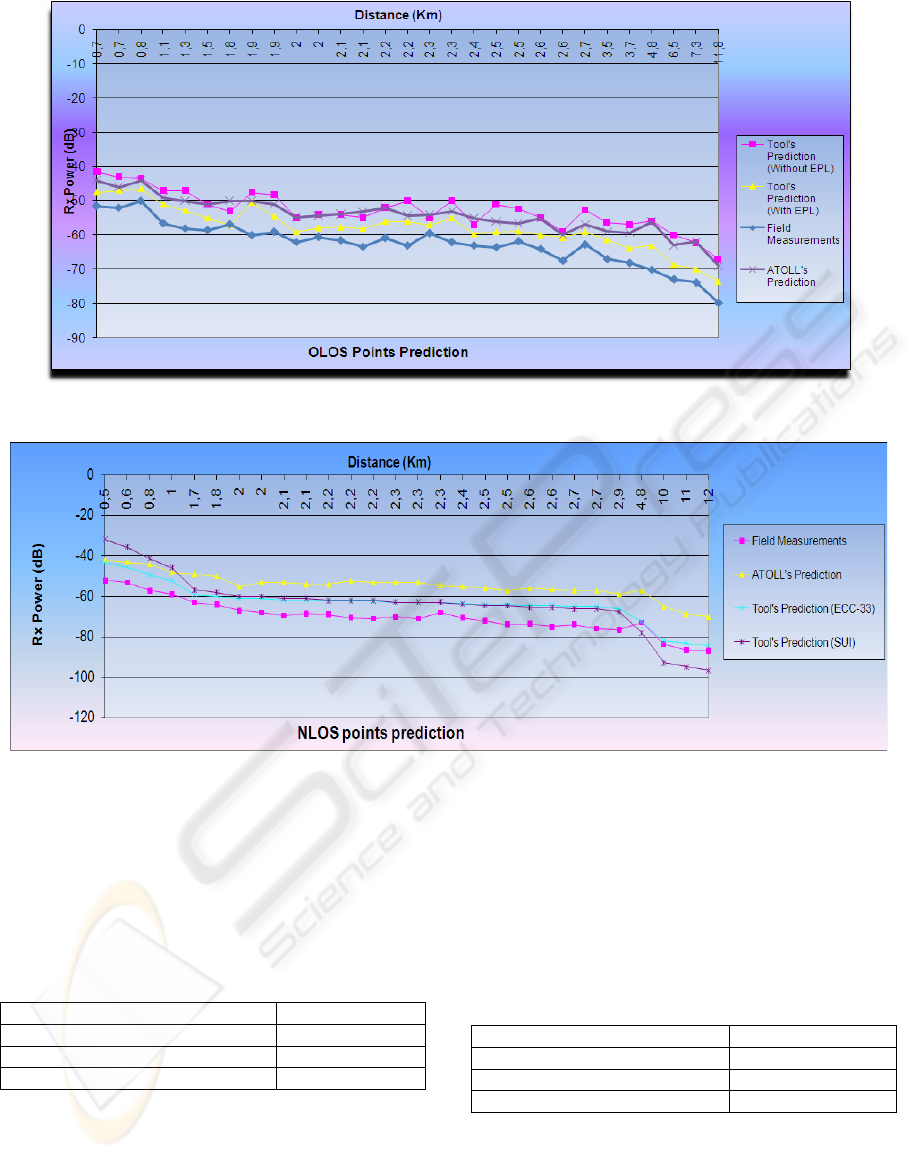
Figure 6: Comparison with measured values for OLOS areas.
Figure 7: Comparison with measured values for NLOS areas.
propagation. One possible justification for these
results is that even through reflected paths will
arrive at the receiver, the synchronization loop
within the receiver will lock on the first strongest
path, which is the LOS path, disregarding reflected
ones which will present minor interference.
Table 1: RMS error for OLOS areas.
Model used Error RMS
Commercial Benchmark tool 8.38
Developed Tool without EPL 9.89
Developed Tool with EPL 5.11
Areas having one or several obstructions within
their First Fresnel zone were classified as OLOS
areas. Figure 6 shows that the addition of the EPL
considerably improves the adherence of the results
compared to measured signal strengths.
Quantitatively the Root Mean Square (RMS) of the
error compared to measured values was assessed and
is given in Table 1.
Finally for NLOS area, two models were
potentially suitable: the ECC-33 and the SUI. Both
simulations were run to compare the adequacy for
our terrain. From Figure 7, ECC-33 seems to give
the closer results to the field measurements.
Quantitatively, Table 2 gives the average RMS error.
Table 2: RMS error for NLOS areas.
Model used Error RMS
Commercial Benchmark tool 12.94
Developed Tool ECC33 model 6.8
Developed Tool SUI model 8.11
5 CONCLUSIONS AND FUTURE
WORK
This paper presented the work conducted to develop
A FIELD-VALIDATED LOCATION CONSCIOUS QOS PREDITION TOOL FOR WLL NETWORKS
161

and validate a WLL planning tool. The approach
adopted in this paper was to use a GIS map of the
area to categorize the areas to be covered depending
on the presence of any obstructions between receiver
and transmitter. Three categories were retained:
LOS, OLOS and NLOS and appropriate propagation
models were used for each. The tool developed
provides a GUI based proposed BTS positions or a
simulation-based algorithm to propose optimized
placement. As with any QoS and prediction tool,
ultimate validation comes from field measurement
campaigns. Thanks to a partnership with a local
operator, access to collected measurements and
equipment to conduct further measurements
provided an environment for validating the tool. As
results showed, the tool prediction fared well and
gave in certain conditions better results than
benchmark commercial tools. The approach adopted
is hence validated by a 40% improvement in RMS
error for the OLOS case and a 47% improvement for
the NLOS case compared to commercial benchmark.
Another interesting observation is that SUI model
tend to give excessively optimistic results for
distances of less than 1 km and excessively
pessimistic results for distances above 10km
compared to ECC-33 model. Future work includes a
larger scale validation campaign in different
propagation environments and the introduction of
calibration parameters to better fit different terrains
and propagation environments.
REFERENCES
Stallings, W., 2005. Wireless Communications &
Networks, Prentice Hall, New Jersey, 2
nd
edition
Anderson H. R., 2003. Fixed Broadband Wireless System
Design. John Wiley & Co.
Athanasiadou G. E., Nix A. R., and McGeehan J. P. March
2000. “A microcellular ray-tracing propagation model
and evaluation of its narrowband and wideband
predictions” IEEE Journal on Selected Areas in
Communications, Wireless Communications series,
vol. 18, pp. 322–335.
Olexa R., 2005. Implementing 802.11, 802.16, and 802.20
Wireless Networks. Planning, Troubleshooting, and
Operations. Elsevier Press.
Abhayawardhana V.S., Wassell I.J., Crosby D., Sellars
M.P., Brown M.G., 2005. Comparison of empirical
propagation path loss models for fixed wireless access
systems, VTC 2005-Spring. IEEE 61st Volume 1,
Page(s): 73 - 77 Vol. 1
Rappaport, T, 1996. Wireless Communications Principle
and Practice, Prentice Hall.
Wimax Forum, 2008. Website, http://www.wimax.com/
Saunders S. R., 2006. Antennas and Propagation for
Wireless Communication Systems, Agilent
Technologies Press.
Moussaif Y., 2007 Validating and Enhancing a WIMAX
Network Planning Tool. Master’s Project Report, Al
AKhawayn University, Ifrane Morocco.
Bargach, M. A. 2006. Wimax Network Planning tool,
Master’s Project Report, Al AKhawayn University,
Ifrane Morocco.
Bouzekri, H., Bargarch, M. A., 2007 QoS prediction and
coverage optimization for WIMAX Networks,
Proceedings ICTIS07, Fez Morocco.
IEEE 802.16 standards, 2008. Website,, http://
www.ieee802.org/16
ESRI shapefile, 2008. Website,, http://www.esri.com/
WINSYS 2008 - International Conference on Wireless Information Networks and Systems
162
