
PROPAGATION PHENOMENA FOR INDOOR WIMAX
NETWORKS
Implications on Network Isolation and Security
Iñigo Cuiñas and Manuel García Sánchez
Universidade de Vigo, Dept. Teoría do Sinal e Comunicacións, rúa Maxwell, s/n, 36310 Vigo, Spain
Keywords: WiMAX, indoor, propagation, wireless LAN.
Abstract: The impressive success of wireless networks must be supported by research in the radio level, to assure the
performance of several networks sharing the same spectrum allocation and the same spatial position. This
work provides the data measured along several years of experimental research in the 5 GHz band, including
electromagnetic characterisation of different building materials, deterministic indoor radio channels
analysis, as well as non deterministic effects as those introduced by people moving or by furniture within a
static environment. Such information could be helpful for network designers to predict the network
characteristics and to prevent against possible external non authorised access or isolation problems.
1 INTRODUCTION
The radio systems deployment is continuously
growing in our homes and offices. Particularly,
wireless local area networks (commonly known as
WLANs) are being significantly developed among
worldwide organisations, intended for indoor
environments, with several data transmission speeds
(Dutta-Roy, 1999) (IEEE Standard 802.16a, 2003).
Wireless technology permits a faster deployment
and is more flexible than wired solutions.
Ray-tracing techniques have been widely used to
simulate the radio channel. After successive
improvements and corrections of these (and other)
prediction methods, simulation systems have
reached a high degree of accuracy. Deterministic
effects of the environment (due to building structure)
can be modelled, and the precision achieved depends
mainly on how accurate the building material
characterization is (Cuiñas and García-Sánchez,
2001). However, a good knowledge about the
behaviour of indoor environments at wireless LANs
frequency bands could not be completed by
deterministic simulation, as there are not
deterministic elements (furniture, decorative objects,
and the movement of people). Radio channel
measurements are, then, good solutions to estimate
values that are effective to improve the deterministic
results provided by ray-tracing simulators.
The proliferation of wireless local area networks
(WLANs) could be collapsed due to their own
success: the increasing number of systems using the
same spectrum allocation could force the active
LANs to continuously retransmit data, overloading
the spectrum bands as well as collapsing their own
transmission capacity.
Another problem is network protection: as users
do not need to be physically connected to the
system, they could access from places out of the
system manager’s control.
An exact prediction of coverage areas could help
to prevent unauthorised external accesses, as well as
to mitigate the interference between adjacent
networks by improving the isolation. This paper
provides helpful information for radio network
designers at 5.8 GHz. The section 2 contains the
description of the measurement system used along
the research in coordination of different positioning
equipments. The section 3 is focused on the
electromagnetic characterisation of building
materials, giving values that could be used to define
indoor environments at deterministic simulators. The
results of several radio channel measurement in line
of sight (LoS) and obstructed line of sight (OLoS)
conditions are presented in section 4. The non-
deterministic effects are exposed in sections 5 and 6,
devoted to the variability induced by furniture and
people in movement, respectively. Finally, the
seventh section summarises the conclusions
129
Cuiñas I. and García Sánchez M. (2008).
PROPAGATION PHENOMENA FOR INDOOR WIMAX NETWORKS - Implications on Network Isolation and Security.
In Proceedings of the International Conference on Wireless Information Networks and Systems, pages 129-134
DOI: 10.5220/0002021501290134
Copyright
c
SciTePress
extracted from those previously explained
experiments.
2 MEASUREMENT SYSTEM
A channel sounder based on the swept frequency
technique is the main element of the measuring
system. This sounder is built around a vector
network analyzer (VNA) HP-8510-C, capable of
measuring the S parameters of a quadripole in a
range up to 50 GHz. The quadripole is constituted
by the transmitter antenna, the propagation channel
and the receiver antenna, and it is commonly known
as radio channel. The S
21
parameter is the response
of that radio channel. Moreover, this S
21
parameter
measured along a frequency range is the frequency
response of the radio channel in the considered band.
3 BUILDING MATERIAL
CHARACTERISATION BY
REFLECTION
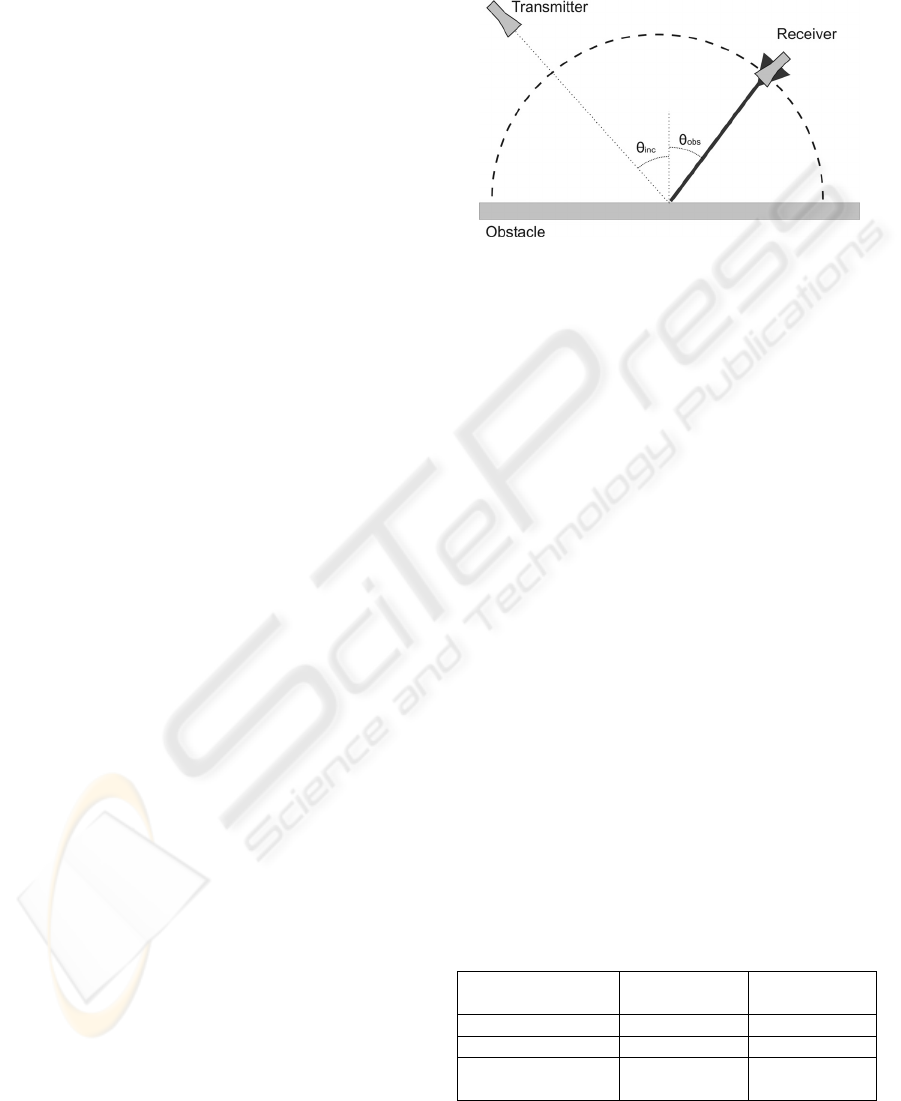
3.1 Measurement Setup and Procedure
The measurement set up for in situ characterisation
of reflection is configured in a bi-static manner. The
transmitter end of the measurement system consists
of the transmitter antenna, a standard gain pyramidal
horn, fed by a 20 dB-gain amplifier connected the
port 1 of the VNA through a 4-meter-long coaxial
cable. The receiver end consists of a horn antenna,
connected to the port 2 of the VNA by means of a
10-meter-long coaxial cable.
Both antennas are directed to the same point in
the reflective surface, called specular point. Whereas
the transmitter antenna is set on a rigid mast, the
receiver antenna is installed on the top of a mast
mounted on a wheeled trolley. The movement of this
platform is forced to be circular. The trolley is
linked to the surface obstacle by a 2.31 meter rigid
bar. The rotation centre is in the surface, just in the
vertical of the specular point. Receiver antenna
locations are selected along a 180 degree arc,
jumping one degree between adjacent ones (Cuiñas
et al., 1999). The system is installed on actual walls,
performing in situ reflection measurements, as
schematised in figure 1.
At each reception measurement point, VNA is
set to perform frequency sweeps from 5.72 GHz to
5.88 GHz, taking 801 points at each sweep. The
outcomes at each reception point are the result of
averaging 10 sweeps, to reduce the effect of noise.
Thus, the frequency response, centred at 5.8 GHz,
can be obtained at each measurement point.
Figure 1: Zenith view of the measurement setup.
The proposed measurement method is an
alternative to other techniques also known as in situ
(Sagnard and El Zein, 2005). In those experiments,
the authors used samples of the obstacles, instead of
actual walls as in the work here. The results of such
experiments have been used to compute the complex
permittivity of materials using reflection
ellipsometry (Sagnard and al., 2005). Although
Fresnel-based analysis techniques (Cuiñas et al.,
2007) could not exploit the complete range of
incidence angles, they appear to be less sensitive to
the adequacy between the geometrical parameters of
the setup and the physical properties of the sample.
3.2 Results
The table 1 summarises the complex permittivity of
each material (metallic surface, brick wall, chip
wood panel, and stone and concrete facade) for both
incident wave polarisation, measured by the authors
following the procedure described in (Cuiñas et al.,
2007). These values have been computed using the
internal successive reflection method (Burnside and
Burgener, 1983), which provides better accuracy in
computing electromagnetic characteristics from
reflection measurements than the direct application
of Fresnel coefficients.
Table 1: Complex permittivity of the different obstacles.
material Horizontal
polarisation
Vertical
polarisation
Brick wall 5.03-j0.14 4.75-j0.26
Chip wood panel 3.35-j0.35 3.17-j0.04
Stone/concrete
wall
2.04-j0.13 4.53-j0.61
WINSYS 2008 - International Conference on Wireless Information Networks and Systems
130
4 INDOOR RADIO CHANNEL
MEASUREMENTS
4.1 Measurement Setup and Procedure
Indoor wide-band radio channel measurements have
been performed with a high precision linear
positioning system, and two omnidirectional
antennas. The transmitter antenna was stationary
while the receiver was being moved along 2.5-m
linear paths. Data were taken every one-eighth of a
wavelength (Dossi et al., 1996). The positioning
system, which consists of a linear table with a
millimetre screw along it, improves the precision of
the positioning compared to moving the antenna by
hand. At each position, complex frequency
responses have been measured in a 160 MHz band
around 5.8 GHz, with a resolution of 200 kHz, due
to the 801 points in the frequency scan. As a
consequence, the sounder resolution in the delay
domain is 6.25 ns, while the maximum measurable
delay is 5 μs.
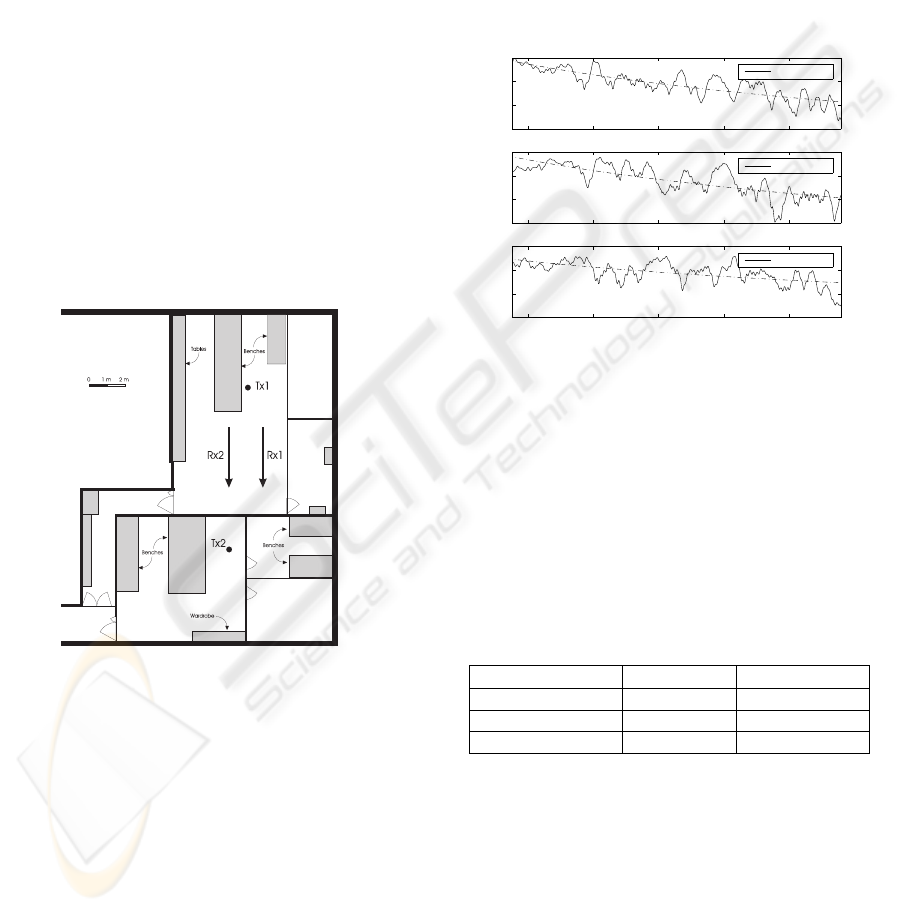
Figure 2: Map of the measured environments. LoS is
defined as situation 1, and OLoS as situation 2.
The indoor radio channel frequency response
was measured in two different environments, one in
LoS condition and the other in OLoS situation. The
measurements were taken in research laboratories,
with both computers and electronic equipment, and
its furniture is the typical of this kind of rooms:
office tables and chairs, and laboratory benches. The
positions of transmitter and receiver are depicted at
Figure 2. During the measurement campaign, the
transmitter was fixed at positions Tx1 and Tx2, and
the receiver was moved along the lines labelled as
Rx1 and Rx2, respectively. The points and paths
labelled as "1" correspond to LoS situation and the
labelled as "2" to OLoS. The wall that obstructs the
propagation channel between both antennas in the
second situation is made of bricks and concrete.
4.2 Results
The received power as a function of the position can
be obtained at any frequency in the measurement
range. The received powers measured along the LoS
path at 5.72 GHz, 5.8 GHz and 5.88 GHz, are shown
in Figure 3.
2 2.5 3 3.5 4
−55
−50
−45
−40
5.72 GHz
2 2.5 3 3.5 4
−55
−50
−45
−40
relative power level (dB)
5.80 GHz
2 2.5 3 3.5 4
−55
−50
−45
−40
distance to the transmitter (m)
5.88 GHz
Figure 3: Measured frequency response amplitude, LoS.
The power decays with the distance following a
curve of the form α d
n
. The table 2 summarises the
values of α and n that better fit the measured data.
The main trend is a reduction of the power level as
the distance increases.
Fast variations due to multipath propagation
appear in the plots, added to that main tendency.
These variations follow a Weibull distribution,
which is in agreement with (Hashemi et al., 1994).
Table 2: Parameters for the power decay law.
frequency (GHz)
α
n
5.72 -1.71 -1.16
5.8 -1.73 -1.18
5.88 -1.95 -0.67
The impulse response of the radio channel was
also calculated, and the mean square delay and the
coherence bandwidth computed. The value below
which the delay spread stays for 90% of the
positions is 8.8 ns, under LoS conditions. Measured
values agree with those reported in (Dersch and
Zollinger, 1994) at 2 GHz. For the obstructed
situation, the measured time dispersion is 17.4 ns.
This value almost doubles that found for the LoS,
due to the larger attenuation of the direct ray
PROPAGATION PHENOMENA FOR INDOOR WIMAX NETWORKS - Implications on Network Isolation and Security
131
crossing the brick wall, and the relative higher level
of reflections.
The coherence bandwidth is another parameter
describing the wideband behaviour of the
communication channel. The values over which the
coherence bandwidth stays for 90% of the locations
at 0.5, 0.7 and 0.9 correlation levels, at both
situations, are given in table 3. The OLoS coherence
bandwidth is smaller than LoS one.
Table 3: Values over which the coherence bandwidths
(MHz) are for 90% of locations in LoS and OLoS
situations.
Correlation level LoS OLoS
0.5 40.0 38.7
0.7 23.8 11.7
0.9 9.6 4.0
5 QUASI-STATIC EFFECTS ON
THE RADIO CHANNEL
5.1 Measurement Setup and Procedure
For this experiment, omnidirectional antennas were
used at both transmission and reception ends. The
figure 4 depicts the hall where the measurement
campaign was performed, indicating the location of
both transmitting and receiving antennas.
Dimensions are expressed in meters. Two series of
421 sets of data each were captured: the first one in
an empty environment (as designed in figure 1), and
the second one with the room furnished by tables,
chairs, wardrobes, and computer and office
appliances, in a typical office configuration. No
people were allowed to stay in the environment.
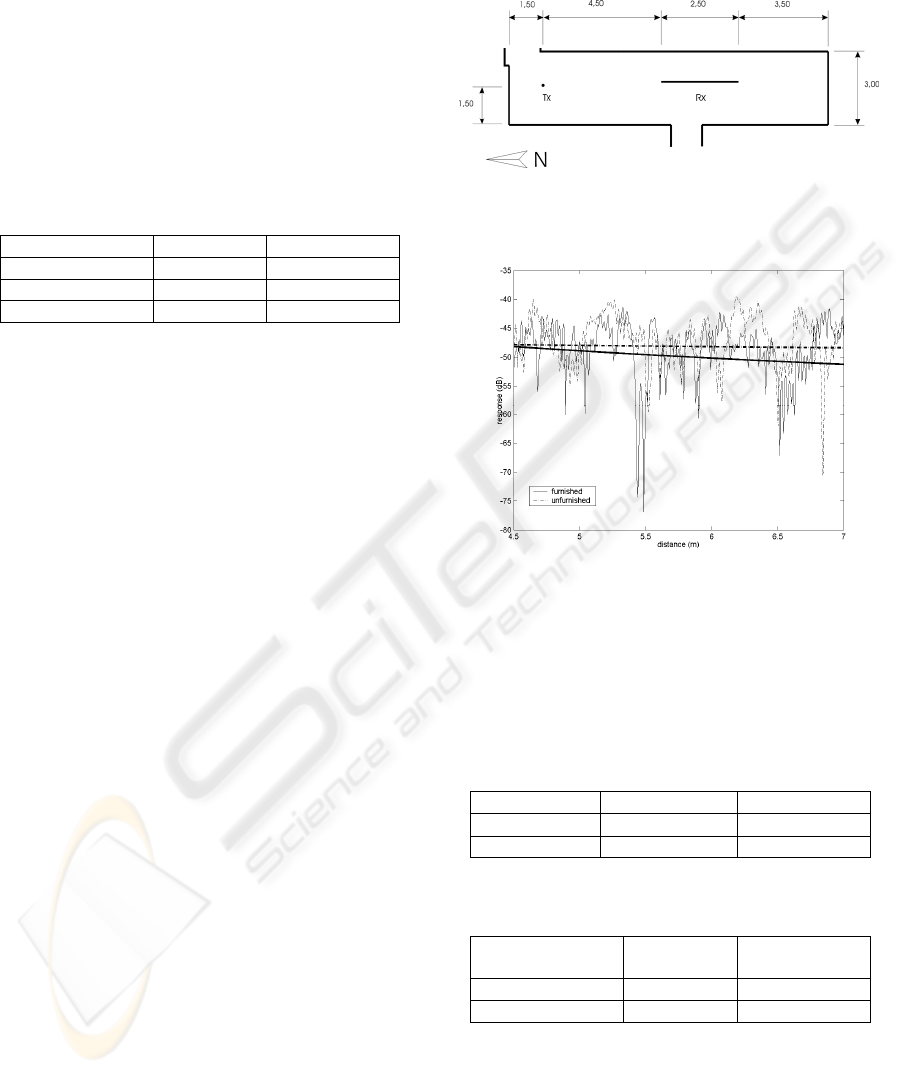
5.2 Results
Results show that the presence of furniture and
decorative objects deteriorates the performance of
the radio channel. The amplitudes of the complex
envelopes along the 2.5 meter path are depicted at
figure 5 for both furnished and unfurnished room, at
5.8 GHz. They are expressed in dB relative to
calibration level, obtained by directly connection of
transmitter and receiver: so, measurements contain
the response of antennas and propagation channel
The spatial variability appears to be modified by
the presence of the new elements in the
environment. Significant fading events could be due
to the high number of signal contributions arriving
to receiving antenna following different paths. This
is typical of indoor radio channels.
Figure 4: Measurement environment for furnishing effects
campaign.
Figure 5: Distance dependence of channel responses in
furnished and empty environments.
Results for α and n parameters at each situation
are shown in table 4. The rate of decay in the
furnished environment seems to be faster than in the
empty room.
Table 4: Parameters for the power decay law.
parameter Furnished room Empty room
α (dB)
-37.72 -46.02
n -0.80 -0.14
Table 5: Coherence bandwidth values (MHz) obtained in
furnished and empty environments.
Correlation level Furnished
room
Empty room
0.7 23.8 31.6
0.9 8.4 11.8
Coherence bandwidths have been also computed
from the measured responses. The table 5
summarises the measured coherence bandwidths.
When furnishing a room, coherence bandwidth is
reduced by 29% at 0.7 and 25% at 0.9.
WINSYS 2008 - International Conference on Wireless Information Networks and Systems
132
6 VARIATIONS ON THE RADIO
CHANNEL PARAMETERS DUE
TO PEOPLE MOVING
6.1 Measurement Setup and Procedure
At this time, the omnidirectional antennas were
placed in static locations during all the measurement
period. Transmitting antenna was situated in an
elevated location (at 2.5 meter high over floor level),
and receiving antenna at 1.5 meters.
Snapshot data, gotten at each 10 seconds, were
caught in series of 1 hour duration. At every
environment, six series of data were taken during
work time, which means six hours in total, and
another series during night, when it is assumed no
people is working. No movement of people was
forced or induced, being all traffic due to working or
personal needing. The variations are only due to
changes occurred in the environment along time.
Four different environments were used to
perform the experience: a computer lab, a research
lab, a corridor and a hall. The LoS conditions were
guaranteed in every environment at every time,
except when one or more people obstructed the
channel between both antennas.
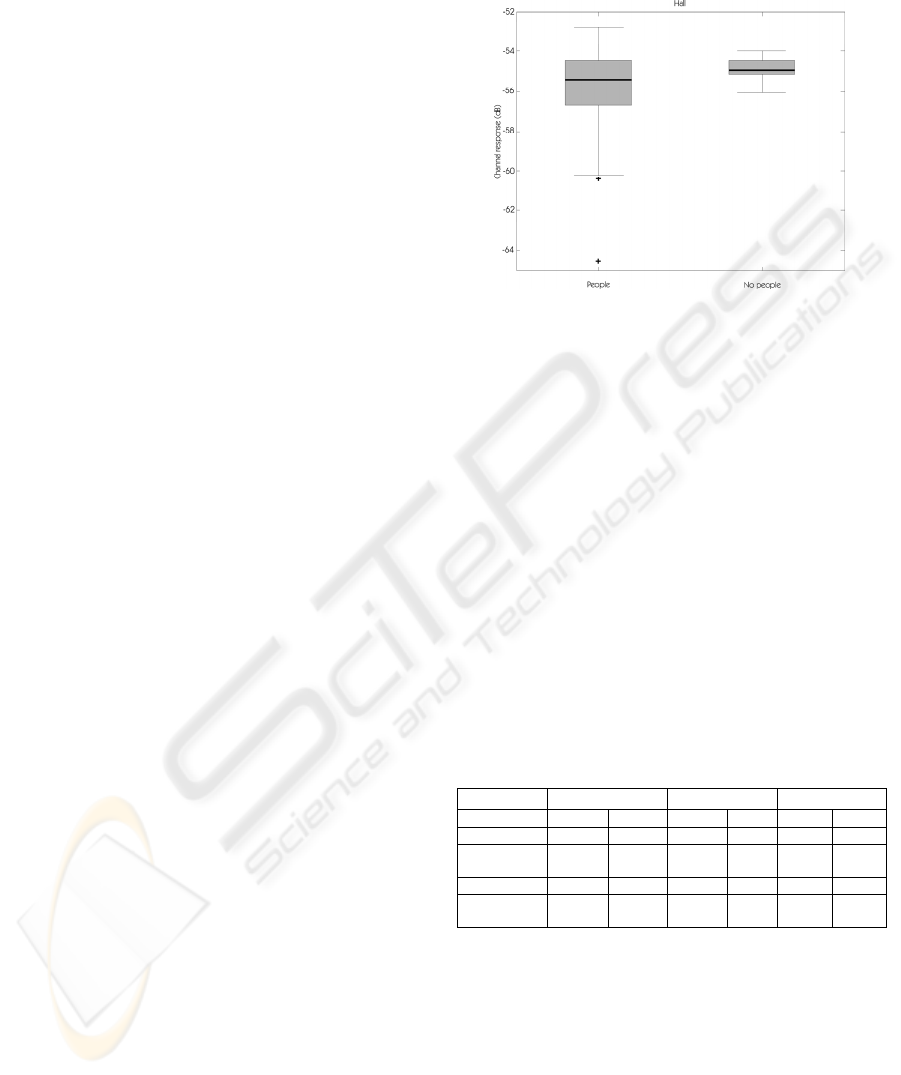
6.2 Results
The box plots computed using the measured data at
the hall are shown in figure 6. In this plot, the left
hand graphic corresponds to people in motion during
work time, whereas the right hand was obtained
during night time, with no people.
The box for quiet environment is thinner than for
the dynamic moments, which means that people in
motion introduce an important amount of variation
in received power level. The median value for
people in motion is almost the same than in the static
room, which indicates that no attenuation is induced
by the dynamic circumstances. Besides, the in-
motion plot shows lower outliers (represented as
crosses in the figure), which indicate a deeper fading
situation.
The median values are almost the same for quiet
and in-motion situations at each environment, but
the time variability of channel response grows with
movement of people. This can be concluded by
observing the inter quartile range (IQR) values for
every environment. Outliers occur mainly in people-
in-motion situations. This indicates that extreme
values of received power could occur with higher
probability when people are moving inside the
environment than when the space is quiet.
Figure 6: Comparison between daytime (people) and night
time (no people) situations at the hall.
The table 6 summarizes the results for the four
environments. Similar effects can be observed in the
four environments. Median values are almost the
same for moving and static situation, showing a
trend of slightly incrementing the attenuation in
occupied rooms. The time variability is increased
when people moves within the room. Increments in
time variability can be evaluated in between 14%, in
the computer lab, and 200%, in the hall. There may
be more persons moving, staying and crossing along
in the hall, which is a common area, than in the
computer lab, where only researchers working there
can access the facility. So, a relationship could be
established: the more people and movement, the
more time variability is reflected in the power level.
Table 6: Comparison of statistics corresponding to
different environments for people movement.
Median (dB) IQR (dB) Outliers
People yes no yes no yes no
Corridor -57.5 -57.2 1.5 0.9 yes no
Research
lab
-63.5 -62.4 2.2 1.4 yes no
Hall -55.4 -55 2.0 0.6 yes no
Computer
lab
-62.3 -62.3 1.6 1.4 yes no
The results appear to show that the movement of
people has small influence in long-time average
response of the channel, although it could be
strongly influent in short time periods.
PROPAGATION PHENOMENA FOR INDOOR WIMAX NETWORKS - Implications on Network Isolation and Security
133

7 CONCLUSIONS
This work provides the data measured along several
years of experimental research in the 5 GHz band,
including electromagnetic characterisation of
different building materials, indoor radio channels
analysis, as well as non deterministic effects as those
introduced by people moving or by furniture within
an static environment.
The complex permittivity values provided for
two orthogonal polarisations and three walls of
different kinds could be used in simulation tools to
define indoor environments constructed by typical
building materials.
A power decay law as a function of distance
between transmitter and receiver is also provided at
different environments in both LoS and OLoS
conditions. Fast variations due to multipath
propagation appear, added to this main tendency.
These variations follow a Weibull distribution.
Broad band radio channel parameters, as time
delay and coherence bandwidth, are presented in this
work.
Moreover, non-deterministic effects have been
also measured and reported. These added
contributions, which are due to the presence of
furniture or to people in motion within the
environment, could be modelled as a random
contribution added to the deterministic one.
Results show that the presence of furniture and
decorative objects deteriorates the performance of
the radio channel. The attenuation with distance
grows, as well as new fading events appear, as the
presence of new elements in the environment
produces reflection of waves and scattering. When
furnishing a room, coherence bandwidth is reduced
by 29% at 0.7 and 25% at 0.9 correlation levels,
probably due to the new multipath components that
are received as a result of the presence of more
scatterers in the environment.
The movement of people seems to have small
influence in long-time average response of the
channel (median received power), although it could
be strongly influent in short time periods. Besides,
punctual highly constructive or deeply destructive
interference can occur when people acts in the
environment.
This information could be helpful for network
designers to better predict the network performance
and to prevent possible external non authorised
access or isolation problems, as the more exact the
planning is, the less coverage problems could
appear.
ACKNOWLEDGEMENTS
This work has been supported by Xunta de Galicia,
Project Ref. PGIDIT05TAM32201PR.
REFERENCES
Burnside, W.D., Burgener, K.W., January 1983. “High
frequency scattering by a thin lossless dielectric slab”,
IEEE Transactions on Antennas and Propagation, vol.
Ap-31, no. 1, pp. 104-110.
Cuiñas, I., Sánchez, M.G., Pellicer, A.M., 1999.
“Integrated automated system for microwave
reflection coefficient measurement”, IAIA Third
International Conference on Industrial Automation,
Montreal (Canada).
Cuiñas, I., García Sánchez, M., March 2001. "Measuring,
Modeling and Characterizing of Indoor Radio Channel
at 5.8 GHz", IEEE Transactions on Vehicular
Technology, vol. 50, no. 2, pp. 526-535.
Cuiñas, I., Martínez, D., García Sánchez, M., Vázquez
Alejos, A., April 2007. “Modelling and measuring
reflection due to flat dielectric surfaces at 5.8 GHz”,
IEEE Transactions on Antennas and Propagation, vol.
55, no. 4, pp. 1139-1147.
Dersch, U., Zollinger, E., November 1994. "Propagation
mechanisms in microcell and indoor environments",
IEEE Transactions on Vehicular Technology, vol. 43,
no. 4.
Dossi, L., Tartara, G., Tallone, F., April 1996. "Statistical
Analysis of Measured Impulse Response Functions of
2.0 GHz Indoor Radio Channels", IEEE Journal on
Selected Areas in Communications, vol. 14, no. 3,
pp.405-410.
Dutta-Roy, A., December 1999. "Networks for Homes",
IEEE Spectrum, pp.26-33.
Hashemi, H., McGuire, M., Vlasschaert, T., Tholl, D.,
August 1994. "Measurements and modelling of
temporal variations of the indoor propagation
channel", IEEE Transactions on Vehicular
Technologies, col. 43, no. 3, pp. 733-737.
IEEE Standard 802.16a-2003, IEEE Standard for Local
and metropolitan area networks — Part 16: Air
Interface for Fixed Broadband Wireless Access
Systems — Amendment 2: Medium Access Control
Modifications and Additional Physical Layer
Specifications for 2-11 GHz.
Sagnard, F., El Zein, G., October 2005. “In situ
characterization of building materials for propagation
modelling: frequency and time responses”, IEEE
Transactions on Antennas and Propagation, vol. 53,
no. 10, pp. 3166-3173.
Sagnard, F., Bentabet, F., Vignat, C., June 2005, “In situ
measurements of the complex permittivity of materials
using reflection ellipsometry in the microwave band:
experiments (Part II)”, IEEE Transactions on
Instrumentation and Measurement, vol. 54, no. 3, pp.
1274-1282.
WINSYS 2008 - International Conference on Wireless Information Networks and Systems
134
