
VEGETATION INDEX MAPS OF ASIA TEMPORALLY
SPLINED FOR CONSISTENCY THROUGH A HIGH
PERFORMANCE AND GRID SYSTEM
Shamim Akhter
1
, Kento Aida
1,2
1
Information Processing Department,Tokyo Institute of Technology, Japan
2
National Institute of Informatics, Japan
Yann Chemin
International Rice Research Institute (IRRI), Philippines
Keywords: NDVI, Remote Sensing, LMF, High Performance Computing, Grid.
Abstract: Vegetation Index Map provides the crop density information over a precise region. Remote Sensing (RS)
images are at the basis of creating such map, while the decision-maker requirement stands for Vegetation
Index Maps at various in-country administrative levels. However, RS image includes data noises due to
influence of haze or cloud especially in the rainy season. Temporally Splined procedure such as Local
Maximum Fitting (LMF) can be applied on RS images for ensuring the data consistency. Running the LMF
procedure with single computer takes impractical amount of processing time (approx. 150 days) for Asia
regional RS image (46 bands/dates, 3932 rows, 11652 columns). Importing the LMF on High Performance
Computing (HPC) platforms provides with a time optimization mechanism, and LMF has been implemented
in cluster computers for this very purpose. A single cluster LMF processing timing still did not perform
within an acceptable time range. In this paper, the LMF processing methodology to reduce processing time
by combining the parallelization of data and task together on multi-cluster Grids is presented.
1 INTRODUCTION
Vegetation Index Maps are useful for crop
modelling such as crop acreage estimation (Xu et al.
2005), plant stress detection (Zarco-Tejada et al.
2004), global vegetation (Ochi and Murai,1995) etc.
NDVI (Normalized Difference Vegetation Index) is
the most commonly used vegetation index. NDVI
uses a normalized difference of Visible and Near
Infrared reflectance bands from RS satellite imagery.
It monitors density and vigour of green vegetation
growth.
The Local Maximum Fitting (LMF) algorithm
was developed by (Sawada et al. 2001). LMF uses
temporally splined procedure by combining the time
series filtering and functional fitting for removing
clouds, hazes and other atmospheric effects from
time series data of each pixel and ensure the data
consistency (Sawada et al. 2002).
A parallel LMF has been approached and
implemented (Akhter et al., 2007). However, that
parallel LMF implementation still holds a
computational resource scalability problem. Thus,
LMF takes too long in its actual 1 CPU set up, and
even on small clusters it is not feasible for
processing large areas. Therefore, necessity arises
for a new approach to process LMF with data
distribution technology.
This paper first solves the scalability problem in
cluster based parallel LMF and then removes the
other LMF limitations by approaching two new
LMF processing methodologies, row distribution
and row column distribution, with cluster based
parallel LMF. Additionally, a new methodology of
the LMF procedure for Grid based parallel
computing is also introduced in this paper for
solving the large processing time problem.
284
Akhter S., Aida K. and Chemin Y. (2008).
VEGETATION INDEX MAPS OF ASIA TEMPORALLY SPLINED FOR CONSISTENCY THROUGH A HIGH PERFORMANCE AND GRID SYSTEM.
In Proceedings of the Third International Conference on Software and Data Technologies - ISDM/ABF, pages 284-287
DOI: 10.5220/0001885902840287
Copyright
c
SciTePress

2 LMF THEORY
LMF has been used by many researches as a tool to
remove the atmospheric effects from RS data, e.g.,
Nagatani et al. (2002), Sawada (2001), Shulian and
Susaki (2006), Wada and Ohira (2004). Due to large
processing time, an OpenMP based LMF has been
implemented. Since multi computer based
distributed systems (cluster and Grid) have a larger
processing capacity for a lower cost, naturally,
choice turns towards developing a parallel LMF
procedure to run on distributed platforms. A cluster
based parallel LMF procedure was approached and
implemented in (Akhter et al. 2007).
The LMF is a time series processing which
integrates the time series filtering and the fitting
processing. Local Maximum Filtering is shown in
Equation (1).
()
()
⎥
⎦
⎤
⎢
⎣
⎡
⋅⋅⋅
⋅⋅⋅
=
+++
+−+−
1wt1tt
t2wt1wt
t
d,,d,dMax
,d,,d,dMax
Min'd
(1)
t.at time data modified isd'
dow,filter win theis wt,timeatdataObserved:d
t
t
∑
=
+
⎟
⎠
⎞
⎜
⎝
⎛
∏
+
⎟
⎠
⎞
⎜
⎝
⎛
∏
++=
N
1t
1
1t2
1
t210t
M
tk2
cosc
M
tk2
sinctccf
(2)
Here, c
i
(i=0,1,2t,2t+1) are coefficient(s), t: Time,
N: Number of time series data, M: Number of data
for 1 cycle for each harmonic curve, e.g. M=36,
means 36 images/year, k
i
: Periodic function by
assuming that six periods (1 month, 2 months, 3
months, 4 months, 0.5 year, 1 year) might be used
e.g. {1, 2, 3, 4, 6, 12}. These six periodic functions
are implemented during the initial step. Equation (2)
is converted to the sin curve function.
∑
=
⎭
⎬
⎫
⎩
⎨
⎧
⎟
⎠
⎞
⎜
⎝
⎛
+
∏
++=
n
1i
i
i
i101
x
M
tk2
sinAtccf
(3)
Here, A
i
is amplitude and x
i
is phase lag of sine
curve. In this study, we use these A
i
and x
i
parameters calculated from initial step of LMF
processing. To remove the effects of clouds, hazes
and system noises, the time-series filtering and the
fitting processing are repeated until the optimum
result functions are obtained. To avoid over-fitting,
Akaike Information Criterion (AIC,2007) is used to
choose limited numbers of independent variables in
the model for stable prediction.
Serial LMF procedure is divided into three parts.
(i) Pre LMF (pre-LMF), (ii) LMF procedure, (iii)
Post LMF (post-LMF). Different temporal bands
(date wise sorted) images are stacked together to one
image and provided to LMF. The temporal band
images (1, 2, …, n) are stacked together and
consider as a 3-D matrix, where Image columns= X-
axis, Image lines (rows) =Y-axis, and temporal
bands=Z-axis. Only a single row from the 3-D
matrix is extracted and placed into a 2-D matrix,
where each column of 2-D matrix contains different
band values for each column pixel from the
extracted row (3-D matrix).This whole process is
called pre-LMF. For each iteration, each column of
that 2-D matrix, executes the LMF method.
For (Col 1, Col2 ,…, Col N)
For (Row1, Row2 ,…,Row N)
LMF (, , ,)
The calculated and processed pixel values are
again written to the same column of the 2-D matrix
and then placed in the 3-D matrix (as the same way
they were extracted). This process after executing
LMF is called post-LMF.
To make the LMF procedure parallel the pre-
LMF and post-LMF processes are not modified.
LMF procedure is broken down for simple units for
parallelism. LMF process will work parallel by
executing more than one column of that 2-D matrix
at the same time.
3 IMPLEMENTATION SCHEMES
AND EXPERIMENTAL
RESULTS
Two different sizes (small and large) images were
used for the purpose of these experiments. The small
image was provided from (Chemin, Y., 2006). This
is a concatenation image of 136 band images with
dimensions of 38 rows and 37 columns. The large 8-
days aggregated images of MODIS (Moderate
Resolution Imaging Spectroradiometer) were
downloaded from (EDC, 2007). The large images
were imported from HDF to GeoTiff by the help of a
Unix shell script using a command-line tool from the
Modis Reprojection Tool (MRT,2007). Eventually,
the Geospatial Data Abstraction Layer tool (GDAL,
2007) was used to convert GeoTiff to ENVI format.
Other processing on images were done with Dr.
Honda’s image handling library (HONDA, 2007).
Different methodological approaches were also
taken to increase the parallel efficiency as well as
the working capability of LMF procedure.
3.1 Distribution Strategies on Cluster
The first approach is to remove the scalability
problem from the cluster based parallel LMF
VEGETATION INDEX MAPS OF ASIA TEMPORALLY SPLINED FOR CONSISTENCY THROUGH A HIGH
PERFORMANCE AND GRID SYSTEM
285
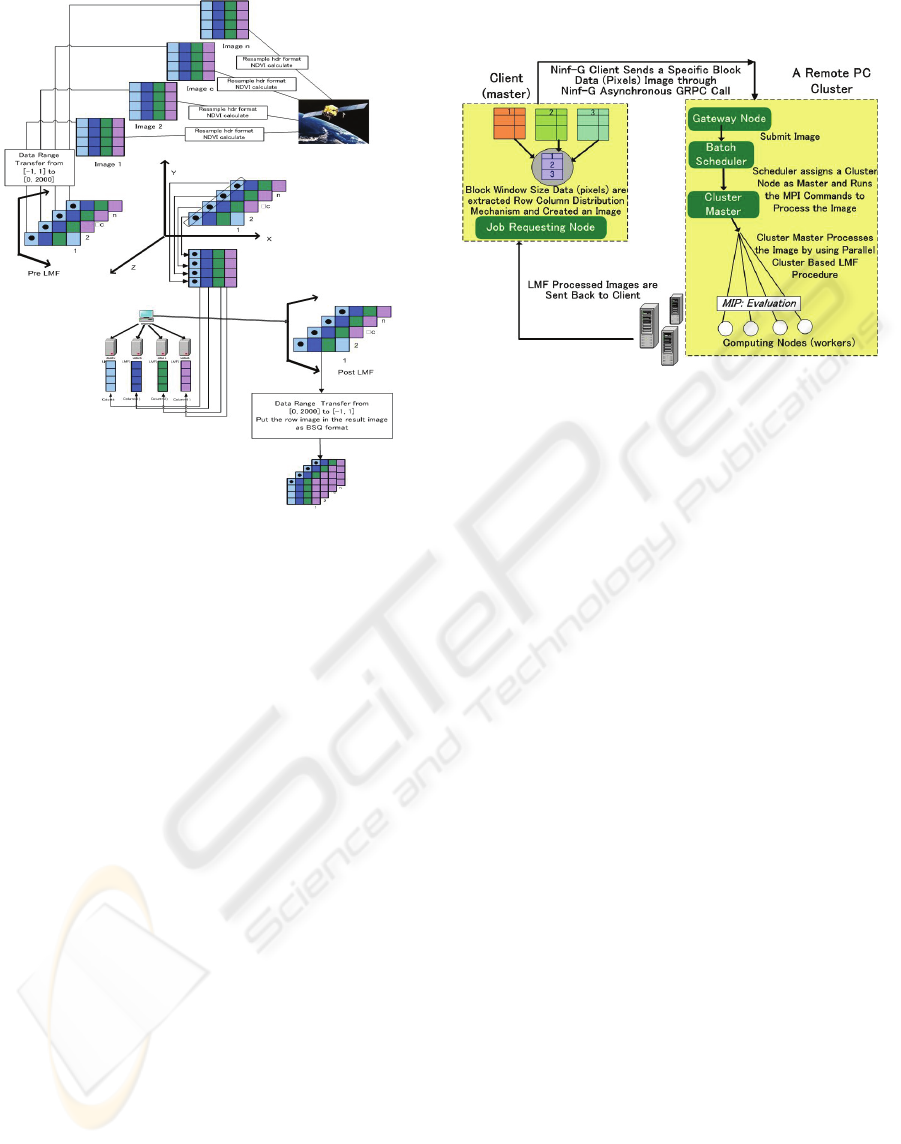
Figure 1: Row Distribution Cluster based Parallel LMF.
(Akhter et al., 2007). The improved MPI FORTRAN
LMF code can now run with any number of
computing nodes. First, we processed LMF with
small image (136 bands 38 rows and 37 columns) by
implementing on a cluster with 22 computing nodes.
In Fig. 1, all the temporal images are
individually processed as a LMF requirement. A
script was developed to read each row from all
temporal images and stack them together to form a
row-image. Each row-image is then passed into the
parallel LMF model for processing. However,
increasing the column numbers will generate a
software segmentation fault. This happens because
of the data storing constraint inside the programming
environment. A new and generic approach is then
required.
As a result, both row-wise and column-wise
distribution mechanism was implemented. In this
methodology, all the temporal images in column
direction are all virtually (programmatically)
partitioned into a desirable block. The block window
size (BWS) needs to be chosen according to the
image data type. In our script, we used a threshold
value (7000) for window size selection so that the
column data will be equally distributed. Thus, from
each column portion, each row of all temporal
images will be merged together to become a row
image and then processed by cluster based parallel
LMF. The original MODIS data sample with 136
bands, 38 rows and 37 columns were used for
experiments. On a 16 nodes cluster testbed the
highest speedup with cluster based LMF
Figure 2: Grid based LMF Methodology.
(Akhter et al., 2007) was 4.11. Removing the
scalability constrains from cluster based LMF gains
the speedup to 16 with row based distribution.
However, due to the additional communication
overhead, the speedup with the generic row column
based distribution approach (with BWS=2) falls to 8.
Increasing computation nodes to the level, where the
number of parallel task distribution meets or lower
to the total row based. Additionally, the row column
distribution technique is applied on a large image
(46 bands, 3952 rows and 11952 columns) with
parallel LMF (because it is more generic than
others). The experiment processed only 20 rows on a
22 computing nodes cluster. It was traced that to
process one row takes around 78 seconds. Thus,
with cluster based computing, an image of 3952
rows will take around 308256 (3952x78) seconds,
3.57 days. This is still an unacceptable processing
time. To increase the efficiency of the LMF
processing time, large computational power is
required and that can be provided by Grid
computing technology.
3.2 Distribution Strategies on Grid
To increase the LMF runtime performance, a Grid
based LMF implementation is required. The basic
principle of this methodology is the hierarchical
parallel implementation (Fig. 2). Where the Grid
master node applies the row column distribution
mechanism creating a row wise image and then
sends that row-image to each cluster master for LMF
processing. Each cluster master then uses the MPI
based parallel LMF to process the row image in
distribute manner with the help of its worker nodes.
After completing the LMF process, the cluster
ICSOFT 2008 - International Conference on Software and Data Technologies
286

master sends back the result image to Grid master.
Grid master then stores the processed image segment
to its output image and it continues again. The Grid
master uses GridRPC calls (Nakada, H. et al, 2002)
for distributing image to cluster master and that
calling mechanism is implemented on the Ninf-G
(Takada, Y. et al, 2003) programming framework.
4 CONCLUSIONS
In this paper, several approaches were explained to
improve the parallel cluster based LMF, so that it
runs on large dimensional RS image. Two different
data distribution mechanisms, the row distribution
and the row column distribution, were successfully
implemented and their timing behaviour was
compared. Although row column distribution takes
the highest timing among three cluster based
parallel LMF approaches, it is the most generic
approach for LMF processing and fruitfully applied
in the large RS image LMF processing. The
accuracy of the new methodologies was traced and
compared with previous LMF outputs and the level
of accuracy was 100%. Full automated script was
developed that helped the user (without vast
knowledge in RS) to process their application easily
with LMF system. Due to the large processing time,
LMF is required to implement in Grid testbed. A
Grid based implementation methodology was
proposed with the new LMF data distribution
technique. In near future, the authors plan to
evaluate the Grid based LMF performance. A web
based portal is required for supporting online LMF
processing service. Additionally, the authors also
plan to examine crop calendar pattern through LMF
process.
REFERENCES
AIC,2007,http://en.wikipedia.org/wiki/Akaike_informatio
n_criterion)
Akhter, S., Sarkar, I., Rabbany, K. G., Akter, N., Akhter,
S., Chemin, Y., and Kiyoshi, H., 2007, Adapting the
LMF Temporal Splining Procedure From Serial
toMPI/Linux Clusters, Journal of Computer Science 3
(3): 130-133, ISSN 1549-3636, © 2007 Science
Publications.
Chemin, Y., and Honda, K., 2006, Spatio-temporal fusion
of rice actual evapotranspiration with genetic
algorithms and an agro-hydrological model, IEEE
Transactions on Geoscience and Remote Sensing,
Vo.44, No. 11, pp.3462-3469.
EDC (Eros Data Centre), 2007,
(http://edcimswww.cr.usgs.gov/pub/imswelcome/).
GDAL, 2007: http://www.remotesensing.org/gdal/)
HONDA, 2007: (http://rslultra.star.ait.ac.th/~honda/
textbooks/advdip/utilHonda.zip).
MRT,2007:http://lpdaac.usgs.gov/landdaac/tools/modis/)
Nagatani, I., Saito, G., Toritani, H., and Sawada, H., 2002,
Agricultural Map of Asia Region Using Time Series
AVHRR NDVI Data, Proceedings Online of the 23rd
Asian Conference on Remote Sensing, 25-29
November 2002, Birendra International Convention
Centre in Kathmandu, Nepal. Available online at:
http://www.gisdevelopment.net/aars/acrs/2002/pos2/1
84.pdf
Nakada, H., Matsuoka, S., Seymour, K., and Dongarra, J.,
2002, GridRPC: A Remote Procedure Call API for
Grid Computing, GWD-I (Informational), Advanced
Programming Models Research Group,
http://www.eece.unm.edu/˜apm/docs/APMGridRPC07
02.pdf, July 2002.
Ochi, S., and Murai, S., 1995, Monitoring Global
Vegetation Degradation Using NOAA NDVI Data,
Proceedings of Asian Conference of Remote Sensing
1995.
Sawada, H., Sawada, Y., Nagatani, I., and Anazawa, M.,
2001. Proceeding for the 1st regional seminar on geo-
informatics for Asian eco-system management.
Sawada, H. and Y. Sawada, 2002. Modeling of vegetation
seasonal change based on high frequency observation
satellite. Environmental Information Science Papers.
Vol. 16.
Shulian, N., and Susaki, J., 2006, Detection of
Agricultural, Drought in Paddy Fields using NDVI
from MODIS Data: A case study in Burirum Province,
Thailand, Proceedings. Proceedings of International
Geoscience and Remote Sensing Symposium
(IGARSS2006), pp. 4076-4079, Aug, 2006
Tanaka, Y., Nakada, H., Sekiguchi, S., Suzumarn, T., and
Matsuoka, S., 2003, Ninf-G: A Reference
Implementation of RPC –based Programming
Middleware for Grid Computing. Journal of Grid
Computing, Vol.1, 41-51.
Wada, Y., and Ohira, W., 2004, Reconstructing Cloud
SPOT/Vegetation Using Harmonic Analysis with
Local Maximum Fitting, 25
th
ACRS2004,Chiang
mai,Thailand.
Xu. W., Huang, J., Tian, Y., Zhang, Y., and Sun, Y., 2005,
A method of estimating crop acreage in large-scale by
unmixing of MODIS data, Geoscience and Remote
Sensing Symposium, IGARSS '05. Proceedings. 2005
IEEE International Volume 4, Issue , 25-29 July 2005
Page(s): 2987 – 2990.
Zarco-Tejada, P.J., Berjón, A., and Miller, J.R., 2004,
Stress Detection in Crops with Hyperspectral Remote
Sensing and Physical Simulation Models, Proceedings
of the Airborne Imaging Spectroscopy Workshop -
Bruges, 8 October 2004.
VEGETATION INDEX MAPS OF ASIA TEMPORALLY SPLINED FOR CONSISTENCY THROUGH A HIGH
PERFORMANCE AND GRID SYSTEM
287
