
A NOVEL APPROACH TO MODEL AND EVALUATE
DYNAMIC AGILITY IN SUPPLY CHAINS
Vipul Jain and Lyès Benyoucef
INRIA COSTEAM Project, ISGMP Bat. A, Ile du Saulcy, 57000 Metz, France
Keywords: Agility, fuzzy logic, multi-agents, supply chain management.
Abstract: In this paper, we propose a novel approach to model agility and introduce Dynamic Agility Index (DA
Li
)
through fuzzy intelligent agents. Generally, it is difficult to emulate human decision making if the
recommendations of the agents are provided as crisp, numerical values. The multiple intelligent agents used
in this study communicate their recommendation as fuzzy numbers to accommodate ambiguity in the
opinion and the data used for modeling agility attributes for integrated supply chains. Moreover, when
agents operate based on different criteria pertaining to agility like flexibility, profitability, quality,
innovativeness, pro-activity, speed of response, cost, robustness etc for integrated supply chains, the ranking
and aggregation of these fuzzy opinions to arrive at a consensus is complex. The proposed fuzzy intelligent
agents approach provides a unique and unprecedented attempt to determine consensus in these fuzzy
opinions and effectively model dynamic agility. The efficacy of the proposed approach is demonstrated with
the help of an illustrative example.
1 INTRODUCTION
An agile supply chain is seen as a dominant
competitive advantage in today’s business; however,
the ability to build an agile supply chain has
developed more slowly than anticipated (Lin et al.,
2006). The need for agility for competitiveness has
traditionally been associated with the supply chains
that provide and manufacture innovative products,
such as high-technology industry products
characterized by shortened life-cycles, a high degree
of market volatility, uncertainty in demand, and
unreliability in supply. Similarly, traditional, more
slow moving industries face such challenges in
terms of requirements for speed, flexibility,
increased product diversity and customization.
Consequently, the need for agility is becoming more
prevalent. These demands come, typically, from
further down the supply chain in the finishing sector,
or from end customers (Gunasekaran and Ngai,
2004).
According to Kidd (1994), Supply Chain
Management (SCM) is a fairly well defined topic,
but agility is not so well defined. Agility can be
something that companies achieve without realizing
it, or it can relate to issues that are difficult to
quantify. The nature of the competencies implied by
agility is such that they would be better considered
as intangibles, similar to intellectual property,
company specific knowledge, skills, expertise, etc.
In summary, SCM and agility combined are
significant sources of competitiveness in the
business world. Thus, it is no surprise that they are
favored research areas in the academic research
world (Swafford et al., 2006).
The fact that agile attributes are necessary but
not sufficient conditions for agility points to a major
research issue to be addressed (Yusuf et al. 2004). It
is essential that the attributes are transformed into
strategic competitive bases of speed, flexibility,
proactivity, innovation, cost, quality, profitability
and robustness. More importantly, these attributes
are of very little significance to practitioners unless
there is a way of deploying them. In addition, the
changing nature of the market requirements suggests
the need for a dynamic deployment tool for
evaluating agility.
There is a growing body of literature on different
aspects of agility (Jain et al. 2008). Collectively,
these contributors and many others (Kumar and
Motwani, 1995), provide insights to what constitute
attributes of an agile supply chain. However, there is
no methodology and tools for introducing and
implementing such a complex and dynamic
93
Jain V. and Benyoucef L. (2008).
A NOVEL APPROACH TO MODEL AND EVALUATE DYNAMIC AGILITY IN SUPPLY CHAINS.
In Proceedings of the Tenth International Conference on Enterprise Information Systems - SAIC, pages 93-100
DOI: 10.5220/0001684500930100
Copyright
c
SciTePress

interactive system as agile supply chains (Lin et al.,
2006).
Whilst the needs of integrated supply chain
networks have been to a large extent identified, there
is a lack of suitable and commercially available tools
to satisfy these. Therefore, a new generation tools
should be developed and the existing tools
significantly enhanced to support decision-making
processes and to deliver required solutions to
extended businesses. Most agility measurements are
described subjectively by linguistic terms, which are
characterized by ambiguity and multi-possibility.
Thus, the scoring of the existing techniques can
always be criticized, because the scale used to score
the agility capabilities has two limitations:
Such techniques do not take into account the
ambiguity and multi-possibility associated
with the mapping of one’s judgment to a
number, and
The subjective judgment and the selection and
preference of evaluators have a significant
influence on those methods.
1.1 Extracted Motivations
Based on the above discussions, we have extracted
the following motivations for this study:
Motivation 1: All companies, suppliers,
manufacturers, distributors, and even customers,
may have to be involved in the process of achieving
an agile supply chain (Christopher and Towill,
2001).
Motivation 2: The lack of a systematic approach
to agility does not allow companies to develop the
necessary proficiency in change, a prerequisite for
agility ( Lin et al., 2006).
Motivation 4: Most agility measurements are
described subjectively by linguistic terms, which are
characterized by ambiguity and multi-possibility.
Thus, the scoring of the existing techniques can
always be criticized, because the scale used to score
the agility capabilities has limitations (Lin et al.,
2006).
Motivation 5: The fact that agile attributes are
necessary but not sufficient conditions for agility
points to a major research issue to be addressed
(Yusuf et al. 2004). It is essential that the attributes
are transformed into strategic competitive bases of
speed, flexibility, proactivity, innovation, cost,
quality, profitability and robustness.
Motivation 6: There is no methodology and
tools for introducing and implementing such a
complex and dynamic interactive system which
incorporate both quantitative and qualitative
attributes as agile supply chains (Lin et al., 2006).
1.2 Outlines and our Contributions
In embracing integrated agile supply chain many
important questions concerning agility need to be
asked (Jharkaria and Shankar 2005) such as:
What precisely is agility and how it can be
measured?
How to develop an integrated agile supply
chain?
How will agile supply chains know what they
have it, as there are no simple metrics or
indexes available?
How and to what degree does the integrated
agile supply chain attributes affect supply
chains business performance?
How to compare agility with competitiveness?
How can the integrated supply chains identify
the principal obstacles to improvement, if a
supply chain wants to improve agility?
How to assist in achieving agility effectively?
Answers to such questions are critical to the
practitioners and to the theory of integrated agile
supply chains design. However, it is difficult to
emulate human decision making if the
recommendations of the agents are provided as
crisp, numerical values. Intelligent agents must
express their opinions in similar terms to emulate
human experts. Moreover at times, the agents make
their recommendations based upon incomplete or
unreliable data. A second problem arises when
intelligent agents base their opinions on different
viewpoints.
Therefore, we introduce a novel concept of
Dynamic Agility Index (DA
Li
) to model agility in
integrated supply chains. More specifically, this
paper describes an effort in developing an approach
to determine a consensus without requiring that the
agent opinions have any agreement for modeling
agility attributes in integrated supply chains. The
multiple intelligent agents used in the paper
communicate their recommendation as fuzzy
numbers to accommodate ambiguity in the opinion
and the data used for supply chains.
2 AGILITY AND SUPPLY CHAIN
Parallel developments in the areas of agility and
SCM led to the introduction of an agile supply chain
(Christopher 2000). While agility is accepted widely
as a winning strategy for growth, even a basis for
ICEIS 2008 - International Conference on Enterprise Information Systems
94

survival in certain business environments, the idea
of creating agile supply chains has become a logical
step for companies. Agility in a supply chain,
according to Ismail and Sharifi (2005), is the ability
of the supply chain as a whole and its members to
rapidly align the network and its operations to
dynamic and turbulent requirements of the
customers. The main focus is on running businesses
in network structures with an adequate level of
agility to respond to changes as well as proactively
anticipate changes and seek new emerging
opportunities.
Agile supply chain concerns change, uncertainty
and unpredictability within its business environment
and makes appropriate responses to changes.
Therefore, an agile supply chain requires various
distinguishing capabilities, or “fitness”. These
capabilities include four main elements:
Responsiveness, which is the ability to identify
changes and respond to them quickly,
reactively or proactively, and also to recover
from them;
Competency, which is the ability to efficiently
and effectively realize enterprise objectives;
Flexibility/adaptability, which is the ability to
implement different processes and apply
different facilities to achieve the same goals;
Quickness/speed, which is the ability to
complete an activity as quickly as possible.
Van Hoek (2005) observes that three
characteristics of supply chain operations can be
earmarked as directly related to becoming agile: 1)
mastering and benefiting from variance, 2) rapid
responsiveness, and 3) unique or small volume
responsiveness. In addition, many researchers
provide conceptual overviews, different reference
and mature models of agility (Christopher 2000,
Yusuf et al. 2004, Ismail and Sharifi (2005)).
There has been quite a clear vision of the
benefits of creating an agile supply chain. However,
there is a shortage of studies and cases of companies
actually turning the vision or ambition into reality,
let alone tools that they use to do so. It is essential
that the attributes are transformed into strategic
competitive bases of speed, flexibility, proactivity,
innovation, cost, quality, profitability and
robustness. More importantly, these attributes are of
very little significance to practitioners unless there is
a way of deploying them. In addition, the changing
nature of the market requirements suggests the need
for a dynamic deployment tool. This forms the
motivation for our problem environment, which is
described in the next section of the paper.
3 PROBLEM ENVIRONMENT
The agility in supply chains is determined by certain
time variables, which we refer to here as ‘agility
characteristics’. The rate of change of these
characteristics is a function of the current values of
all the attributes as well as some suitable ‘input’
variables, like the size and numbers of teams,
refereed as team formation, the level of integration
of the database. The proposed dynamic agility index
(DA
Li
) of an integrated supply chain can be given a
numerical value calculated as the sum of the
products of suitable ‘economical bases’, i.e.
1234
567 8
Li X T L V
R
RTB
D
AWFWPWQWI
WPWS WCWR
=
×+×+×+×
+
×+×+× +×
Where:
1. F
X
is a measure of Flexibility, and W
1
is a
weight assumed constant but time varying in
general,
2. P
T
is a measure of Profitability, and W
2
is a
weight assumed constant but time varying in
general,
3. Q
L
is a measure of Quality, and W
3
is a weight
assumed constant but time varying in general,
4. I
V
is a measure of Innovation, and W
4
is a
weight assumed constant but time varying in
general,
5. P
R
is a measure of Profitability, and W
5
is a
weight assumed constant but time varying in
general,
6. S
R
is a measure of Speed of response, and W
6
is
a weight assumed constant but time varying in
general,
7. C
T
is a measure of Cost, and W
7
is a weight
assumed constant but time varying in general,
8. R
B
is a measure of Robustness, and W
8
is a
weight assumed constant but time varying in
general,
Let us assume that these variables form the
output vector (
OT
) of the dynamical agility model,
i.e.
(1,2,3,4,5,6,7,8)
(,, ,,,, ,)
XT LVRR TB
OT OT OT OT OT OT OT OT OT
FPQIPSCR
=
=
The mathematical model developed is based on
dynamical systems theory and recognizes that the
integrated supply chains attributes have evolutionary
approaches.
A NOVEL APPROACH TO MODEL AND EVALUATE DYNAMIC AGILITY IN SUPPLY CHAINS
95

4 THE PROPOSED APPROACH
WITH AN ILLUSTRATIVE
EXAMPLE
In this section, we present an illustrative example for
the proposed Fuzzy Intelligent agent framework to
study and model the agility for integrated supply
chains. The stepwise procedure is shown as follows:
Step 1: Select criteria for evaluation. Based on
the literature, we have listed several important
criteria for modeling agility for evaluation of
integrated supply chains. These include the
following: Flexibility (F
X
), Profitability (P
T
), Quality
(Q
L
), Innovation (I
V
), Pro-activity (P
R
), Speed of
response (S
R
), Cost (C
T
), Robustness (R
B
).
An agile supply chain must be able to withstand
the aforementioned variations and disturbances and
indeed must be in a position to take advantage of
these fluctuations to maximize their profits. These
selected eight criteria’s and their possible
combinations abbreviated as (C
0
, C
1
, C
2
, C
3
, C
4
, C
5
,
C
6
, C
7
, C
8
) are listed in Table 1. The agility of
integrated supply chains can be given a numerical
value calculated as the sum of the products of the
aforementioned criteria and their possible
combinations as given in Table 1. The eight
criteria’s listed above are by no means exhaustive
and therefore new factors may be added depending
on the product, industry and market characteristics.
Step 2: Determine the appropriate linguistic
scale to assess the performance ratings and
importance weights of the agility capabilities. An
agile supply chain means that the production process
must be able to respond quickly to changes in
information from the market. This requires lead time
compression in terms of the flow of information and
material and the ability to change at short notice, to
change to a wide variety of products. In many cases,
it is virtually impractical for agents to directly
determine the score of a vague indicator, such as
measure of quality or the speed of response or
innovation. Therefore, in this research, linguistic
terms are used to assess the performance rating and
importance weights of the agility capabilities for
integrated supply chains.
Noteworthy, many popular linguistic terms and
corresponding membership functions have been
proposed for linguistic assessment. In addition, the
linguistic variables selected to assess the importance
weights of the agility capabilities are {Very High
(VH), High (HG), Fairly High (FH), Medium (M),
Fairly Low (FL), Low (L), Very Low (VL)}.
Step 3: Measure the importance and the
performance of agility capabilities using linguistic
terms. Once the linguistic variables for evaluating
the performance ratings and the importance weights
of the agility capabilities are defined, according to
the supply chains policy and strategy, profile,
characteristics, business changes and practices,
marketing competition information, the agents can
directly use the linguistic terms above to assess the
rating which characterizes the degree of the
performance of various agility capabilities.
The results, integrated performance ratings and
integrated importance weights of agility capabilities
measured by linguistics variables, are shown in
Table 2.
Step 4: Approximate the linguistic terms by
fuzzy numbers. We perform trapezoidal
approximations of fuzzy numbers. Tapping the
properties of trapezoidal fuzzy numbers, a set of
fuzzy numbers for approximating linguistic variable
values was developed as shown in Table 3.
Step 5: Cumulate fuzzy opinions with fuzzy
weights. Several aggregation techniques require that
the fuzzy opinions have some intersection so that
they are not entirely out of agreement. In case, the
opinions do not have some agreement, the agents
negotiate until they can arrive at a consensus.
However, these methods will not be considered, as
agents assumed in this research may intentionally
have disparate recommendations due to their diverge
viewpoints for supply chain management.
Weighted linear interpolation is used to
aggregate the opinions for every alternative, incase,
there is no common interaction between agent
opinions. Each agent,
ξ
, is assigned a rating,
ξ
ψ
.
The most crucial agent is specified a rating of 1 and
the others are given ratings less than 1, in relation to
their significance. To the ratings the following
properties holds:
Maximum (
1
ψ
,
2
ψ
,
3
ψ
…,
δ
ψ
) = 1
Minimum (
1
ψ
,
2
ψ
,
3
ψ
…,
δ
ψ
) < 1
The degree of significance (DOS) is defined as:
1
DOS 1,2,3,...,
ξ
ξ
δ
ξ
ξ
ψ
ξ
δ
ψ
=
=Π = =
∑
(1)
The cumulated fuzzy opinion for alternative
η
is formed as a Trapezoidal fuzzy number (TFN)
tuple (
,
1
,
2
,
3
4
) using formulas:
ICEIS 2008 - International Conference on Enterprise Information Systems
96

112 2
11
3344
11
,,
,
δδ
ξξ ξ ξ
ξξ
δδ
ξξ ξξ
ξξ
λλ
λλ
==
==
⎧
=Π =Π
⎪
⎪
⎨
⎪
=Π =Π
⎪
⎩
∑∑
∑∑
(2)
where
δ
is the number of agents with opinions
on alternatives
η
,
ξ
Π corresponds to the degree of
significance of agent
ξ
and (
ξ
λ
1
,
ξ
λ
2
,
ξ
λ
3
,
ξ
λ
4
)
symbolizes TFN opinion of agent
ξ
for alternative
η
. The resulting inferred aggregated opinion
(
,
1
,
2
,
3
4
) can be represented as:
()
*
1
*
)( RRI
A
D
∑
=
Π=
δ
ξ
ξ
(3)
where
*
R
= (
ξ
λ
1
,
ξ
λ
2
,
ξ
λ
3
,
ξ
λ
4
) and )(D is the
fuzzy multiplication operator.
Thus, the trapezoidal fuzzy membership function
is used to determine the agility level and the required
fuzzy index of the selected criteria can be calculated
as above equation (3).
0
(7, 8, 9,10) (0.7, 0.8,0.9,1.0) (7,8,9,10) (0.7,0.8,0.9,1.0)
(7,8,9,10) (0.7, 0.8,0.9,1.0) (7,8,9,10) (0.35,0.45,0.55,0.65)
(7, 8, 9,10) (0.5,0.6,0.7, 0.8) (7,8,9,10) (0.7, 0.8,0.9,1.0)
(7,8,9,10) (0.35,0.
R
⊗⊕⊗
⊕⊗ ⊕⊗
⊕⊗ ⊕ ⊗
⊕⊗
=
45,0.55,0.65) (7,8,9,10) (0.5,0.6,0.7, 0.8)
(0.7, 0.8,0.9,1.0) (0.7, 0.8,0.9,1.0) (0.7, 0.8,0.9,1.0)
(0.35,0.45,0.55,0.65) (0.5,0.6,0.7,0.8) (0.7,0.8,0.9,1.0)
(0.35,0.45,0.55,0.65) (0.5,0.6,0.7
⎡⎤
⎢⎥
⎢⎥
⎢⎥
⎢⎥
⊕⊗
⎣⎦
⊕⊕
⊕⊕⊕
⊕⊕
(7,8,9,10)
,0.8)
=
⎡⎤
⎢⎥
⎢⎥
⎢⎥
⎣⎦
Applying the same equation the other fuzzy
indexes of agility criteria are obtained. Finally,
applying the same equation again, we calculate the
proposed Dynamic Agility level index (DA
Li
) for
modeling agility for integrated supply chains with
the taken 8 criteria and their all possible
combinations is evaluated as:
(7,8,9,10) (0.7,0.8,0.9,1.0)
(5,6.04,7,8) (0.5,0.6,0.7,0.8)
(3.49,4.51,5.5,6.52) (0.7,0.8,0.9,1.0)
(2.52,3.5,4.5,5.56) (0.5,0.6,0.7, 0.8)
(3.5,4.5,5.5,6.5) (0.35,0.45,0.55,0.65)
(5,6,7,8) (0.5,0.6
Li
DA
⊗
⊕⊗
⊕⊗
⊕⊗
⊕⊗
⊕⊗
=
,0.7,0.8)
(3.52,4.5,5.48, 6.25) (0.7,0.8,0.9,1.0)
(5,6, 7,8) (0.35,0.45,0.55,0.65)
(0.7,0.8,0.9,1.0) (0.5,0.6,0.7, 0.8)
(0.7,0.8,0.9,1.0) (0.5,0.6,0.7,0.8)
(0.35,0.45,0.55,0.65) (0
⎡⎤
⎢⎥
⎢⎥
⎢⎥
⎢⎥
⎢⎥
⎢⎥
⎢⎥
⎢⎥
⎢⎥
⊕⊗
⎢⎥
⊕⊗
⎣⎦
⊕
⊕⊕
⊕⊕
(4.544,5.486, 6.352,6.982)
.5,0.6,0.7,0.8)
(0.7,0.8,0.9,1.0) (0.35,0.45,0.55,0.65)
=
⎡⎤
⎢⎥
⎢⎥
⎢⎥
⎢⎥
⊕⊕
⎣⎦
Step 6: Rank the fuzzy opinions. The superior
alternative must be chosen, once the opinions of the
agents have been aggregated to produce a consensus
opinion for each alternative. The findings of
Nakamura (1986) emphasize a fuzzy preference
function that outline a comparison index, which
compares opinions
i
k and
j
k that accounts for the
hamming distance of every fuzzy number to the
fuzzy minimum and the fuzzified best and worst
states. The FFCF is defined as:
(
)
()
()
** *
** *
,
1
0
1,
(, )
1
0
2
ii j
ii j
pi j
KK K
if
KK K
KK
if
β
β
β
βχ
ϖ
ϖ
βχ
μ
ϖ
⎧
⎡⎤
∧
⎪
⎢⎥
≠
⎪
⎢⎥
+− ∧
=
⎣⎦
⎨
⎪
=
⎪
⎩
(4)
where :
(
)
(
)
()()
** * ** *
** * ** *
,,
(1 ) , ,
ii j ji j
ii j ji j
KK K K K K
KK K K K K
β
ϖβχ χ
βχ χ
⎡
⎤
=
∧+ ∧ +
⎣
⎦
⎡
⎤
−∧+∧
⎣
⎦
{}
VSup
K
K
∈∀
=
≥
φ
θ
μ
φ
μ
φθθ
)()(
*
(5)
Further,
*
K is the highest upper set of
K
defined by:
{}
*
() ()
KK
Sup V
θθ φ
μ
φμθφ
≤
=
∀∈
(6)
ji
KK
∧
is the extended minimum defined by
{}
,
() [ () ()]
ij i j
KK K K
Sup V
θφθ φ σ
μ
σμθμφσ
∧
∧=
=
∧∀=
(7)
and the Hamming distance between
i
K and
j
K is
given by
),(
ji
KK
χ
, which is
(, ) () ()
ij
ij K K
KK d
ε
χ
μθ μθ θ
=−
∫
(8)
Theoretically,
(
)
***
,
jii
KKK ∧
χ
and
(
)
***
,
jii
KKK ∧
χ
signifies the advantages of
i
K
over
j
K with respect to the fuzzified worst states
and the fuzzified best states. The fraction of the
weighted combination of the advantages of
i
K and
j
K over the worst states and the above the best
states, to the sum of such weighted combinations of
i
K ’s and
j
K ’s is represented by the fuzzy first
choice function (FFCF),
),(
jip
KK
μ
.
In this paper, the fuzzy first choice function
compares every fuzzy opinion to a “Standard” fuzzy
number, which demonstrates the case where the
opinion is “Most Likely”. Hence, the difficulty with
existing methods suffers when comparing fuzzy
numbers with identical modes and symmetric
spreads is eliminated. Also, in this paper, the fuzzy
A NOVEL APPROACH TO MODEL AND EVALUATE DYNAMIC AGILITY IN SUPPLY CHAINS
97

opinions are not only judge against “Most Likely”
fuzzy numbers but also are already ranked in
contrast to this value, thus eliminating the procedure
of determining the ranking based on pairwise
comparison. The result of every fuzzy first choice
calculation for every node presents its ranking. The
FFCF evaluating opinion
i
K and the most likely
mode, M, substitutes the second fuzzy opinion with
M and is defined as:
(
)
()
()
** *
** *
,
1
0
1,
(, )
1
0
2
ii j
ii
pi
KK K
if
KK M
KM
if
β
β
β
βχ
ϖ
ϖ
βχ
μ
ϖ
⎧
⎡⎤
∧
⎪
⎢⎥
≠
⎪
⎢⎥
+− ∧
=
⎣⎦
⎨
⎪
=
⎪
⎩
(9)
The FFCF can be simplified by showing that
(
)
** *
, 0
ii
KK M
χ
∧ = , when M is a TFN defined as
12
(, ,1,1)
λ
λ
. Thus, if M is signified by
12
(, ,1,1)
λ
λ
, the modified fuzzy first choice
function used to evaluate opinion
i
K
with the most
likely mode, M, is defined as:
()
*
**
(, )
1
,0
1
0
2
pi
ii
KM
KK M if
if
β
β
β
μ
βχ ϖ
ϖ
ϖ
=
⎧
∧≠
⎪
⎪
⎨
⎪
=
⎪
⎩
(10)
where :
** *
*
**
*
*
*
(, ) (, )
(1 ) ( , )
ii i
i
KK M MK M
MK M
β
ϖβχ χ
βχ
⎡⎤
=∧+∧
⎣⎦
+− ∧
This fuzzy first choice function is able to
distinguish between fuzzy numbers with identical
modes and symmetric spreads while reducing the
computational complexity. Ranks for dynamic
agility index for selected agility criteria are given in
Table 4.
Step 7: Match the fuzzy opinions with an
appropriate agility level. In this case the natural
language expression set selected is given as:
Exceedingly Agile (EA), Very Agile (VA),
Agile (AG), Fairly Agile (FA), Most Likely Agile
(MLA), Slowly Agile (SA), No Agile (NA).
The linguistics and the corresponding
membership functions are shown in Figure 6. The
Euclidean distance ED is calculated by using the
Euclidean distance formula as given in Equation
(11) below:
()
1
2
2
(,) () ()
LL
LN AG F
xP
ED AG F f x f x
∈
⎛⎞
=−
⎜⎟
⎝⎠
∑
(11)
Where
{
}
[
]
01
, ,..., 0, 10
m
Pxx x=⊂ so that
01
0...10
m
xx x
=
<<< =.
The ED for the selected set of natural expression
set is given as: ED (EA)= 1.2364, ED(VA)= 0.0424,
ED(AG)= 1.0241, ED(FA)= 1.1462, ED(MLA)=
1.5321, ED(SA)= 1.6422 and ED(NA)= 1.8041.
Thus, by matching a linguistic label with the
minimum ED, dynamic agility can be modeled with
the given criteria’s. From the Figure 6, it can be
seen that the selected eight criteria (F
X
, P
T
, Q
L
, I
V
,
P
R
, S
R
, C
T
, R
B
), the supply chain falls under the Very
Agile (VA) category. Depending on the selected
criteria, for any supply chains, the proposed
approach will help the decision makers and analysts
in quantifying agility.
Step 8: Analyze and classify the main obstacles
to improvement. Modeling agility not only measures
how agile is integrated supply chain, but also most
importantly helps supply chain decision makers and
practitioners to assess distinctive competencies and
identify the principal obstacles for implementing
appropriate improvement measures. In supply chain
network, the factual environment of the problem
engrosses statistics, which is repeatedly fuzzy and
indefinite. As customer’s demands are always
uncertain, manufacturers tend to manage their
suppliers in different ways leading to a supplier-
supplier development, supplier evaluation, supplier
association, supplier coordination etc.
5 CONCLUSIONS AND
PERSPECTIVES
In this paper, we propose a novel approach to model
agility and introduce Dynamic Agility Index (DA
Li
)
through fuzzy intelligent agents The proposed
approach concentrates on the application of
linguistic approximating, fuzzy arithmetic and agent
technology is developed to address the issue of
agility measuring, stressing the multi-possibility and
ambiguity of agility capability measurement.
When agents operate based on different criteria
pertaining to agility like flexibility, profitability,
quality, innovativeness, pro-activity, speed of
response, cost, robustness, etc., for integrated supply
chains, the ranking and aggregation of these fuzzy
opinions to arrive at a consensus is complex.
ICEIS 2008 - International Conference on Enterprise Information Systems
98

Although, the dynamic agility index is conveyed
in a range of values, the proposed approach ensures
that the decision made in the selection using the
fuzzy intelligent agents will not be biased. For the
numerical example considered in this study, the
dynamic agility index has a fuzzy value of
(4.544,5.486,6.352,6.982), which falls under Very
Agile (VA) category. Thus, it gives the decision
makers a high degree of flexibility in decision-
making.
As a scope for future work, empirical research is
required to study the application of the model
developed in this paper and to characterize agility in
integrated supply chains. Moreover, we are
involving in European project I*Proms, with several
industrial partners, we expect to apply the proposed
approach to model agility in real life scenarios.
ACKNOWLEDGEMENTS
These researches are supported by the European
Community research program, through the NoE
I*Proms (http://www.iproms.org/). These supports
are gratefully acknowledged.
REFERENCES
Christopher, M. and Towill D., 2001, An integrated model
for the design of agile supply chains. International
Journal of Physical Distribution & Logistics, 31 (4),
234-246.
Christopher, M., 2000, The Agile Supply Chain:
Competing in Volatile Markets. Ind. Marketing
Management, 29(1), 37-44.
Gunasekaran, A. and Ngai E.W.T., 2004, Information
systems in supply chain integration and management.
European Journal of Operational Research, 159, 269–
295.
Ismail, H.S. and Sharifi H., 2005, Supply Chain Design
for supply Chain: A balanced approach to building
agile supply chain. Proceedings of the International
Conference on Agility – ICAM 2005, Finland, 187–
193.
Jain, V., Benyoucef, L. and Deshmukh, S. G., 2008, A
new approach for evaluating agility in supply chains
using fuzzy association rules mining. Engineering
Applications of Artificial Intelligence (international
journal), 21(4).
Jharkharia, S. and Shankar R., 2005, IT-enablement of
supply chains: understanding the barriers. Journal of
Enterprise Information Management, 18(1/2), 11–27.
Kidd, P.T., 1994, Agile Manufacturing. Forging New
Frontiers (Addison-Wesley, London).
Kumar, A. and Motwani J., 1995, A Methodology for
Assessing Time-based Competitive Advantage of
Manufacturing Firms, International Journal of
Operations and Production Management, 15(2), 36-
53.
Lin, C-T., Chiu, H. and Chu, P-Y., 2006, Agility index in
the supply chain. International Journal of Production
Economics,100, 285–299.
Nakamura, K., 1986, Preference relations on a set of fuzzy
utilities as a basis for decision making. Fuzzy Sets and
Systems, 1986, 20(2), 147-162.
Swafford, P. M., Ghosh, S. and Murthy, N. N., 2006, A
framework for assessing value chain agility.
International Journal of Operations and Production
Management, 26(2), 118-140.
van Hoek, R., 2001, Epilogue: Moving forwards with
agility. International Journal of Physical Distribution
and Logistics Management, 31(4), 290-300.
Yusuf,Y. Y., Gunasekaran, A., Adeleye, E. O. and
Sivayoganathan, K., 2004, Agile supply chain
capabilities: Determinants of competitive objectives.
European Journal of Operational Research, 159, 379-
392.
Figure 1: The proposed dynamic agility index (DA
Li
) for the illustrative example.
0 0.5 1 1.5 2 2.5 3 3.5 4
4.5
55.5
6
6.5
7
7
Agility
μ
N
A SA MLA FA AG VA EA
D
A
Li
A NOVEL APPROACH TO MODEL AND EVALUATE DYNAMIC AGILITY IN SUPPLY CHAINS
99
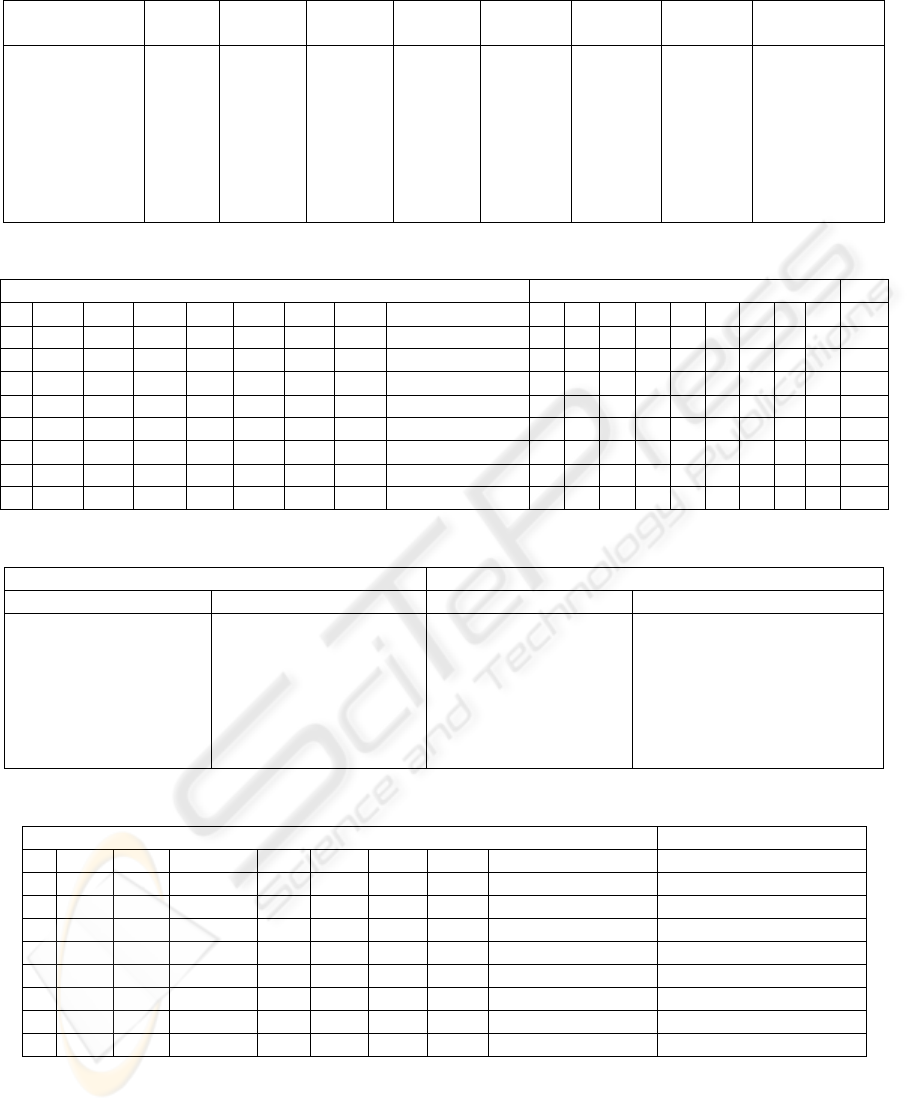
Table 1: Criteria’s for modeling dynamic agility.
Combination C
0
of
criteria
Combination
C
1
of criteria
Combination
C
2
of criteria
Combination
C
3
of criteria
Combination
C
4
of criteria
Combination
C
5
of criteria
Combination
C
6
of criteria
Combination
C
7
of criteria
Combination
C
8
of criteria
Flexibility (F
X
)
Profitability (P
T
)
Quality (Q
L
)
Innovation (I
V
)
Pro-activity (P
R
)
Speed & response (S
R
)
Cost (C
T
)
Robustness (R
B
)
F
X
P
T
F
X
Q
L
F
X
I
V
F
X
P
R
F
X
S
R
F
X
C
T
F
X
R
B
P
T
Q
L
P
T
I
V
P
T
P
R
P
T
S
R
P
T
C
T
P
T
R
B
Q
L
I
V
Q
L
P
R
Q
L
S
R
Q
L
C
T
Q
L
R
B
I
V
P
R
I
V
S
R
I
V
C
T
I
V
R
B
P
R
S
R
P
R
C
T
P
R
R
B
S
R
C
T
S
R
R
B
C
T
R
B
F
X
P
T
Q
L
I
V
P
R
S
R
C
T
R
B
Table 2: Aggregated performance rating with aggregated important weight for selected agility criteria.
Criteria Weight Rank
C
0
C
1
C
2
C
3
C
4
C
5
C
6
C
7
C
8
W
0
W
1
W
2
W
3
W
4
W
5
W
6
W
7
W
8
R
0-8
F
X
F
X
P
T
P
T
Q
L
Q
L
I
V
I
V
P
R
P
R
S
R
S
R
C
T
C
T
R
B
F
X
P
T
Q
L
I
V
P
R
S
R
C
T
R
B
VH VH VH FH H VH FH H VH EP
P
T
F
X
Q
L
P
T
I
V
Q
L
P
R
I
V
S
R
P
R
C
T
S
R
R
B
H H VH H FH H VH VG
Q
L
F
X
I
V
P
T
P
R
Q
L
S
R
I
V
C
T
P
R
R
B
VH VH H VH VH VH GD
I
V
F
X
P
R
P
T
S
R
Q
L
C
T
I
V
R
B
H FH FH VH FH FR
P
R
F
X
S
R
P
T
C
T
Q
L
R
B
FH VH H FH GD
S
R
F
X
C
T
P
T
R
B
H M VH FH
C
T
F
X
R
B
VH FH VG
R
B
FH GD
Table 3: Fuzzy numbers for approximating linguistic variables for selected agility criteria.
Performance rating Importance weighting
Linguistic variable Fuzzy number Linguistic variable Fuzzy number
Worst (WT)
Very Poor (VP)
Poor (PR)
Fair (FR)
Good (GD)
Very Good (VG)
Exceptional (EP)
(0, 0.05, 0.25, 1.25)
(1, 2, 3, 4)
(1.5, 2.5, 3.5, 4.5)
(2.5, 3.5, 4.5, 5.5)
(3.5, 4.5, 5.5, 6.5)
(5, 6, 7, 8)
(7, 8, 9, 10)
Very Low (VL)
Low (LW)
Fairly Low (FL)
Medium (MD)
Fairly High (FH)
High (HG)
Very High (VH)
(0, 0.005, 0.025, 0.125)
(0.1, 0.2, 0.3, 0.4)
(0.15, 0.25, 0.35, 0.45)
(0.25, 0.35, 0.45, 0.55)
(0.35, 0.45, 0.55, 0.65)
(0.5, 0.6, 0.7, 0.8)
(0.7, 0.8, 0.9, 1.0)
Table 4: Ranks for dynamic agility index for selected agility criteria.
Criteria Rank
C
0
C
1
C
2
C
3
C
4
C
5
C
6
C
7
C
8
R
0-8
F
X
F
X
P
T
P
T
Q
L
Q
L
I
V
I
V
P
R
P
R
S
R
S
R
C
T
C
T
R
B
F
X
P
T
Q
L
I
V
P
R
S
R
C
T
R
B
(7, 8, 9, 10)
P
T
F
X
Q
L
P
T
I
V
Q
L
P
R
I
V
S
R
P
R
C
T
S
R
R
B
(5, 6.04, 7, 8)
Q
L
F
X
I
V
P
T
P
R
Q
L
S
R
I
V
C
T
P
R
R
B
(3.49, 4.51, 5.50, 6.52)
I
V
F
X
P
R
P
T
S
R
Q
L
C
T
I
V
R
B
(2.52, 3.50, 4.50, 5.56)
P
R
F
X
S
R
P
T
C
T
Q
L
R
B
(3.50, 4.50, 5.50, 6.50)
S
R
F
X
C
T
P
T
R
B
(5, 6, 7, 8)
C
T
F
X
R
B
(3.52, 4.50, 5.48, 6.25)
R
B
(5, 6, 7, 8)
ICEIS 2008 - International Conference on Enterprise Information Systems
100
