
ANOMALY DETECTION ALGORITHMS IN
BUSINESS PROCESS LOGS
F´abio Bezerra and Jacques Wainer
IC-UNICAMP, Campinas, S˜ao Paulo, Brazil
Keywords:
Anomaly Detection, Process Mining, Business Process Systems.
Abstract:
In some domains of application, like software development and health care processes, a normative business
process system (e.g. workflow management system) is not appropriate because a flexible support is needed to
the participants. On the other hand, while it is important to support flexibility of execution in these domains,
security requirements can not be met whether these systems do not offer extra control, which characterizes a
trade off between flexibility and security in such domains. This work presents and assesses a set of anomaly
detection algorithms in logs of Process Aware Systems (PAS). The detection of an anomalous instance is based
on the “noise” which an instance makes in a process model discovered by a process mining algorithm. As a
result, a trace that is an anomaly for a discovered model will require more structural changes for this model
fit it than a trace that is not an anomaly. Hence, when aggregated to PAS, these methods can support the
coexistence of security and flexibility.
1 INTRODUCTION AND
MOTIVATION
In some application domains, such as software de-
velopment and hospital processes, the process con-
trol can not be normative as the control provided by
workflowmanagementsystems. In these domains, the
business process is not completely known before exe-
cution. For example, in a hospital process the system
can not obligate the execution of a specific task during
a care (e.g. administration of a drug). Even consider-
ing the similarity with other cases, such a care could
be unique, which demands a flexible approach to its
participants (e.g. physician) that could be the right to
execute another task (e.g. request an examination).
On the other hand, a flexible system is vulnera-
ble to fraudulent executions, which imposes a trade
off between flexibility and security. Thus, it is impor-
tant to develop methods that can support the adoption
of such flexible systems without losing their security
property. Since a BPMS (Business Process Manage-
ment Systems) usually log the events (or tasks) exe-
cuted during process execution, it would be interest-
ing to aggregate into a BPMS a tool that can dynami-
cally detect anomalous executions in the log. By and
large, a log generated by such systems is comprised
of process instances, referred in this work as traces,
which are a stream view of process instances. For
instance, a trace abc means that the task a was con-
cluded before task b, and task b was concluded before
task c.
A common intuition is to consider a fraudulent
execution an infrequent or rare event. Nevertheless,
this paper argue that although an anomalous trace is
an infrequent event, an infrequent trace not neces-
sarily indicates an anomaly, as will be shown later.
This premise imposes a challenge: What infrequent
trace could be classified as anomalous? This work
will present some algorithms that collaborate in this
mission, and it will asses the effectiveness of the pro-
posed anomaly detection solutions.
Moreover, despite the motivation related to prob-
lems stated above, anomaly detection is becoming an
exciting area within data mining arena, since many
surprising and rare events are of interest in security,
surveillance, epidemiology, fraud detection, among
others. However, to our knowledge, little effort has
been made with the investigation of anomaly detec-
tion algorithms in the context of process aware sys-
tems. The work in (van der Aalst and de Medeiros,
2005) represents an attempt to fulfill this gap, but it
is a limited solution because it assumes that a process
model is known or could be inferred from a known
“normal” log.
In order to define an anomaly detection tool, we
are interested in applying process mining techniques
11
Bezerra F. and Wainer J. (2008).
ANOMALY DETECTION ALGORITHMS IN BUSINESS PROCESS LOGS.
In Proceedings of the Tenth International Conference on Enterprise Information Systems - AIDSS, pages 11-18
DOI: 10.5220/0001674700110018
Copyright
c
SciTePress

to discover anomalies or outliers in the log. Pro-
cess mining were created to be used to discovery
or mine process models from logs (Agrawal et al.,
1998; Maruster et al., 2001; de Medeiros et al., 2003;
van der Aalst et al., 2004). For example, process
mining techniques can be used to discover how peo-
ple work, to support business process modeling, and
to diagnose the enterprise work practice (Hammori
et al., 2006). Another usage of process mining tech-
niques is to construct social networks as presented in
(van der Aalst Minseok Song, 2004). In the anomaly
detection algorithms of this work, the classification of
an anomalous trace is based on the “noise” which a
trace makes in a process model discovered by a pro-
cess mining algorithm. These algorithms are based on
the rationale that if a trace is not an instance of a pro-
cess model, then the model will require some struc-
tural changes to the model fit the trace. In the case of
an anomalous trace, such structural changes will be
probably higher.
In the next section we report some related work.
The process mining tool that is used to support the
anomaly detection methods is presented in Section 3.
Also in Section 3, we present the metric that is used
to quantify the “noise” made by a trace for a model fit
it. After that, three different approaches of anomaly
detection in logs of PAS are presented in Section 4.
Conclusions and future work are in Section 6.
2 RELATED WORK
Anomaly detection is an exciting area which has been
applied in different application fields, and it has re-
ceived a special attention of data mining community.
For instance, in (Donoho, 2004) the author presents
how data mining techniques can be used to early de-
tect inside information in option trading. In (Fawcett
and Provost, 1997) the authors present a system which
is used to detect fraudulent usage of a cellular (cel-
lular cloning). Moreover, disease outbreak detec-
tion has been proposed by detecting anomalies in the
event logs of emergency visits (Agarwal, 2005), or
the retail data for pharmacies (Sabhnani et al., 2005).
There are solutions concerned with the intrusion de-
tection in networks (eg. (Lee and Xiang, 2001; Noble
and Cook, 2003)). Other efforts are concerned with
the detection of fraudsters in auctions or e-commerce
sites(e.g. (Pandit et al., 2007)).
Nevertheless, in the context of process aware sys-
tems, little effort has been done to the development of
anomaly detection methods. To our knowledge, only
the work in (van der Aalst and de Medeiros, 2005) is
closer related to our research. In that work the authors
present two methods whose support tool is a pro-
cess mining algorithm, the α-algorithm (van der Aalst
et al., 2004). In these methods, a known log com-
prised of “normal” traces is mined to define a classi-
fier, whose function is audit a separated log. However,
those methods are not suited in some domains of ap-
plication because a “normal” log is not known or a
“normal” model can not be known before execution.
Differently, our approaches are applied directly over
the audit log, and they do not consider the existence
of a known model, nor do they consider the existence
of a log without anomalous traces.
The accuracy of our anomaly detection algorithm
can be related to three items: (i) the process mining
algorithm; (ii) the metric used to quantify the modifi-
cation in a model for fit a new trace (“noise” metric);
and (iii) the process model representation. Therefore,
it would be interesting to assess other process mining
algorithms. For example, the algorithm described in
(Schimm, 2004) mines a similar process model rep-
resentation (block-structured models). Perhaps other
process mining approaches could be used, e.g. α-
algorithm (van der Aalst et al., 2004) or genetic min-
ing (de Medeiros et al., 2006); however, these process
mining algorithms utilize other process model repre-
sentation, so they will demand another metric to eval-
uate the inclusion cost of a trace. In the context of
“noise” metric, the set of conformance check metrics
presented in (Rozinat and van der Aalst, 2005) could
be assessed.
3 INCLUSION COST AND
INCREMENTAL PROCESS
MINING
The inclusion cost is a metric used to evaluate the
amount of modifications done in an old process model
in order to define a new process model which fits a
merged trace. Thus, to cope with such a metric, it
is important to use a process mining algorithm which
incrementally define a process model. In this work
we adopted the incremental process mining algorithm
based on rewriting rules, presented in (Wainer et al.,
2005). Such a mining algorithm discovers a model
whose meta-model is based on a combination meta-
models presented in (Agrawal et al., 1998; Cook and
Wolf, 1998). The meta-model presented in (Cook
and Wolf, 1998), which is based on selection struc-
tures (OR), define models that are syntactically more
complex than the models defined by the meta-model
presented in (Agrawal et al., 1998), which is based
on parallel structures (AND). For example, while the
ICEIS 2008 - International Conference on Enterprise Information Systems
12
T = { t1, t2, t3 }
t1 + t2
M1 M2 M3 Mn. . .
If M3 is the smallest,
M3 is selected
M3 + t3
If M31 is the smallest,
M31 is selected
M31 M32 M33 M3n. . .
FINISH
CONTINUE
M31 is the
mined model
for set T
Figure 1: Greedy search for traces in set T.
a
b
c
d
and
and
T = { abcd, acbd, abce }
a
b
c
d
and
and
or
e
or
Size = 6
Size = 9
a
b
c
d
Size = 4
abcd acbd
M abce
Figure 2: Mining example of a set of traces T.
parallelism between three tasks can be easily rep-
resented by an AND-Block, using an OR-Block it
would demand six selection branches. On the other
hand, the meta-model presented in (Cook and Wolf,
1998) defines models whose expressiveness is greater
than the models defined by meta-model presented in
(Agrawal et al., 1998). Therefore, a mix of these
approaches represents a balance between complexity
and expressiveness.
The model is a directed graph M = (V(M), E(M))
whose verticesV(PM) are the tasks or AND/OR con-
structs (split and join), while the edges E(PM) repre-
sent the play order of its vertices. For example, Fig-
ure 2 depicts three process models whose tasks are
represented by a labeled rectangle while AND-Blocks
and OR-Blocks are represented by a labeled ellipse.
AND-Blocks indicate a parallelism, and OR-Blocks
indicate a choice. The Equation 1 illustrates how the
inclusion cost is evaluated for a trace t ∈ T, such that
T is a set of different traces of a log. It is based on two
process models defined through the incremental pro-
cess mining algorithm – an old model (M
o
), which is
created with the traces T − t, and a new model (M
n
),
which is created with the traces T.
IC(M
o
, M
n
) = |V(M
n
)| − |V(M
o
)| (1)
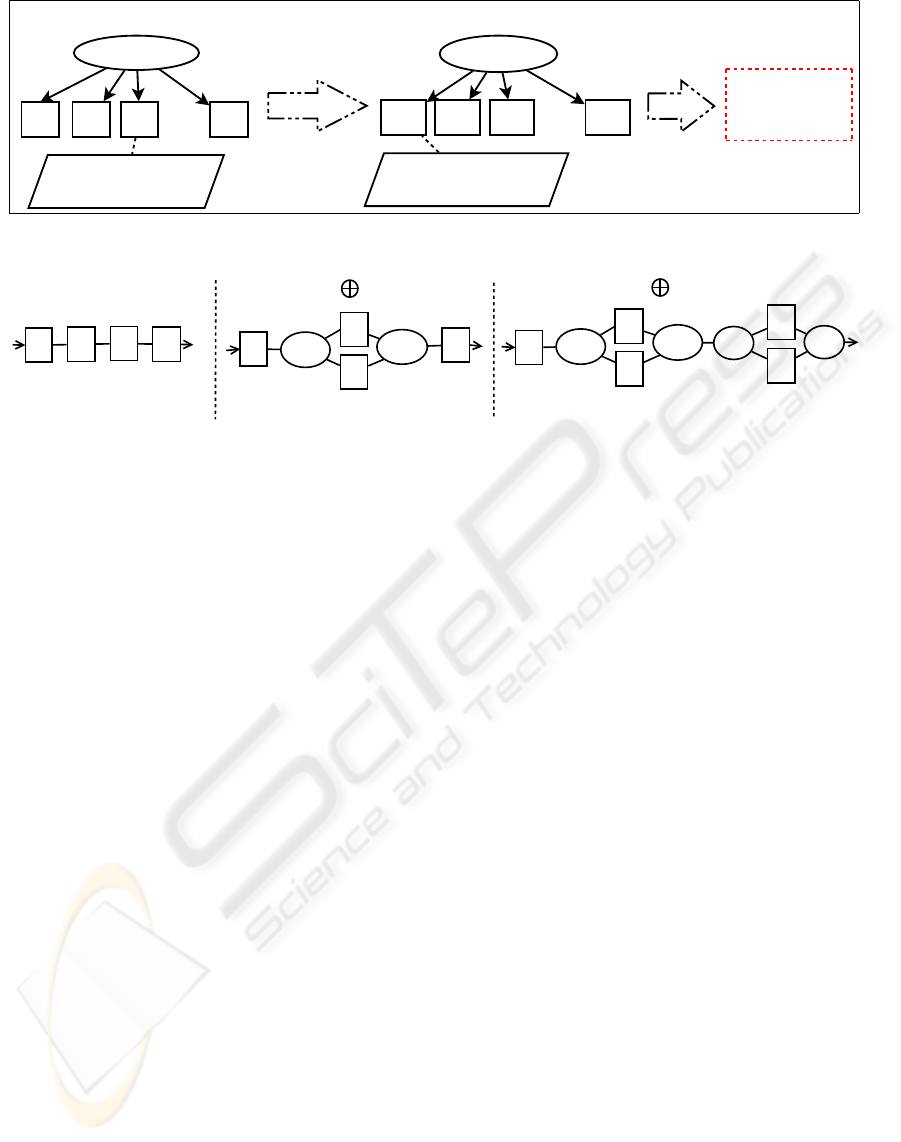
Such an incremental mining algorithm constructs
a model through the amalgamation of a trace over a
model, which could be modified, generating another
model. After that, another trace of log will be merged
generating a new model, an so on. The procedure
finishes when all unique traces were merged, result-
ing a process model. The incremental construction is
based on a set of rules classified as (i) structural rules
and (ii) introduction rules. The structural rules do
not change a model, but they are used to identify the
points of application of the introduction rule, whereas
the introduction rules introduce structural blocks such
as AND/OR Split/Join. The algorithm tries to amal-
gamate a trace into a model in different ways, either
applying different sequences of rules, or merging the
traces in a different sequence. Therefore, it has two
drawbacks that imposes serious limitations of its us-
age on larger logs, which are the large search space
generated by the rules and the amount of models gen-
erated at the end of mining.
To solve this limitation we added a greedy search
for minimal models after the amalgamation of each
trace. Figure 1 illustrates schematically how the pro-
cess mining works on a log of three traces. Among
all derived models, we select the smallest one. A
model M is smaller than a model M’ if M has less
vertices than M’. The selection of the smallest model
reduces the search space, so it improves the execution
time of algorithm. In addition, such an algorithm re-
turns a structured model that fits all traces and is likely
minimal, which are requirementsof completeness and
minimality as stated in (Schimm, 2004; Rozinat and
van der Aalst, 2005).
Figure 2 illustrate how a process mining works.
The figure shows three models generated when min-
ing a set of traces T = {abcd, acbd, abce}. The first
trace abcd defines a sequential model whose size is
four. Then, the second trace acbd is merged with the
sequential model, and a bigger model of size six is
generated for fitting the merged trace. Finally, the
ANOMALY DETECTION ALGORITHMS IN BUSINESS PROCESS LOGS
13

third trace abce is merged, generating a third model
with size nine. Therefore, this simple example illus-
trates how the inclusion of a trace can produce a mod-
ification in the model.
4 ANOMALY DETECTION
METHODS
Possible traces
a - b - c
a - b - d
b - a - c
b - a - d
Some incomplete logs
a - b - c
a - b - d
b - a - c
OR (c, d)
AND (a, b)
a - b - c
b - a - c
b - a - d
AND (a, b)
OR (c, d)
and
and
a
b
c
d
or
or
a - b - c
a - b - d
b - a - d
OR (c, d)
AND (a, b)
Figure 3: Mining of a process model with an incomplete
log.
Despite the different semantics associate with an
anomalous trace (e.g. noise, exception, or fraud), for
the purpose of this work an anomalous trace is an ir-
regular execution that differs from a process model
which was dynamically discovery during anomaly de-
tection process. This work adopts this approach be-
cause in some application domains a complete pro-
cess model is not known before execution. There-
fore, it is hard to adopt a precise definition of what
an anomalous trace is. On the other hand, a common
presupposition in literature is to consider an anomaly
like a rare event. However, classifying a trace based
only on its frequency in the log is not simple since it is
probable that some “normal” traces be infrequent, for
some “normal” operational procedures are preferable
than others. Moreover, it would be very difficult to
define a frequency which better describes an anoma-
lous trace. For instance, it does not seem appropriate
to classify as anomalous all traces whose frequency is
inferior to 5%.
Figure 3 depicts a process model, its possible
traces, and some subset of possible traces that can
reconstruct the same model. A possible trace is an
execution instance of a model, so the tasks a and b
have to appear in a possible trace of model in Figure
3 while c and d do not. In the first incomplete subset,
the first pair of traces ([a− b − c] and [a− b− d]) in-
ducts an “OR Block” to represent a choice (OR (c, d)),
while the last pair of traces ([a−b−d] and [b−a−d])
inducts an “AND Block” to represent a parallelism
(AND (a, b)). In this example, the trace [b− a − c]
is an instance of original model although it has not
been used to mine it. Thus, even if it was infrequent
in the log, it would not be possible to classify it like an
anomalous trace. Therefore, how to classify a (rare)
trace in the log as an anomalous one?
The anomaly detection methods adopt the follow-
ing hypothesis: most of the “normal” traces, if taken
individually, will be more frequent than anomalous
traces, and anomalies and a few “normal” traces will
be rare in the log. The traces that are not anomalies
when mined should generate a process model, and try-
ing to fit the anomaly into this model will require a
lot of structural changes in the models; therefore an
anomaly is the trace whose inclusion produces a large
modification to the model generated by other traces in
the log.
1. T is a list of all different traces of L;
2. For each t ∈ T do
3. Define a list L
′
= {L without one instance of t};
4. Define a sampling S with 50% of traces from L
′
;
5. Create a model M based on traces of S;
6. If t is not instance of M then
7. Add t to list A;
Figure 4: Anomalous trace classifier based on sampling.
The algorithm of Figure 4 will consider each of
the unique traces in the log as a possible anomaly, and
each candidate will be an anomaly if it is not an in-
stance of a process model created with a sampling of
log. The sampling comprises 50% of traces from log,
and it is redefined for each unique trace of log. The
composition of sampling is crucial because if anoma-
lies are rare as assumed, the set S will unlikely contain
an anomaly itself. Thus it can be seem as a sampling
of the “normal” traces, so it would reveal a approxi-
mation of the “normal” model.
Nevertheless, there are many things that can go
wrong with such assumptions and thus with the algo-
rithm. For example, the set S can comprise anoma-
lies which “contaminates” the mined model M; thus,
t could be an instance of M even though it may be
anomaly. That danger can be lessen by reducing the
size of the sample S. On the other hand, if the size
of S is too small, it may not be a large enough sam-
pling of the “normal” model because a too simple
“normal” model will be mined, so a “normal” trace
may be marked as anomalous.
The algorithm of Figure 5 classifies a trace as
anomalous if such a trace has the highest inclusion
cost, and its cost is higher than 2 (lines 4 and 9). This
approach is called iterative because it is repeated until
there is not such a trace in the log. The select(C, F)
ICEIS 2008 - International Conference on Enterprise Information Systems
14

1. T is a list of all different traces of L;
2. F is a list of frequent traces in log;
3. C = T − F is a list of anomalous candidate traces;
4. h ← select(C, F);
6. While inclusion cost of h is higher than 2;
7. Add h to list A;
8. Remove h from list C;
9. h ← select(C, F);
Figure 5: Iterative anomalous trace classifier.
function returns nil or one trace that has the highest
inclusion cost, and the inclusion cost of each candi-
date t is evaluated based on a model constructed with
the traces from C∪ F − {t}.
The step in line 2 select all frequent traces in the
log. We say that a trace is frequent if its frequency is
at least 10%. Such a step is used for optimization rea-
sons, because the next (line 3) reduces the number of
candidate anomalous traces. However, even with that
optimization, the select(C, F) function may compro-
mise the execution time of whole algorithm.
The stop condition threshold represents our be-
lief that even a “normal” trace may demand struc-
tural changes in a model mined with the remaining
traces of a log, but possibly in a smaller scale. How-
ever, although such a threshold is a heuristic value, it
was induced by an assessment done with 150 “nor-
mal” logs. We say that such logs are “normal” be-
cause they are based on traces of a know model that
was randomly created for each log. In our intuition,
knowing the values and frequencies of inclusion cost
of traces in scenarios of “normal” logs, an inclusion
cost threshold for a “normal” trace could be inferred.
In this assessment, we collected the inclusion cost of
each unique trace for each log, and we evaluates some
statistic metrics of these costs, as follows: 1st quar-
tile = 0; median = 0; 3rd quartile = 2; mean = 1.306;
min = 0; and max = 7.
The algorithm of Figure 6 is similar to the itera-
tive algorithm presented in Figure 5, but it selects all
anomalous traces in a single step. Similarly, it uses a
threshold value to classify the traces as anomalous or
normal. Therefore, is has an execution time smaller
1. α=2; {A threshold amount of modification}
2. T is a list of all different traces of L;
3. F is a list of frequent traces in log;
4. C = T − F is a list of anomalous candidate traces;
5. For each t ∈ C do
6. M is a model mined with traces from T − t;
7. c is the inclusion cost of trace t over M;
8. If c ≻ α then
9. Add t to list A;
Figure 6: Anomalous trace classifier based on threshold.
than the iterative approach, because all anomalous
traces are identified in the first and unique iteration.
Although we have used constant values for thresh-
old and sampling factor in the algorithms, we know
that a variance in these values could influence their
accuracy. For example, if we increase these values,
possibly the true (TPR) and false (FPR) positive ratios
would decrease. Nevertheless, the values presented in
each algorithm represent the best accuracy configura-
tion of our preliminary tests.
5 ASSESSMENT OF
ALGORITHMS
We have assessed the algorithms with a set of syn-
thetic logs which have been created based on the
traces of known process models. Two reasons influ-
enced our choice for synthetic data. First, it is hard
(perhaps inexact) to identify an anomalous trace in a
real log, so it would impose some limitations on the
assessment. For example, in (Pandit et al., 2007) the
authors report some problems regarding the assess-
ment of their anomaly detection system with real data.
Last but not least, a real log is not available. There-
fore, as we know the process model that was used to
create a log, it is easy to identify the anomalous traces
in the log since an anomalous trace is a trace that is
not an instance of a known model.
5.1 Methodology
The experiments were based on 780 logs with differ-
ent configurations. Initially, we randomly created 130
process models which were the matrix of logs. Such
models could instance at least 8 unique traces and at
most 15 unique traces. For each model, we instanced
80 traces that were used to compose the log and rep-
resent the normal traces to the experiment. In addi-
tion, the unique traces of each log were added in a
non uniform frequency distribution. After that, we
merged some anomalous traces to define six types of
log, as follows: (i) a log A that has one single anoma-
lous trace; (ii) a log B that has two single anoma-
lous traces; (iii) a log C that has three single anoma-
lous traces; (iv) a log D that has one double anoma-
lous trace; (v) a log E that has two double anomalous
traces; and (vi) a log F that has three double anoma-
lous traces.
With regard to the anomalous traces, they were
generated as instances of a process model created
after shifting AND-Blocks to OR-Blocks, and vice
versa. Such a process model is known only during log
ANOMALY DETECTION ALGORITHMS IN BUSINESS PROCESS LOGS
15
and
and
a
b
c
d
or
or
or
or
a
b
c
d
and
and
Possible traces
a - b - c
a - b - d
b - a - c
b - a - d
Possible traces
a - d - c
a - c - d
b - d - c
b - c - d
Figure 7: Example of definition of anomalous traces.
generation, but it is unknown during anomaly detec-
tion assessment. The instances of this new (shifted)
process model are used to define the anomalous traces
for the original model. Then, after an instance has
been created some events could be removed of the
trace, or two random events could be interchanged.
Figure 7 illustrates an example of definition of
anomalous traces. The possible traces of upper model
are anomalous for the lower model, and vice-versa. In
this example, while the tasks c and d could not play
together in the upper model, they are played together
in the lower model. Moreover, while the tasks a and b
would have to play together in the upper model, they
are not played together in the lower model. Besides,
the approach used to create the anomalous traces rep-
resents our intuition that anomalous traces are similar
to “normal” traces, for they are based on the same set
of tasks. In other words, we believe that in real scenar-
ios a fraudster will not attempt to execute new tasks,
but he will try to make “little changes” in a standard
operational procedure, because it will be more diffi-
cult that his fraud be detected.
After the definition of logs, we carried out the ex-
periments with the three algorithms described in Sec-
tion 4. The results were organized in three classes:
(i) logs with single anomalous traces (A, B, and C);
(ii) logs with double anomalous traces (D, E, and F);
and (iii) all logs (A, B, C, D, E, and F). The following
subsection describes the results.
5.2 Results
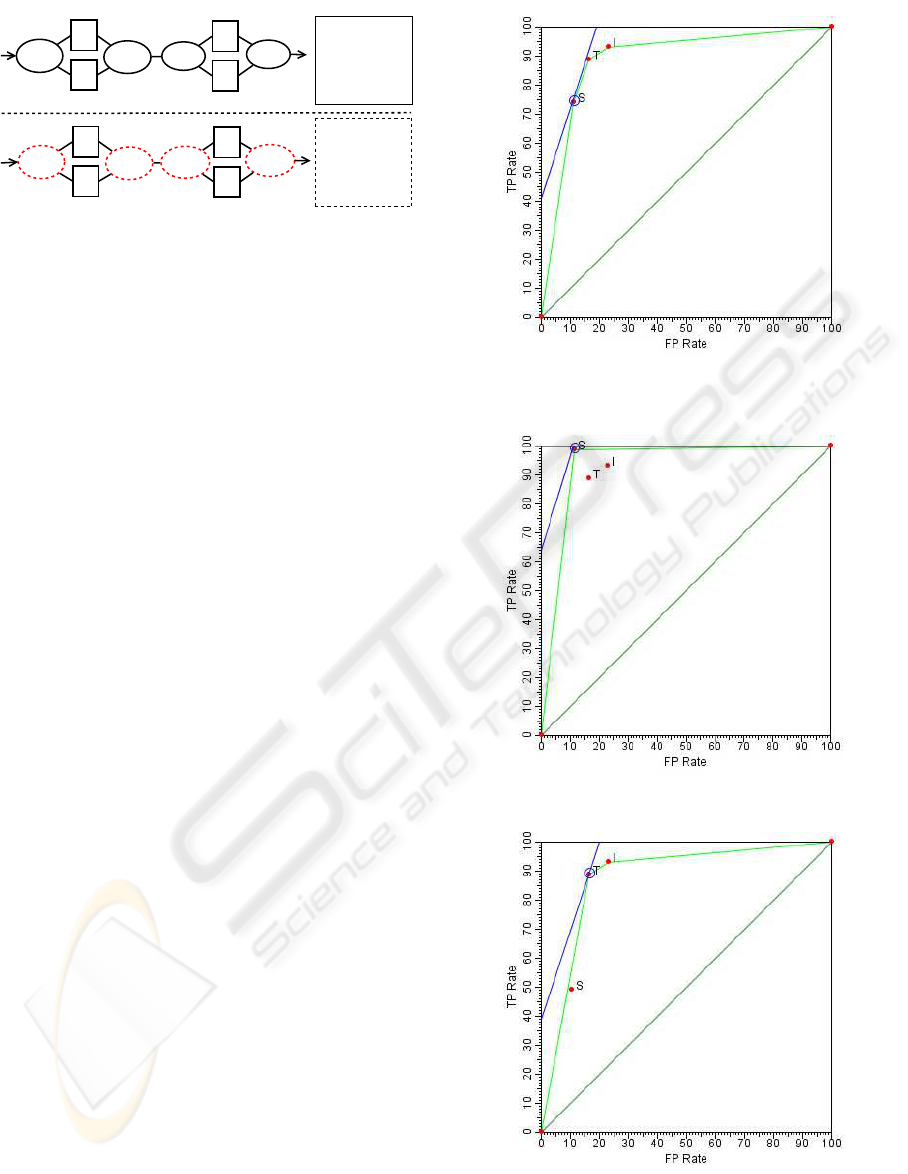
Figures 8, 9, and 10 depict a graphical analysis tool
(ROC graphs, (Fawcett, 2004)) utilized to compare
the performance of the three proposed anomaly detec-
tion algorithms (or classifiers) in three different sce-
narios. Each point in those figures represent one of
the three algorithms, labeled as follows: S for sam-
pling approach; I for iterative approach; and T for
threshold approach. In a ROC curve, the best clas-
sifier is that one closer to optimal point of coordinates
(0, 100). The x-axis represents the ratio of false pos-
itives (FP rate), and the y-axis represents the ratio of
true positives (TP rate). The diagonal line in the cen-
Figure 8: Logs with at most three single or three double
anomalous traces.
Figure 9: Logs with at most three single anomalous traces.
Figure 10: Logs with at most three double anomalous
traces.
ICEIS 2008 - International Conference on Enterprise Information Systems
16

Figure 11: Assessment Summary.
ter of graph is used to identify good or bad classifiers.
Points above the diagonal line indicate good systems,
while points below the line indicate bad systems. The
figures illustrate a convex curve that is tangent to the
iso-performance classifiers, that is, classifiers that are
possibly optimal. Moreover, there is an upper line
that is tangent to the curve, where it touches the opti-
mal classifier. The inclination of line depends on the
number of positives examples (anomalous traces) in
the data, which in the case of this assessment were
25%.
Figure 11 shows a summary of results in the fol-
lowing scenarios: logs with single anomalous traces;
logs with double anomalous traces; and logs with
single or double anomalous traces. It presents three
performance metrics, as follows: ACC indicates the
accuracy of algorithm, that is, how many traces in
the log were correctly classified; TPR, which is an
acronym of True Positive Rate, indicates the ratio of
anomalous (positive) traces that were correctly classi-
fied; and FPR, which is an acronym of False Positive
Rate, indicates the ratio of normal (negative) traces
that were incorrectly classified.
Among the algorithms, the sampling approach had
the best accuracy either in the scenario of logs with
single anomalous traces or in the scenario of all logs.
However, such an approach was sensible to repetition
of anomalous traces in the log; as one can notice in
Figure 11, the threshold approach had the best accu-
racy rate in the scenario of logs with double anoma-
lous traces. Also, the TPR of sampling approach was
significantly smaller than the others in the scenario
of logs with double anomalous traces. That perfor-
mance difference is justified. The sampling approach
is based on the instance traces, while iterative and
threshold approaches are based the unique traces.
Considering the execution time of algorithms, the
sampling approach had the best performance. The av-
erage time of execution for algorithms were as fol-
lows: 4.896 s for sampling approach; 9.016 s for
threshold approach; and 16.275 s for iterative ap-
proach. In the worst case, the algorithms were exe-
cuted in the following times: sampling = 466.422 s;
threshold = 670.625 s; and iterative = 1145.160 s.
6 CONCLUSIONS
Normative information systems are not appropriate in
application domains like software development and
health care processes, because users needs a flexible
support. On the other hand, such a flexibility in these
systems can not be considered without improving se-
curity issues. Besides, little attention has been given
to the anomaly detection area in the context of busi-
ness process systems. To fulfill this gap this work pre-
sented three different approaches to detect anomalous
traces in a log of process aware systems.
Despite the application context of algorithms has
been presented for security in flexible environments,
such algorithms are a proposal to detect anomalies,
which have a larger semantic. For example, in the
context of software development one could apply the
algorithms to detect exceptions, while in process min-
ing context one could use the algorithms to remove
noise of logs before mining a model.
Several examples have been treated by our im-
plementation. Considering the results, the sampling
algorithm demonstrated to be a good solution, es-
pecially when applying it on logs without repeated
occurrences of anomalous traces. Nearly 99% of
anomalous traces were correctly identified, yet ap-
proximately 11% of “normal” traces were incorrectly
classified (false positives). Thus, the accuracy rate
can be improved reducing the cost of anomalous iden-
tification. To do so, we defined a research agenda
to achieve such an improvement, either testing other
process mining algorithms, or testing other metrics of
model modification. Also, the sampling approach was
less time consuming among the tested algorithms.
ACKNOWLEDGEMENTS
This work was supported by fellowships of CAPES
and CNPq, which are Brazilian research agencies.
Moreover, the authors would like to thank the anony-
mous revisions.
ANOMALY DETECTION ALGORITHMS IN BUSINESS PROCESS LOGS
17

REFERENCES
Agarwal, D. K. (2005). An empirical bayes approach to
detect anomalies in dynamic multidimensional arrays.
In ICDM, pages 26–33.
Agrawal, R., Gunopulos, D., and Leymann, F. (1998). Min-
ing process models from workflow logs. In EDBT
’98: Proceedings of the 6th International Conference
on Extending Database Technology, pages 469–483,
London, UK. Springer-Verlag.
Cook, J. E. and Wolf, A. L. (1998). Discovering models
of software processes from event-based data. ACM
Trans. Softw. Eng. Methodol., Vol. 7(3):p. 215–249.
de Medeiros, A., van der Aalst, W., and Weijters, A. (2003).
Workflow mining: Current status and future direc-
tions. In Meersman, R., Tari, Z., and Schmidt, D.,
editors, On The Move to Meaningful Internet Systems,
volume 2888 of LNCS.
de Medeiros, A. K. A., Weijters, A. J. M. M., and van der
Aalst, W. M. P. (2006). Genetic process mining: A
basic approach and its challenges. Lecture Notes in
Computer Science, 3812:203–215. ISSN 0302-9743.
Donoho, S. (2004). Early detection of insider trading in op-
tion markets. In KDD ’04: Proceedings of the tenth
ACM SIGKDD international conference on Knowl-
edge discovery and data mining, pages 420–429, New
York, NY, USA. ACM Press.
Fawcett, T. (2004). Roc graphs: Notes and practical consid-
erations for researchers.
Fawcett, T. and Provost, F. (1997). Adaptive fraud detec-
tion. Data Mining and Knowledge Discovery, Vol.
1:p. 291–316.
Hammori, M., Herbst, J., and Kleiner, N. (2006). Interactive
workflow mining - requirements, concepts and imple-
mentation. Data Knowl. Eng., Vol. 56(1):p. 41–63.
Lee, W. and Xiang, D. (2001). Information-theoretic mea-
sures for anomaly detection. In IEEE Symposium on
Security and Privacy.
Maruster, L., van der Aalst, W. M. P., Weijters, T., van den
Bosch, A., and Daelemans, W. (2001). Automated
discovery of workflow models from hospital data. In
Krse, B., Rijke, M., Schreiber, G., and Someren, M.,
editors, Proceedings of the 13th Belgium-Netherlands
Conference on Artificial Intelligence (BNAIC 2001),
pages 183–190.
Noble, C. C. and Cook, D. J. (2003). Graph-based anomaly
detection. In KDD ’03: Proceedings of the ninth ACM
SIGKDD international conference on Knowledge dis-
covery and data mining, pages 631–636, New York,
NY, USA. ACM Press.
Pandit, S., Chau, D. H., Wang, S., and Faloutsos, C. (2007).
Netprobe: a fast and scalable system for fraud de-
tection in online auction networks. In WWW ’07:
Proceedings of the 16th international conference on
World Wide Web, pages 201–210, New York, NY,
USA. ACM Press.
Rozinat, A. and van der Aalst, W. M. P. (2005). Confor-
mance testing: Measuring the fit and appropriateness
of event logs and process models. In Business Process
Management Workshops, pages 163–176.
Sabhnani, R., Neill, D., and Moore, A. (2005). Detecting
anomalous patterns in pharmacy retail data. In Pro-
ceedings of the KDD 2005 Workshop on Data Mining
Methods for Anomaly Detection.
Schimm, G. (2004). Mining exact models of concurrent
workflows. Comput. Ind., Vol. 53(3):p. 265–281.
van der Aalst, W. M. P. and de Medeiros, A. K. A.
(2005). Process mining and security: Detecting
anomalous process executions and checking process
conformance. Electr. Notes Theor. Comput. Sci., Vol.
121:p. 3–21.
van der Aalst, W. M. P., Weijters, T., and Maruster, L.
(2004). Workflow mining: Discovering process mod-
els from event logs. IEEE Trans. Knowl. Data Eng.,
Vol. 16(9):p. 1128–1142.
van der Aalst Minseok Song, W. M. (2004). Mining social
networks: Uncovering interaction patterns in business
processes. In Desel, J., Pernici, B., and Weske, M.,
editors, Business Process Management: Second Inter-
national Conference, volume 3080 of LNCS, pages pp.
244 – 260.
Wainer, J., Kim, K., and Ellis, C. A. (2005). A workflow
mining method through model rewriting. In Fuks, H.,
Lukosch, S., and Salgado, A. C., editors, Groupware:
Design, Implementation, and Use: 11th International
Workshop, volume 3706, pages p. 184–19, Porto de
Galinhas, Brazil. CRIWG 2005.
ICEIS 2008 - International Conference on Enterprise Information Systems
18
