
NATURAL LANGUAGE INTERACTION BASED ON
AUTOMATICALLY GENERATED CONCEPTUAL MODELS
Diana Pérez-Marín, Ismael Pascual-Nieto and Pilar Rodríguez Marín
Computer Science Department, Universidad Autónoma de Madrid, 28049, Spain
Keywords: Natural Language interface, conceptual modeling, free-text scoring, adaptive hypermedia, open learner
modeling.
Abstract: In this paper, we present a new form of interaction between students and free-text scoring tools based on the
use of automatically generated conceptual models. Traditionally, students have worked with free-text
scoring tools by typing free-text answers to the open-ended questions shown on the system’s interface.
Students could not personalize the aspect of the interface or visually acknowledge the level of progress they
have made after answering the questions. In contrast, with this new form of interaction they are able to input
natural language text and look at their generated conceptual model, which can be defined as a network of
concepts and the relationships among them. In the conceptual model, each node has a background colour
that indicates how well it has been understood by the student. The conceptual model can be represented in
several formats such as concept maps, tables, charts, diagrams or textual summaries. The results of two
experiments carried out with a group of students and teachers show how they like this new possibility.
1 INTRODUCTION
In the last decades, we have assisted to the
flourishing of more and more e-learning approaches,
which help students to follow courses with a flexible
schedule, from any computer connected to Internet
and at their own rhythm.
It can be observed how there has been a change
in traditional education roles: teachers are relegated
to a second plane, students have gained more control
over their learning process and computers serve as a
medium between students, knowledge and teachers.
That way, students can log into on-line courses, read
them and try to solve the exercises presented by the
e-learning systems.
Regarding the type of exercises that the students
can be asked to complete, there is the field of
Computer Assisted Assessment (CAA), which
focuses on the study of which exercises are more
effective. In particular, one of the most challenging
and interesting exercises are open-ended questions
asked by free-text CAA systems as they involve
higher cognitive skills and ask for natural language
input (Pérez-Marín, 2007).
On the other hand, graph editors have also been
produced to provide students with a visual
representation of how well they have understood
certain texts according to their student model
(Dimitrova, 2003; Zapata-Rivera, 2004).
However, no natural language interaction was
possible with the graph editors and, no student
model was used in free-text CAA systems.
In this work, we propose the combined use of
natural language input and a graphical representation
of students’ conceptual models. A student’s
conceptual model can be defined as a network of
concepts and the relationships among them, which
presents each node with a background colour. This
colour indicates how well the concept is understood
by the student.
That way, students can visually acknowledge the
level of progress they have made after answering the
open-ended questions in natural language. It has
many benefits such as being able to track their
evolution during the semester (Bull and Nghiem,
2002). Furthermore, students do not have to
introduce the conceptual model using a graph editor.
The conceptual model is automatically generated
from the free-text answers typed to the scoring
system in multiple representation formats: concept
maps, tables, charts, diagrams or textual summaries.
Students have also the possibility to personalize the
interface according to their preferences.
This proposal is implemented in the Will tools
(Pérez-Marín, 2007) that consist of: Willow, the
5
Pérez-Marín D., Pascual-Nieto I. and Rodríguez Marín P. (2008).
NATURAL LANGUAGE INTERACTION BASED ON AUTOMATICALLY GENERATED CONCEPTUAL MODELS.
In Proceedings of the Tenth International Conference on Enterprise Information Systems - HCI, pages 5-12
DOI: 10.5220/0001673600050012
Copyright
c
SciTePress

free-text CAA system; Willed, the authoring tool;
Willoc, the configuration tool; and, COMOV, the
conceptual model viewer.
Two experiments have been done to test this
proposal. In both of them, the participants were
asked to interact with the Will tools by using natural
language to answer the open-ended questions asked
by Willow and look at their generated conceptual
model as shown by COMOV to graphically visualize
the level of progress they have made.
The paper is organized as follows: Section 2
provides our definition of students’ conceptual
models; Section 3 describes the Willow and
COMOV systems of the Will Tools; Section 4
reports the settings used and results achieved in the
experiments performed with the Will Tools; and,
finally Section 5 ends with the main ideas and lines
of future work.
2 THE CONCEPTUAL MODEL
A conceptual model can be defined as a simplified
representation of the concepts and relationships
among them that someone keeps in his or her mind
about an area of knowledge at a certain instant.
Conceptual models have been extensively used for
many different applications such as summative and
formative assessment, knowledge elicitation and
organization, etc.
The key point is to decide which concepts and
relationships are going to be included in the model.
The two traditional approaches are either to
designate a group of experts to debate about it or to
directly ask the students.
The problem of the first approach is that it is
quite time-consuming because experts usually do not
completely agree which the most important concepts
for a certain domain are. Regarding the second
approach, the quality of the concepts chosen is
debatable. Moreover, in some cases, students are not
even aware of all their knowledge (Sigel, 1999) and,
in any case, the resulting list is subjective and
depends on the people that have created it.
Therefore, we have opted by a third option: to
automatically identify the concepts so that the
process is objective (independent of a particular
human opinion) and faster (without needing a group
of experts to create a common list of concepts).
A hierarchical structure of knowledge is
considered as it is the most common organization of
knowledge for people older than six years old
(Inherlder and Piaget, 1964). According to this
structure, not all concepts in the model have the
same relevancy. In fact, three different types of
concepts have been distinguished following the
structure of traditional courses:
– Basic-concepts (BCs): Specific terms relevant
for one or more topics. They are in the lowest
level in the hierarchy, as they refer to individual
instances. For example, blanket, semaphore or
process. They are automatically extracted from
the free-text students’ answers. A BC can belong
to one topic or to several topics but it only
appears once in the conceptual model.
– Topic-concepts (TCs): Main issues inside an
area of knowledge. They group several BCs and
belong to a certain area-of-knowledge concept.
For example, concurrency is a TC that comprises
BCs such as semaphore and process. TCs are
extracted from the names of the lessons of the
agenda of the course as provided by the
instructors.
– Area-of-knowledge-concepts (ACs): Main
domains of knowledge that contains all the rest
of the concepts. That is, they are the highest
level concepts as they refer to groups of several
TCs. For instance, operating system is an AC
that comprises topic-concepts such as
concurrency or scheduling. For each conceptual
model, only one AC is allowed and it
corresponds to the name of the course to model
as given by the instructors.
Each concept, irrespectively of its type, has a
confidence-value (CV) that reflects how well it is
understood at any time. It is always between 0 and 1.
A lower value means that the student does not know
the concept as s/he does not use it, whereas a higher
value means that the student confidently uses that
concept. This CV is automatically updated as the
student keeps answering questions according to a set
of metrics (Pérez-Marín, 2007). The CV of a TC is
calculated as the mean value of the CVs of the BCs
that this TC groups and, the CV of an AC is
calculated from the CVs of its TCs. Thus, just by
looking if the AC has a high confidence value, it can
be seen how well the whole course has been
understood.
Three types of links have been distinguished
according to the type of concepts that they relate:
Type 1, between ACs and TCs: A topic-concept
belongs to one area-of-knowledge-concept. For
example, the TC concurrency belongs to the AC
Operating Systems. Type 1 links are extracted from
the organization of the course provided by the
instructors (i.e. which lesson corresponds to each
course). A TC can only belong to one AC.
ICEIS 2008 - International Conference on Enterprise Information Systems
6
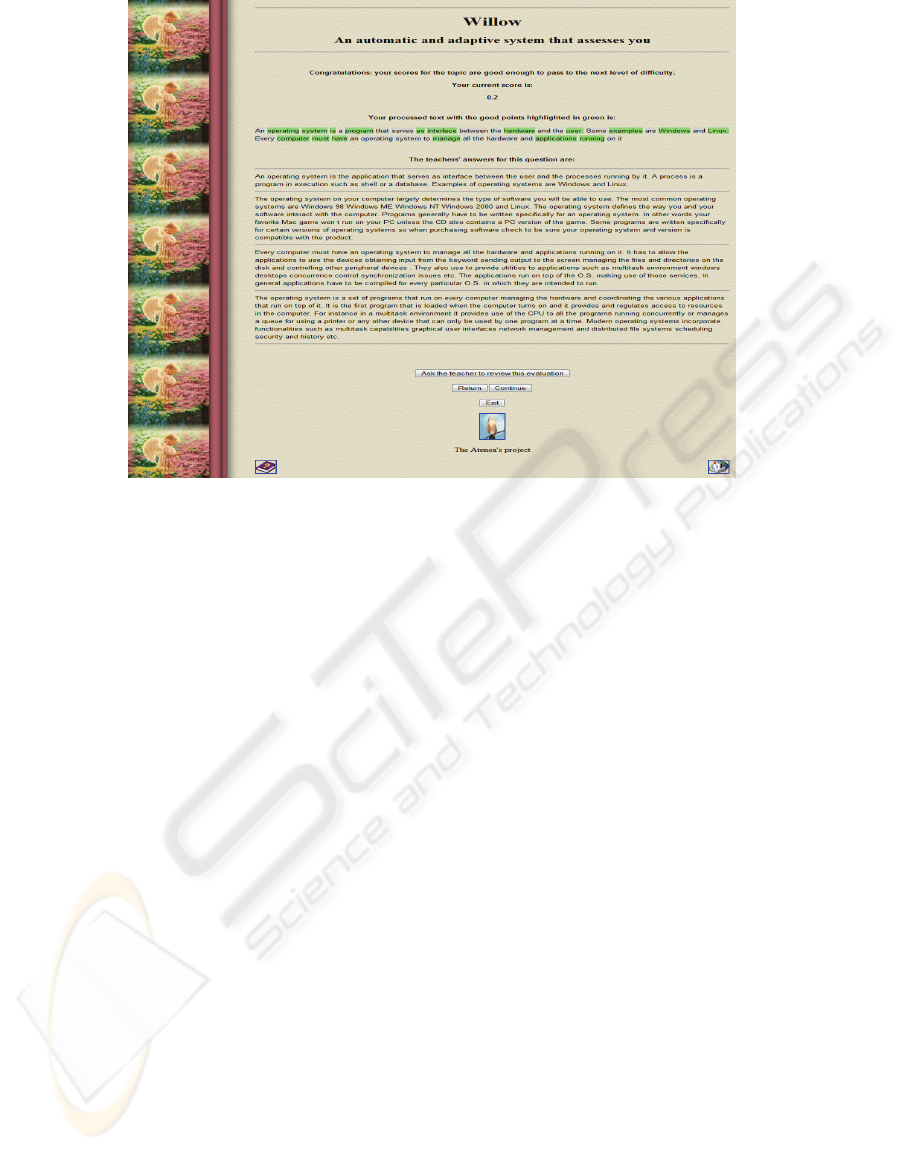
Figure 1: A snapshot of a generated feedback page.
– Type 2, between TC and BC: A basic-concept
belongs at least to one topic-concept. It can also
belong to several topic-concepts. For example,
the BC semaphore belongs to the TC
concurrency, whereas the BC process belongs to
the TCs concurrency and scheduling. These
relationships are important because they give us
information about how the basic-concepts are
grouped into topic-concepts. Moreover, for each
BC that belongs to different TCs, they give us
the student’s ability to deal with the BC in the
different contexts provided by the TCs. Type 2
links are extracted from the association between
the basic-concepts used in the reference answers
and the topics to which they belong.
– Type 3, between two BCs: A basic-concept can
be related to one or more basic-concepts. For
example, the BC process is related to the BCs
program and thread. These links are very
important as they reflect how BCs are related in
the student’s cognitive structure as they have
been extracted from the students’ answers.
Type 1 and 2 links are equal to all students as
they are extracted from the structure of the course,
whereas type 3 links are specific to each student as
they are extracted from their answers.
It is also important to mention that each link has
associated one or more linking words. The linking
words join the concepts in the extremes of the link
forming propositions.
The linking words for type 1 and type 2 links
have been fixed as “talks about” (from the higher
concept in the hierarchy to a lower concept) or
“belongs to” (from the lower concept in the
hierarchy to a higher concept). These linking words
have been chosen as they serve to structure the
knowledge and thus, capture the essence of these
types of links. For example, operating system “talks
about” concurrency or the other way around,
concurrency “belongs to” operating system or, for
type 3 links: a program “is a kind of” software.
3 THE WILL TOOLS
The Will tools are a set of on-line applications that
make possible the automatic and adaptive
assessment of free-text students’ answers and the
generation of the students’ conceptual model from
these free-text answers.
The outline of the procedure that allows the
generation of the conceptual model is as follows:
1. The teacher or author of the course uses Willed,
which is the authoring tool, to introduce the
lessons of the courses to evaluate. In each lesson,
there should be at least five questions of
different difficulties and per each question, a
minimum of three correct answers. The name of
the subject is taken as AC of the conceptual
model and, the name of each lesson is taken as a
TC linked to the AC. Initially, the confidence-
NATURAL LANGUAGE INTERACTION BASED ON AUTOMATICALLY GENERATED CONCEPTUAL MODELS
7

value (CV) of the AC and all TCs are reset to
zero and stored as the basic scheme of the
conceptual model for all the students.
2. An automatic script identifies the most important
terms (concepts) from the texts introduced in
Willed. These concepts are the BCs linked to the
TC in which they have been found. As TCs, the
CV of the BCs is reset to zero and stored in the
conceptual model of each student.
3. Students register on-line to access Willow and
start answering the questions introduced in
Willed. Willow keeps track of the use of the BCs
identified to estimate know well they are known
by the student and update the CV in each
particular student’s conceptual model.
4. Teachers and students can access with their
account to COMOV, to see the conceptual model
as generated by Willow in multiple formats:
concept map, table, bar chart, diagram or textual
summary. They can access several times during
the semester to follow the learning evolution of
one particular student or the whole class.
As can be seen, Willow and COMOV are two
key systems in the procedure. This is the reason why
they are described in more detail in the following
subsections.
3.1 Willow
Willow is an automatic and adaptive free-text
scoring system. The interface has been designed to
make easier the use of the system by students who
do not have more Computer Science skills than
using a web browser. It has Natural Language
Support being able to process Spanish or English
questions. The student can type his or her answer in
natural language and, s/he receives immediate
feedback as the one shown in Figure 1.
It is important to observe how the system does
not only provide the numerical score but some kind
of emotional interaction. It congratulates the student
as s/he has been able to pass the question.
Furthermore, it presents the justification of the score
at the level of detail asked by the student. The
default option is to show the processed student’s
answer and the correct answers provided by the
teachers for this question. Nonetheless, the student
could choose not to show the processed answer, or
the references, or any of them.
If selected, the processed student’s answer is
shown with a background colour schema that
indicates where the strong and weak points of the
answer are. In particular, green background means a
better match with the teachers’ answers and thus,
Figure 2: Sample of generated concept map.
a stronger point. Whereas, lighter green means a
lower coincidence and gray indicates that it is
irrelevant information for the question asked.
There are several correct answers provided by
the teachers of the subject. This is necessary for the
system given the internal behaviour of the scoring
engine (Pérez-Marín, 2007) and also positive from
the pedagogic point of view as having several
paraphrasings of the correct answer helps the student
to understand it and there is a better interaction
between the student and the system.
Although there are some default values,
Willow’s pages can be personalized to change the
background, font family, font size, etc. This is
because, according to Pianesi et al. (2007), the more
personalized the interface is, the higher the level of
engagement and motivation to keep using the
system. For instance, provided that the student is a
child, more colourful and infantile backgrounds are
available. Additionally, it is important to keep in
mind the case of students with some kind of visual
impairment or elderly people who need special
features such as higher fonts.
The level of difficuly of the questions is adjusted
to the student (Pérez-Marín, 2007). The end-of-
session condition is decided by the student as a
certain amount of time or questions, or dynamically
by the system when the student has completed all
questions of the higher level of difficulty.
3.2 COMOV
COMOV is the conceptual model viewer and can be
accessed by students or teachers. Both of them can
see the conceptual model of a particular student (in
the case of the student, only his or her model) and of
the whole class (taken as the average of the models
of all the students).
ICEIS 2008 - International Conference on Enterprise Information Systems
8

The interface of COMOV keeps the line of
Willow as it should be simple to be used by any
student of any age and without Computer Science
knowledge (more than using a web browser). It can
be chosen how to display the conceptual model in
order to keep promoting the possibility of
personalization and having full control over the
system. The possible representation formats are:
concept map, diagram, table, bar chart or textual
summary. Figure 2 shows the concept map
representation of a sample generated student’s
conceptual model.
This representation is based on Novak’s concept
maps (Novak and Canas, 2006). A spider-like
representation of the concept map has been chosen
in which each node in the graph represents a
concept: the AC is placed in the centre, and linked to
it there are the TCs connected to the BCs.
The background colours follow the semaphore
metaphor with red (lack of knowledge) to green (full
knowledge) tones passing from orange-yellow
(average knowledge). The colour is a representation
of the CV associated to TC according to a scale in
which 0 is associated to red, 1 to green, and there is
a degradation of RGB components reducing red and
augmenting green as the CV is higher.
That way, it should be easy to discern if the
student has successfully assimilated the concepts
exposed in the lesson just by looking at the
background colours of the concepts in the map.
This is particularly important for the case of the
AC as provided that it has a green background, it
would mean that the student is ready to pass the
course. Otherwise, some problems have appeared
and they can be identified by, initially looking at
TCs to see which ones are lacking and next, the BCs
related to the non green TCs.
In addition to the information provided by the
concepts and its hierarchy, links are very useful to
detect misconceptions and lack of relationships. The
misconceptions are detected whenever there is a link
between two BCs that should not be related and
thus, teachers should explain why. On the other
hand, the lack of links between two concepts that
should be connected denotes that students may
understand each isolated concept but they have not
recognized that they are related and thus, teachers
need to reinforce the link between them.
This representation in form of concept map is
particularly interesting whenever a global view of a
particular student or the whole class is pursued, or to
follow the students’ conceptual evolution.
The conceptual model can also be represented as
a conceptual diagram. It is a hierarchical diagram
with the most important concept at the top and less
relevant concepts below. In order to make the
representation simpler, the relationships among the
concepts are not explicitly represented, and the
concepts are organized upon three types of rows.
The first row is for the AC, the second row for the
TCs and the next rows are for the BCs.
For representing the CV, the same background
colour schema of the concept map is used. That is,
the CV of the concept determines the background
colour from red (CV=0) to green (CV=1) passing
from light red, orange, yellow and light green. So,
just by looking at the colour of the top row, the
diagram gives a clear indication of the general level
of understanding of the topics of the area-of-
knowledge under study. Additionally, for the users
who would like to have the exact numerical value of
the CV for each concept, a tooltip has been included
so that when they pass the mouse over each cell,
they can see numerical value of the CV.
The other representations of the conceptual
model included in COMOV are:
– Table: Each row corresponds to a BC and, the
columns show the name of the concept, its
weight indicating the relevance of the concept
according to its frequency in the correct answers
provided by the teachers, and the exact
numerical values to justify its CV.
– Bar chart: In contrast to the rest of
representations that show absolute values, the
bar chart aims to compare BCs. Thus, it orders
them according to the relative percentage that the
CV of each of them covers regarding the total.
– Textual summary: It consists of three ordered
lists indicating how well the ten most relevant
concepts are known, and which the ten best and
worst understood BCs are. In each list, the line
represents a BC with its name, numerical CV
and weight.
4 EXPERIMENTS
Two experiments have been done to find out how
teachers and students like the use of conceptual
models. Both of them have been in the Operating
Systems subject of the Engineering degree at the
Universidad Autonoma of Madrid and, they have
followed the same procedure:
– Give a short introduction to the group about the
Will tools and their possibilities (focusing on the
use and interface of Willow and COMOV based
on the conceptual model).
– Ask them to voluntarily use the tool designed for
them (COMOV for teachers and students;
NATURAL LANGUAGE INTERACTION BASED ON AUTOMATICALLY GENERATED CONCEPTUAL MODELS
9

Willow for students). For students, the
motivation was that it would have a positive
impact in the final score of the subject.
– Solicit their opinion in an anonymous
satisfaction questionnaire with close and open
input items.
4.1 First Experiment
Willow was used by the first time in the 2005-2006
academic year. It was during 20 minutes in a class of
16 volunteer students (75% of the enrolled students
in the subject) to study Willow’s usability and to
generate the first set of students’ conceptual models.
All students claimed that they like the system to
review concepts and they would recommend it to
other students.
The students rated the order of the questions
with a 3.4 score in scale from 1 (dislike of the order
of the questions) to 5 (like the order of the
questions), and the difficulty of the questions with a
2.9 from 1 (easy) to 5 (difficult). These results are
slightly better than in a previous experiment with a
non-adaptive free-text scoring system in which
random order was used (Pérez-Marín, 2007).
The feedback page generation options were fixed
to have all the numerical score, the student’s
processed answer and the correct answers from the
teachers. Besides, it was also selected to show the
feedback of questions previously answered by failed.
It was because we wanted them to have a full view
of all the feedback possibilities.
Regarding the intuitiveness of Willow’s
interface, in the scale from 1 (not intuitive at all) to 5
(very intuitive), the average score provided by the
students was 3.5. Moreover, they gave the system a
4.5 score in the scale 1 (very difficult to use) to 5
(very easy to use).
No student used the personalization options. We
believed that it is because in the introductory talk
that possibility was not mentioned and, they could
use the system only during 20 minutes without time
to find out it by themselves.
We did not allow students to enter COMOV
because teachers had not still seen the models, and
we asked a group of six teachers of our home
university to use COMOV. They were positively
surprised by the possibility of having an immediate
representation of the students’ conceptual models. In
fact, all of them stated that they would like to use the
Will tools in their courses and would recommend its
use to other teachers to have more feedback about
their students. One of the best regarded options was
to have the class conceptual model and to see the
general values for all the students.
Regarding the intuitiveness of COMOV’s
interface, in the same scale as above, the teachers
gave a 3.8 score. Moreover, they highlighted the
complementary views of the different representation
formats of the conceptual model and, they had
difficulties in one representation as the most
illustrative of the real knowledge of the students.
Eventually, there were more votes for the concept
map. Furthermore, one teacher stated that he would
like to have a view similar to the concept map but
focused only on the concepts. This remark inspired
us to build the conceptual diagram representation
that was available for the second experiment.
4.2 Second Experiment
In the 2006-2007 academic year, we repeated the
experiment with another group of students and
teachers. In particular, we wanted to analyze how
students use the Will tools (included COMOV as
teachers have validated the last year generated
models) during the whole semester.
24 students (41% of the enrolled students)
volunteered to use the systems. The results of the
experiment confirmed the conclusions drawn in the
previous experiment. The students stated again that
they considered the Will tools a great possibility to
reinforce concepts.
It can be stated from the logs gathered in this
experiment how students with more time to use the
systems exploited the personalization features. In
fact, from the 92 sessions registered in the system: in
91 sessions (98.9%) the text area size was changed,
in 90 (97.8%) the font size, in 18 (19.6%) the
background, in 8 (8.7%) the answer font colour, in 3
(3.3%) the font family and, once (1.1%) the
statement font colour.
Regarding the feedback page options, in all the
sessions they choose to have the feedback of
questions previously answered but failed. In 86
sessions (93.5%), the feedback selected was the
score, the processed answer and the references.
While in the other 6 sessions (6.5%), the feedback
selected was the score and the processed answer.
11 students (46%) used the new possibility of
looking at the representation of their conceptual
model during the semester. They reported by mail
that they appreciated this extra feedback very much
and, that it coincided with what they think about
how well they knew the subject. Some comments
provided by the students were “I cannot imagine it
was like that…it is amazing how I can easily see
which concepts are clear and which ones are not” or
“I think it is very interesting to help me know what
to review. Thanks! ”.
ICEIS 2008 - International Conference on Enterprise Information Systems
10

When the students were asked why they like to
see their conceptual model, some students’
responses were: “I want to see my progress”, “To
see which my weak points are” or “I am curious to
see it, I think it is very interesting”. Only one
student said that he saw a problem with his
conceptual model. It was that he felt embarrassed to
see his complete lack of knowledge in Operating
Systems. All the same, this student also indicated
that he wanted to continue having the possibility of
looking at the evolution of his conceptual model to
see if he was able to improve his results.
Similarly as with the teachers, we asked the
students which representation they considered the
most illustrative of their real knowledge. It turns out
that although they stated they have used all the
representations as they considered them useful, from
the review of the logs generated by COMOV, the
conceptual diagram was the representation most
visited followed by the concept map. In fact, it was
the conceptual diagram of the whole class what
more students reviewed.
Finally, it is also important to mention that the
teacher of this subject confirmed the conclusions
previously drawn from the last year survey to
teachers. In particular, he stated that he considers
very useful to have a system that provides him with
more feedback about which concepts have already
been understood and which ones should still be
reviewed. Besides, he appreciated that it was not
only at the level of each particular student but the
whole class, giving a special relevance to the
possibility of keeping track of the progress of his
students by following the evolution of the students’
conceptual models by using the concept map or
conceptual diagram representations.
5 CONCLUSIONS
A new form of interaction between students and
free-text scoring tools based on the use of
automatically generated conceptual models has been
presented in this paper.
The conceptual model has been defined as a
graph in which the nodes are the concepts and the
links are the relationships among these concepts.
Three different types of concepts have been
reviewed: AC which refers to the area-of-knowledge
(subject) in general; TC which refers to each lesson
in the subject; and, BC which refers to each
particular concept treated in the lesson. Additionally,
three different types of links have been
distinguished: type 1 between the AC and each TC;
type 2 between each TC and a BC (one BC can be
linked to two or more different TCs); and type 3
between two BCs.
Each node has a background colour that
indicates how well the concept is understood by
each student (i.e. the confidence-value estimated by
the system from the use of the concept in the
student’s answers). The colour follows a semaphore
metaphor in which red indicates lack of knowledge;
orange means average knowledge; and, green means
full understanding.
The conceptual model can be represented in
several formats such as a concept map with the AC
at the centre and TCs around it connected to their
BCs; a conceptual diagram focused on the concepts
and following the same colour schema; a table in
which the exact numerical values to calculate the
confidence-value are shown; a bar chart in which
relative percentages of how well the student knows a
concept in comparison to the rest of the concepts are
shown; and, a textual summary in which three
ordered lists are shown to indicate how well the
most important concepts are known and which the
ten best and worst known concepts are.
The model is not introduced by the students
using any editor. It is automatically generated from
the free-text answers typed into a CAA system. In
particular, the procedure that allows the automatic
generation of the model has been implemented in the
Will tools.
The Will tools consist of: Willow, the free-text
CAA system; COMOV, the conceptual model
viewer; Willed, the authoring tool; and, Willoc, the
configuration tool. The students log into Willow and
start answering the questions using the personalized
interface with the options selected by them. The
feedback page is generated from the assessment of
the answer and according to the format chosen by
the students. Willow also keeps track of how the
students are using the concepts in their answers to
update the conceptual model. The conceptual model
can be seen in COMOV by teachers and students in
the multiple representation formats explained above.
That way, students have been provided with the
possibility of the personalization of the aspect of the
system’s interface. Moreover, students and teachers
have been able to visually acknowledge in COMOV
the level of progress the students have made after
answering the questions in Willow.
Two experiments have been done to test how
students and teachers like the new use of the
conceptual model. It has been found that all of them
consider this new possibility as interesting,
highlighting that they can easily identify the
concepts that should still be reviewed and the
NATURAL LANGUAGE INTERACTION BASED ON AUTOMATICALLY GENERATED CONCEPTUAL MODELS
11

concepts already assimilated. Additionally, the
interface of Willow and COMOV has been rated as
intuitive and easy to use.
Regarding which representation format of the
conceptual model can be considered as the most
illustrative of the real knowledge of the students, the
teachers stated that all of the formats are
complementary as they have different goals, but if
they had to choose one, it would be the concept map.
Moreover, it was suggested to create the conceptual
diagram as a form of representation with the same
colour schema that the concept map but focusing on
the concepts and removing the links. In fact, the best
considered representation format for the students
was the conceptual diagram. Both teachers and
students prefer to have the view not only particular
to one student (in the case of the students only of his
or her particular model) but the view of the whole
class.
All students who used the Will tools during the
second experiment passed the final exam and with
scores higher than the students who did not use it
(Pérez-Marín, 2007). From the logs it can be seen
that students did not use the systems everyday but
they worked harder the days previous to the exam to
review more.
The best regarded option of the systems was to
have immediate feedback. It can be seen that 100%
chose to have the feedback of questions previously
asked but failed and 94.5% chose to have all items
available of feedback (numerical score, processed
student’s answer and correct answers provided by
the teacher).
These results encourage us to continue working
with the Will tools not only with students of
engineering degrees but also with non-technical
students. In fact, in the first semester of 2007-2008
academic year an experiment with students of
English Language is being carried out at our home
university. Furthermore, it is being studied to use the
systems not only with Spanish students but with
English ones in technical and non-technical subjects.
Other promising line of future research is to
make the conceptual model more dynamic. That is,
to make the conceptual model modifiable and not
only inspectable. Students could gain more control
over their learning process and improve the
interaction with the system. For instance, they could
be allowed to click on the concept marked as
unknown in the model and getting instant
information about it. The students could even be
allowed to discuss the estimated CV of each concept
with a natural language dialogue based on the
conceptual model. On the other hand, Willow could
also use the conceptual model to generate new
questions more focused on the problematic concepts
identified in the answers.
ACKNOWLEDGEMENTS
This work has been sponsored by Spanish Ministry
of Science and Technology, project number
TIN2007-64718. We would like to thank Enrique
Alfonseca, Eloy Anguiano, Almudena Sierra and
Manuel Cebrian for their help in the preparation and
performance of the experiments. Furthermore, we
would like to express our gratitude to all the teachers
and students who have participated in the
experiments.
REFERENCES
Bull, S. and Nghiem, T., 2002. Helping learners to
understand themselves with a learner model open to
students, peers and instructors. In Proceedings of the
Workshop on Individual and Group Modelling
Methods that Help Learners Understand Themselves
in the International Conference on ITSs, 5-13.
Dimitrova, V., 2003. STyLE-OLM: Interactive Open
Learner Modelling. International Journal of Artificial
Intelligence in Education, 13(1), 35–78.
Inherlder, B. and Piaget, J., 1964. The early growth of
logic in the child.. WW Norton & Company, Inc., 55
Fifth Avenue, New York.
Kravcik, M. and Specht, M., 2004. Flexible Navigation
Support in the WINDS Learning Environment for
Architecture and Design. In Proceedings of the
Adaptive Hypermedia International Conference,
LNCS 3137, Springer-Verlag, 156-165.
Novak, J.D. and Canas, A.J., 2006. The theory underlying
concept maps and how to construct them. Technical
report IHMC CmapTools 2006-01, Florida Institute
for Human and Machine Cognition.
Pérez-Marín, D., 2007. Adaptive Computer Assisted
Assessment of free-text students' answers: an
approach to automatically generate students'
conceptual models. Ph.D. dissertation, Escuela
Politécnica Superior, Universidad Autónoma de
Madrid, www.eps.uam.es/~dperez
Pianesi, F., Graziola, I. and Zancanaro, M., 2007. Intrinsic
Motivational Factors for the Intention to Use Adaptive
Technology: Validation of a Causal Model. User
Modeling International Conference, LNAI 4511,
Springer-Verlag, 258-267.
Sigel, I.E. (editor), 1999. Development of mental
representations: Theories and Applications. Lawrence
Erlbaum Associates.
Zapata-Rivera, J.D., 2004. Interacting with inspectable
bayesian student models. International Journal of
Artificial Intelligence in Education, volume 14,
number 2, 127–163.
ICEIS 2008 - International Conference on Enterprise Information Systems
12
