
COLLABORATIVE OLAP WITH TAG CLOUDS
Web 2.0 OLAP Formalism and Experimental Evaluation
Kamel Aouiche, Daniel Lemire and Robert Godin
Universit
´
e du Qu
´
ebec
`
a Montr
´
eal, 100 Sherbrooke West, Montreal, Canada
Keywords:
OLAP, Data Warehouse, Business Intelligence, Tag Cloud, Social Web.
Abstract:
Increasingly, business projects are ephemeral. New Business Intelligence tools must support ad-lib data
sources and quick perusal. Meanwhile, tag clouds are a popular community-driven visualization technique.
Hence, we investigate tag-cloud views with support for OLAP operations such as roll-ups, slices, dices, clus-
tering, and drill-downs. As a case study, we implemented an application where users can upload data and
immediately navigate through its ad hoc dimensions. To support social networking, views can be easily shared
and embedded in other Web sites. Algorithmically, our tag-cloud views are approximate range top-k queries
over spontaneous data cubes. We present experimental evidence that iceberg cuboids provide adequate online
approximations. We benchmark several browser-oblivious tag-cloud layout optimizations.
1 INTRODUCTION
The Web 2.0, or Social Web, is about making avail-
able social software applications on the Web in an
unrestricted manner. Enabling a wide range of dis-
tributed individuals to collaborate on data analysis
tasks may lead to significant productivity gains (Heer
et al., 2007; Wattenberg and Kriss, 2006). Sev-
eral companies, like SocialText and IBM, are offer-
ing Web 2.0 solutions dedicated to enterprise needs.
The data visualization Web sites Many Eyes (IBM,
2007) and Swivel (Swivel, Inc, 2007) have become
part of the Web 2.0 landscape: over 1 million data sets
were uploaded to Swivel in less than 3 months (But-
ler, 2007).
These Web 2.0 data visualization sites use tradi-
tional pie charts and histograms, but also tag clouds.
Tag clouds are a form of histogram which can repre-
sent the amplitude of over a hundred items by varying
the font size. The use of hyperlinks makes tag clouds
naturally interactive. Tag clouds are used by many
Web 2.0 sites such as Flickr, del.icio.us and Techno-
rati. Increasingly, e-Commerce sites such as Amazon
or O’Reilly Media, are using tag clouds to help their
users navigate through aggregated data.
Meanwhile, OLAP (On-Line Analytical Process-
ing) (Codd, 1993) is a dominant paradigm in Busi-
ness Intelligence (BI). OLAP allows domain experts
to navigate through aggregated data in a multidimen-
sional data model. Standard operations include drill-
down, roll-up, dice, and slice. The data cube (Gray
et al., 1996) model provides well-defined semantics
and performance optimization strategies. However,
OLAP requires much effort from database adminis-
trators even after the data has been cleaned, tuned and
loaded: schemas must be designed in collaboration
with users having fast changing needs and require-
ments (Body et al., 2002; Morzy and Wrembel, 2004).
Vendors such as Spotfire, Business Objects and
QlikTech have reacted by proposing a new class of
tools allowing end-user to customize their applica-
tions and to limit the need for centralized schema
crafting (Havenstein, 2003).
OLAP itself has never been formally defined
though rules have been proposed to recognize an
OLAP application (Codd, 1993). In a similar manner,
we propose rules to recognize Web 2.0 OLAP appli-
cations (see also Table 1):
1. Data and schemas are provided autonomously by
users.
2. It is available as a Web application.
3. It supports complete online interaction over ag-
gregated multidimensional data.
4. Users are encouraged to collaborate.
Tag clouds are well suited for Web 2.0 OLAP.
They are flexible: a tag cloud can represent a dozen
or hundred different amplitudes. And they are acces-
5
Aouiche K., Lemire D. and Godin R. (2008).
COLLABORATIVE OLAP WITH TAG CLOUDS - Web 2.0 OLAP Formalism and Experimental Evaluation.
In Proceedings of the Fourth International Conference on Web Information Systems and Technologies, pages 5-12
DOI: 10.5220/0001515800050012
Copyright
c
SciTePress
sible: the only requirement is a browser that can dis-
play different font sizes.
We describe a tag-cloud formalism, as an instance
of Web 2.0 OLAP. Since we implemented a pro-
totype, technical issues will be discussed regarding
application design. In particular, we used iceberg
cubes (Carey and Kossmann, 1997) to generate tag
clouds online when the data and schema are provided
extemporaneously. Because tag clouds are meant to
convey a general impression, presenting approximate
measures and clustering is sufficient: we propose spe-
cific metrics to measure the quality of tag-cloud ap-
proximations. We conclude the paper with experi-
mental results on real and synthetic data sets.
Table 1: Conventional OLAP versus Web 2.0 OLAP.
Conventional OLAP Web 2.0 OLAP
recurring needs ephemeral projects
predefined schemas spontaneous schemas
centralized design user initiative
histograms tag clouds
plots and reports iframes, wikis, blogs
access control social networking
2 RELATED WORK
There are decentralized models (Taylor and Ives,
2006) and systems (Green et al., 2007) to support col-
laborative data sharing without a single schema.
According to Wu et al., it is difficult to navigate
an OLAP schema without help; they have proposed
a keyword-driven OLAP model (Wu et al., 2007).
There are several OLAP visualization techniques in-
cluding the Cube Presentation Model (CPM) (Mani-
atis et al., 2005), Multiple Correspondence Analysis
(MCA) (Ben Messaoud et al., 2006) and other inter-
active systems (Techapichetvanich and Datta, 2005).
Tag clouds have been popularized by the Web site
Flickr launched in 2004.
Several optimization opportunities exist: similar
tags can be clustered together (Kaser and Lemire,
2007), tags can be pruned automatically (Hassan-
Montero and Herrero-Solana, 2006) or by user in-
tervention (Millen et al., 2006), tags can be in-
dexed (Millen et al., 2006), and so on. Tag clouds
can be adapted to spatio-temporal data (Russell, 2006;
Jaffe et al., 2006).
3 OLAP FORMALISM
3.1 Conventional OLAP Formalism
Most OLAP engines rely on a data cube (Gray et al.,
1996). A data cube C contains a non empty set of d
dimensions D = {D
i
}
1≤i≤d
and a non empty set of
measures M . Data cubes are usually derived from
a fact table (see Table 2) where each dimension and
measure is a column and all rows (or facts) have dis-
joint dimension tuples.
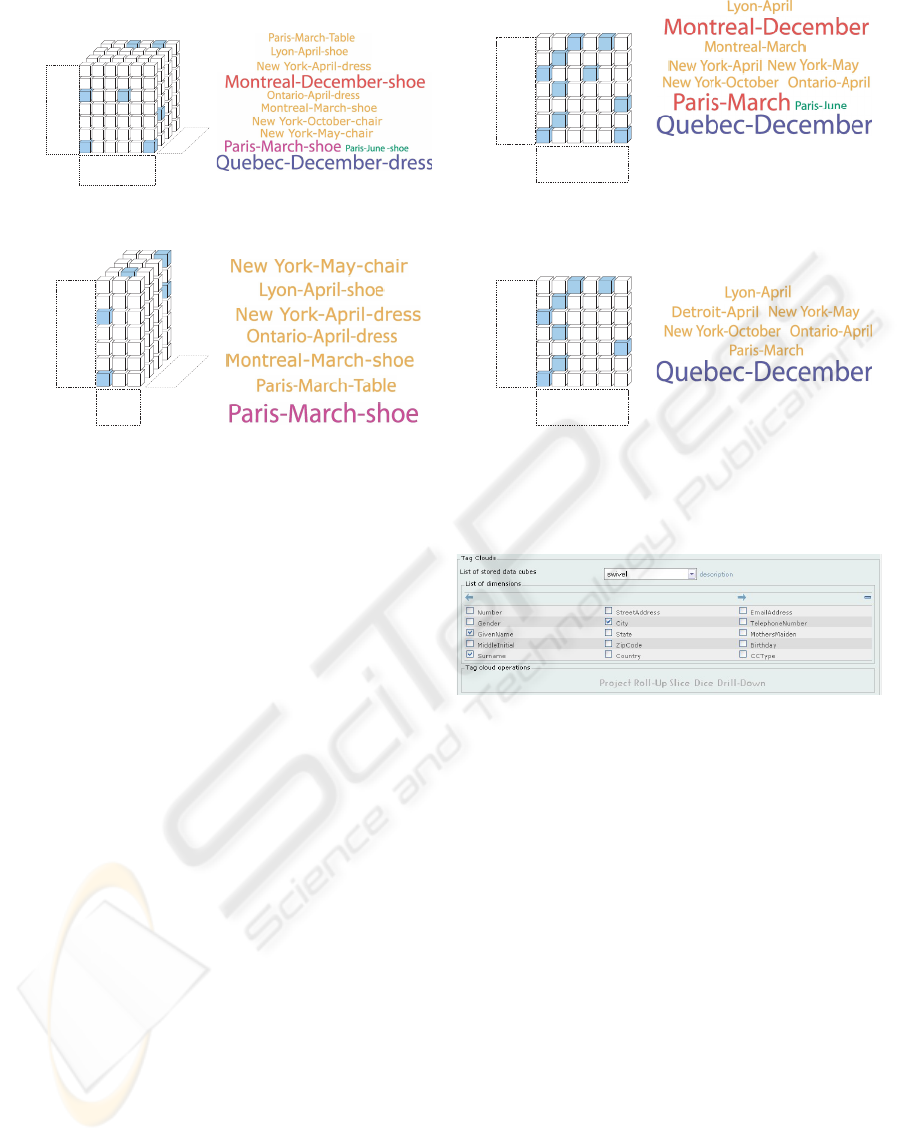
Figure 1(a) gives tridimensional representation of
the data cube.
Table 2: Fact table example.
Dimensions Measures
location time salesman product cost profit
Montreal March John shoe 100$ 10 $
Montreal December Smith shoe 150$ 30 $
Quebec December Smith dress 175$ 45 $
Ontario April Kate dress 90$ 10 $
Paris March John shoe 100$ 20 $
Paris March Marc table 120$ 10 $
Paris June Martin shoe 120$ 5 $
Lyon April Claude dress 90$ 10 $
New York October Joe chair 100$ 10 $
New York May Joe chair 90$ 10 $
Detroit April Jim dress 90$ 10 $
Measures can be aggregated using several opera-
tors such as AVERAGE, MAX, MIN, SUM, and COUNT.
All of these measures and dimensions are typically
prespecified in a database schema. Database adminis-
trators preaggregate views to accelerate queries.
The data cube supports the following operations:
• A slice specifies that you are only interested in
some attribute values of a given dimension. For
example, one may want to focus on one specific
product (see Figure 1(g)). Similarly, a dice selects
ranges of attribute values (see Figure 1(e)).
• A roll-up aggregates the measures on coarser at-
tribute values. For example, from the sales given
for every store, a user may want to see the sales
aggregated per country (see Figure 1(c)). A drill-
down is the reverse operation: from the sales per
country, one may want to explore the sales per
store in one country.
The various specific multidimensional views in
Figure 1 are called cuboids.
3.2 Tag-Cloud LAP Formalism
A Web 2.0 OLAP application should be supported by
a flexible formalism that can adapt a wide range of
WEBIST 2008 - International Conference on Web Information Systems and Technologies
6
Montreal
Paris
Lyon
Ontario
New
York
Detroit
US
10
5
30
20
France
Canada
hcr
a
M
ya
M
e
nu
J
l
i
rp
A
r
e
b
otc
O
r
e
b
m
ec
e
D
Quebec
Shoe
Table
Chair
Dress
{
{
{
{
{
{
ALL
ALL
ALL
locationcountry
time
product
(a) OLAP data cube (b) Tag-cloud data cube
Montreal
Paris
Lyon
Ontario
New
York
Detroit
US
10
10
5
30
30
45
1010
10
10
France
Canada
hcr
a
M
ya
M
e
nu
J
l
i
rp
A
r
e
b
otc
O
r
e
b
m
ec
e
D
Quebec
{
{
{
{
{
ALL
ALL
locationcountry
time
Roll-up on product
(c) OLAP roll-up (d) Tag-cloud roll-up
Montreal
Paris
Lyon
Ontario
New
York
Detroit
US
10
20
France
Canada
hcr
a
M
ya
M
l
i
rp
A
Quebec
Shoe
Table
Chair
Dress
{
{
{
{
{
{
ALL
ALL
ALL
locationcountry
time
product
Dice on the first year semester
(e) OLAP dice (f) Tag-cloud dice
Montreal
Paris
Lyon
Ontario
New
York
Detroit
US
10
10
10
10
10
10
10
45
France
Canada
hcr
a
M
ya
M
e
nu
J
l
i
rp
A
r
e
b
otc
O
r
e
b
m
ec
e
D
Quebec
Slice where product=`shoe’
{
{
{
{
{
ALL
ALL
locationcountry
time
(g) OLAP slice (h) Tag-cloud slice
Figure 1: Conventional OLAP operations vs. tag-cloud OLAP operations.
data loaded by users. Processing time must be rea-
sonable and batch processing should be avoided.
Unlike in conventional data cubes, we do not ex-
pect that most dimensions have explicit hierarchies
when they are loaded: instead, users can specify how
the data is laid out (see Section 5). As a related issue,
the dimensions are not orthogonal in general: there
might be a “City” dimension as a well as “Climate
Zone” dimension. It is up to the user to organize the
cities per climate zone or per country.
Definition 1 (Tag). A tag is a term or phrase de-
scribing an object with corresponding non-negative
weights determining its relative importance. Hence, a
tag is made of a triplet (term, object, weight).
As an example, a picture may have been attributed
the tags “dog” (12 times) and “cat” (20 times). In
a Business Intelligence context, a tag may describe
the current state of a business. For example, the tags
“USA” (16,000$) and “Canada” (8,000$) describe the
sales of a given product by a given salesman.
We can aggregate several attribute values, such as
“Canada” and “March,” into a single term, such as
“Canada–March.” A tag composed of k attribute val-
ues is called a k-tag. Figure 1(b) shows a tag cloud
representation of Table 2 using 3-tags.
Each tag T is represented visually using a font
size, font color, background color, area or motif, de-
pending on its measure values.
Figure 2: User-driven schema design.
3.3 Tag-Cloud Operations
In our system, users can upload data, select a data set,
and define a schema by choosing dimensions (see Fig-
ure 2). Then, users can apply various operations on
the data using a menu bar. On the one hand, OLAP
operations such as slice, dice, roll-up and drill-down
generate new tag clouds and new cuboids from ex-
isting cuboids. Figures 1(d), 1(f) and 1(h), show the
results of a roll-up, a dice, and a slice as tag clouds.
On the other hand, we can apply some operations on
an existing tag cloud: sort by either the weights or
the terms of tags, remove some tags, remove lesser
weighted tags, and so on. We estimate that a tag cloud
should not have more than 150 tags.
Tag-cloud layout has measurable benefits when
trying to convey a general impression (Rivadeneira
et al., 2007). Hence, we wish to optimize the visual
arrangement of tags. Chen et al. propose the com-
putation of similarity measures between cuboids to
help users explore data (Chen et al., 2000): we ap-
COLLABORATIVE OLAP WITH TAG CLOUDS - Web 2.0 OLAP Formalism and Experimental Evaluation
7
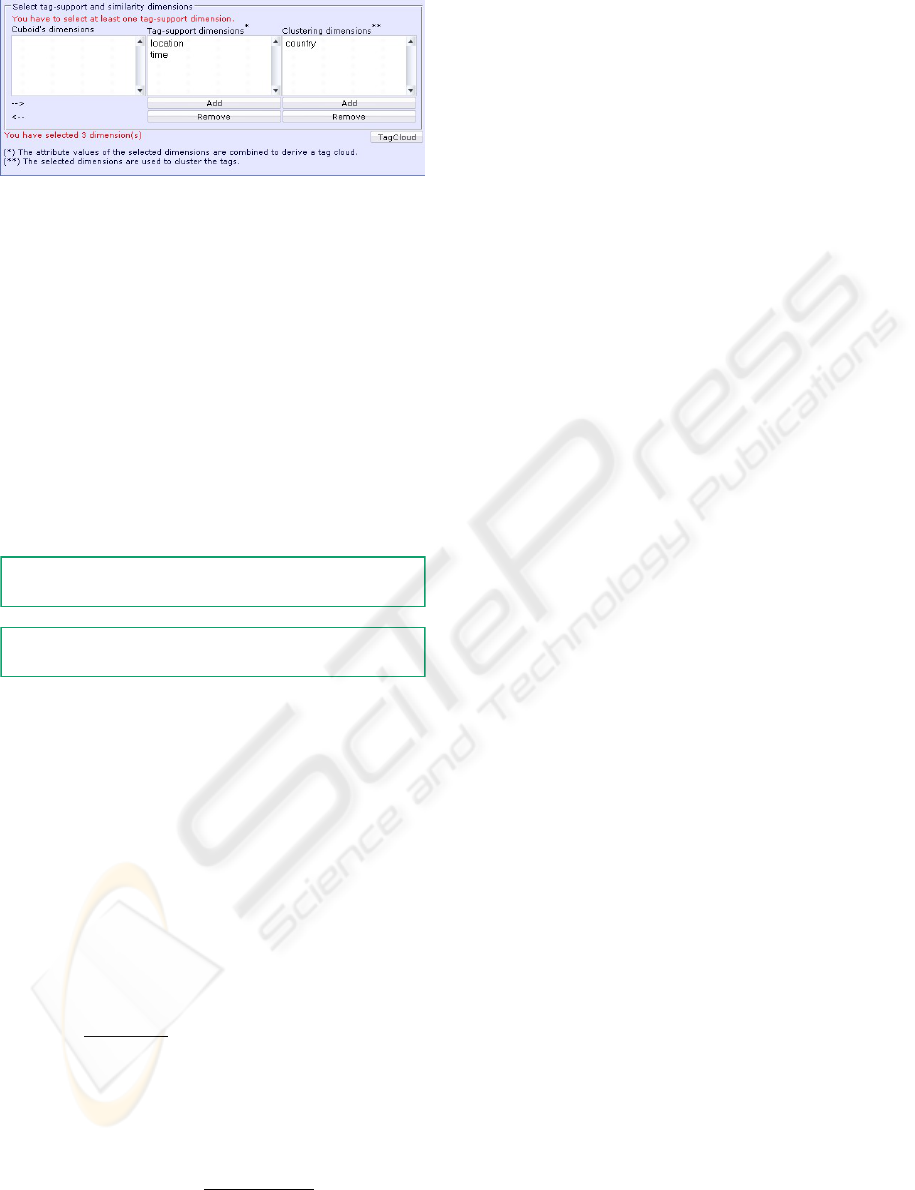
Figure 3: Choosing similarity dimensions.
ply this idea to define similarities between tags. First
of all, users are asked to provide one or several di-
mensions they want to use to cluster the tags. Choos-
ing the “Country” dimension would mean that the
user wants the tags rearranged by countries so that
“Montreal–April” and “Toronto–March” are nearby
(see Figure 3). The clustering dimensions selected by
the user together with the tag-cloud dimensions form
a cuboid: in our example, we have the dimensions
“Country,” “City,” and “Time.” Since a tag contains
a set of attribute values, it has a corresponding sub-
cuboid defined by slicing the cuboid.
Detroit-dress
Lyon-dress
Quebec-dress
Ontario-dress
New York-chair
Montreal-shoe
Paris-table
Paris-shoe
Detroit-dress
Lyon-dress
Quebec-dress
Ontario-dress
New York-chair
Montreal-shoe
Paris-table
Paris-shoe
Without similarity
With similarity
Figure 4: Tag-cloud reordering based on similarity.
Several similarity measures can be applied be-
tween subcuboids: Jaccard, Euclidean distance, co-
sine similarity, Tanimoto similarity, Pearson correla-
tion, Hamming distance, and so on. Which similarity
measure is best depends on the application at hand,
so advanced users should be given a choice. Com-
monly, similarity measures take up values in the in-
terval [−1,1]. Similarity measures are expected to be
reflexive ( f (a,a) = 1), symmetric ( f (a,b) = f (b, a))
and transitive: if a is similar to b, and b is similar to
c, then a is also similar to c.
Recall that given two vectors v and w, the co-
sine similarity measure is defined as cos(v,w) =
∑
i
v
i
w
i
/
q
∑
i
v
2
i
∑
i
w
2
i
= v/|v| · w/|w|. The Tani-
moto similarity is given by
∑
i
v
i
w
i
/(
∑
i
v
2
i
+
∑
i
w
2
i
−
∑
i
v
i
w
i
); it becomes the Jaccard similarity when the
vectors have binary values. Both of these measures
are reflexive, symmetric and transitive. Specifically,
the cosine similarity is transitive by this inequality:
cos(v,z) ≥ cos(w, z) −
p
1 −cos(v,w)
2
. To general-
ize the formulas from vectors to cuboids, it suffices to
replace the single summation by one summation per
dimension. Figure 4 shows an example of tag-cloud
reordering to cluster similar tags. In this example, the
“City–Product” tags were compared according to the
“Country” dimension. The result is that the tags are
clustered by countries.
4 FAST COMPUTATION
Because only a moderate number of tags can be dis-
played, the computation of tag clouds is a form of
top-k query: given any user-specified range of cells,
we seek the top-k cells having the largest measures.
There is a little hope of answering such queries in
near constant-time with respect to the number of facts
without an index or a buffer. Indeed, finding all
and only the elements with frequency exceeding a
given frequency threshold (Cormode and Muthukrish-
nan, 2005) or merely finding the most frequent ele-
ment (Alon et al., 1996) requires Ω(m) bits where m
is the number of distinct items.
Various efficient techniques have been proposed
for the related range MAX problem (Chazelle, 1988;
Poon, 2003), but they do not necessarily generalize.
Instead, for the range top-k problem, we can parti-
tion sparse data cubes into customized data structures
to speed up queries by an order of magnitude (Luo
et al., 2001; Loh et al., 2002a; Loh et al., 2002b).
We can also answer range top-k queries using RD-
trees (Chung et al., 2007) or R-trees (Seokjin et al.,
2005). In tag clouds, precision is not required and ac-
curacy is less important; only the most significant tags
are typically needed. Further, if all tags have similar
weights, then any subset of tag may form an accept-
able tag cloud.
A strategy to speed up top-k queries is to
transform them into comparatively easier iceberg
queries (Carey and Kossmann, 1997). For example,
in computing the top-10 (k = 10) best vendors, one
could start by finding all vendors with a rating above
4/5. If there are at least 10 such vendors, then sort-
ing this smaller list is enough. If not, one can restart
the query, seeking vendors with a rating above 3/5.
Given a histogram or selectivity estimates, we can re-
duce the number of expected iceberg queries (Don-
jerkovic and Ramakrishnan, 1999). Unfortunately,
this approach is not necessarily applicable to multidi-
mensional data since even computing iceberg aggre-
gates once for each query may be prohibitive. How-
ever, iceberg cuboids can still be put to good use. That
is, one materializes the iceberg of a cuboid, small
enough to fit in main memory, from which the tag
clouds are computed. Intuitively, a cuboid represent-
ing the largest measures is likely to provide reason-
WEBIST 2008 - International Conference on Web Information Systems and Technologies
8

Figure 5: Example of non informative tag cloud.
able tag clouds. Users mostly notice tags with large
font sizes (Rivadeneira et al., 2007). A good approx-
imation captures the tags having significantly larger
weights. To determine whether a tag cloud has such
significant tags, we can compute the entropy.
Definition 2 (Entropy of a Tag Cloud). Let T ∈ T
be a tag from a tag cloud T , then entropy(T ) =
−
∑
T ∈T
p(T )log(p(T )) where p(T ) =
weight(T )
∑
x∈T
weight(x)
.
The entropy quantifies the disparity of weights be-
tween tags. The lower the entropy, the more interest-
ing the corresponding tag cloud is. Indeed, tag clouds
with uniform tag weights have maximal entropy and
are visually not very informative (see Figure 5).
We can measure the quality of a low-entropy tag
cloud by measuring false positives and negatives:
false positive happens when a tag has been falsely
added to a tag cloud whereas a false negative occurs
when a tag is missing. These measures of error as-
sume that we limit the number of tags to a moderately
small number. We use the following quality indexes;
index values are in [0,1] and a value of 0 is ideal; they
are not applicable to high-entropy tag clouds.
Definition 3. Given approximate and exact tag
clouds A and E, the false-positive and false-negative
indexes are
max
t∈A,t6∈E
weight(t)
max
t∈A
weight(t)
and
max
t∈E,t6∈A
weight(t)
max
t∈E
weight(t)
.
5 TAG-CLOUD DRAWING
While we can ensure some level of device-
independent displays on the Web, by using images or
plugins, text display in HTML may vary substantially
from browser to another. There is no common set of
font browsers are required to support, and Web stan-
dards do not dictate line-breaking algorithms or other
typographical issues. It is not practical to simulate the
browser on a server. Meanwhile, if we wish to remain
accessible and to abide by open standards, producing
HTML and ECMAScript is the favorite option.
Given tag-cloud data, the tag-cloud drawing prob-
lem is to optimally display the tags, generally using
HTML, so that some desirable properties are met, in-
cluding the following: (1) the screen space usage is
minimized; (2) when applicable, similar tags are clus-
tered together. Typically, the width of the tag cloud is
fixed, but its height can vary.
For practical reasons, we do not wish for the
server to send all of the data to the browser, includ-
ing a possibly large number of similarity measures
between tags. Hence, some of the tag-cloud drawing
computations must be server-bound. There are two
possible architectures. The first scenario is a browser-
aware approach (Kaser and Lemire, 2007): given the
tag-cloud data provided by the server, the browser
sends back to the server some display-specific data,
such as the box dimensions of various tags using dif-
ferent font sizes. The server then sends back an opti-
mized tag cloud. The second approach is browser-
oblivious: the server optimizes the display of the
tag cloud without any knowledge of the browser by
passing simple display hints. The browser can then
execute a final and inexpensive display optimiza-
tion. While browser-oblivious optimization is neces-
sarily limited, it has reduced latency and it is easily
cacheable.
Browser-oblivious optimization can take many
forms. For example, we could send classes of tags
and instruct the browser to display them on separate
lines (Hassan-Montero and Herrero-Solana, 2006). In
our system, tags are sent to the browser as an or-
dered list, using the convention that successive tags
are similar and should appear nearby. Given a simi-
larity measure w between tags, we want to minimize
∑
p,q
w(p,q)d(p, q) where d(p,q) is a distance func-
tion between the two tags in the list and the sum is
over all tags. Ideally, d(p,q) should be the physi-
cal distance between the tags as they appear in the
browser; we model this distance with the index dis-
tance: if tag a appears at index i in the list and
tag b appears at index j, their distance is the inte-
ger |i − j|. This optimization problem is an instance
of the NP-complete MINIMUM LINEAR ARRANGE-
MENT (MLA) problem: an optimal linear arrange-
ment of a graph G = (V,E), is a map f from V onto
{1,2,... ,N} minimizing
∑
u,v∈V
|f (u) − f (v)|.
Proposition 1. The browser-oblivious tag-cloud op-
timization problem is NP-Complete.
There is an O(
√
logn loglog n)-approximation for
the MLA problem (Feige and Lee, 2007) in some
instances. However, for our generic purposes, the
greedy NEAREST NEIGHBOR (NN) algorithm might
suffice: insert any tag in an empty list, then repeat-
edly append a tag most similar to the latest tag in
the list, until all tags have been inserted. It runs in
O(n
2
) time where n is the number of tags. Another
heuristic for the MLA problem is the PAIRWISE EX-
CHANGE MONTE CARLO (PWMC) method (Bhasker
and Sahni, 1987): after applying NN, you repeatedly
consider the exchange of two tags chosen at random,
permuting them if it reduces the MLA cost. Another
COLLABORATIVE OLAP WITH TAG CLOUDS - Web 2.0 OLAP Formalism and Experimental Evaluation
9
0.01
0.1
1
10
100
1000
3 4 5 6 7 8 9 10 11
Time (seconds)
# of dimensions
Original data
Iceberg
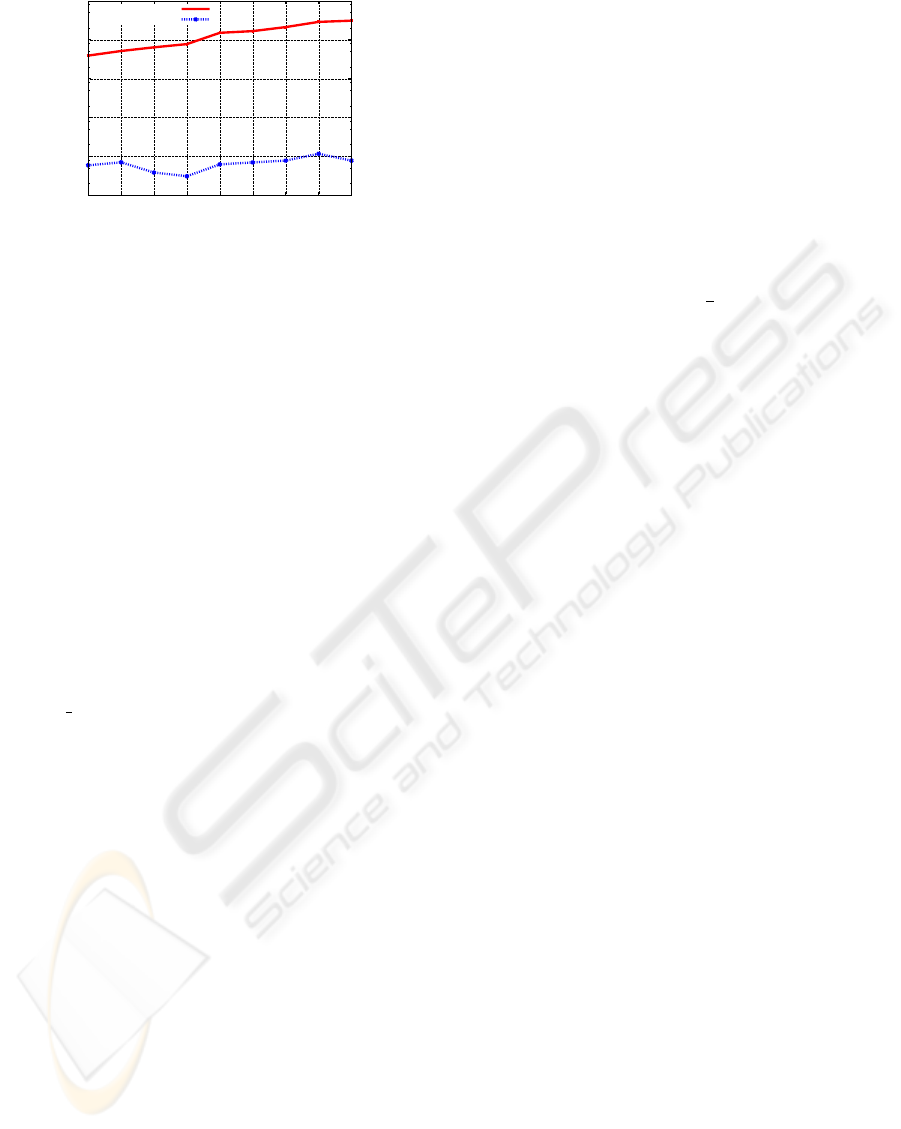
Figure 6: Computing tag clouds from original data vs. ice-
bergs: iceberg limit value set at 150 and tag-cloud size is 9
(US Income 2000).
MONTE CARLO (MC) heuristic begins with the appli-
cation of NN (Johnson et al., 2004): cut the list into
two blocks at a random location, test if exchanging
the two blocks reduces the MLA cost, if so proceed;
repeat.
Additional display hints can be inserted in this list.
For example, if two tags must absolutely be very close
to each other, a GLUED token could be inserted. Also,
if two tags can be permuted freely in the list, then a
PERMUTABLE token could be inserted: the list could
take the form of a PQ tree (Booth and Lueker, 1976).
6 EXPERIMENTS
Throughout these experiments, we used the Java ver-
sion 1.6.0 02 from Sun Microsystems Inc. on an Ap-
ple MacPro machine with 2 Dual-Core Intel Xeon
processors running at 2.66 GHz and 2 GiB of RAM.
6.1 Iceberg-based Computation
To validate the generation of tag clouds from ice-
bergs, we have run tests over the US Income 2000
data set (Hettich and Bay, 2000) (42 dimensions
and about 2 × 10
5
facts) as well as a synthetic
data set (18 dimensions and 2 ×10
4
facts) provided
by Swivel (http://www.swivel.com/data_sets/
show/1002247). Figure 6 shows that while some tag-
cloud computations require several minutes, iceberg-
based computations can be much faster.
From each data set, we generated a 4-dimensional
data cube. We used the COUNT function to aggre-
gate data. Tag clouds were computed from each data
cube using the iceberg approximation with different
values of limit: the number of facts retained. We also
implemented exact computations using temporary ta-
bles. We specified different values for tag-cloud size,
limiting the maximum number of tags. For each ice-
berg limit value and tag-cloud size, we computed the
entropy of the tag cloud, the false-positive and false-
negative indexes, and processing time for both of ice-
berg approximation and exact computation.
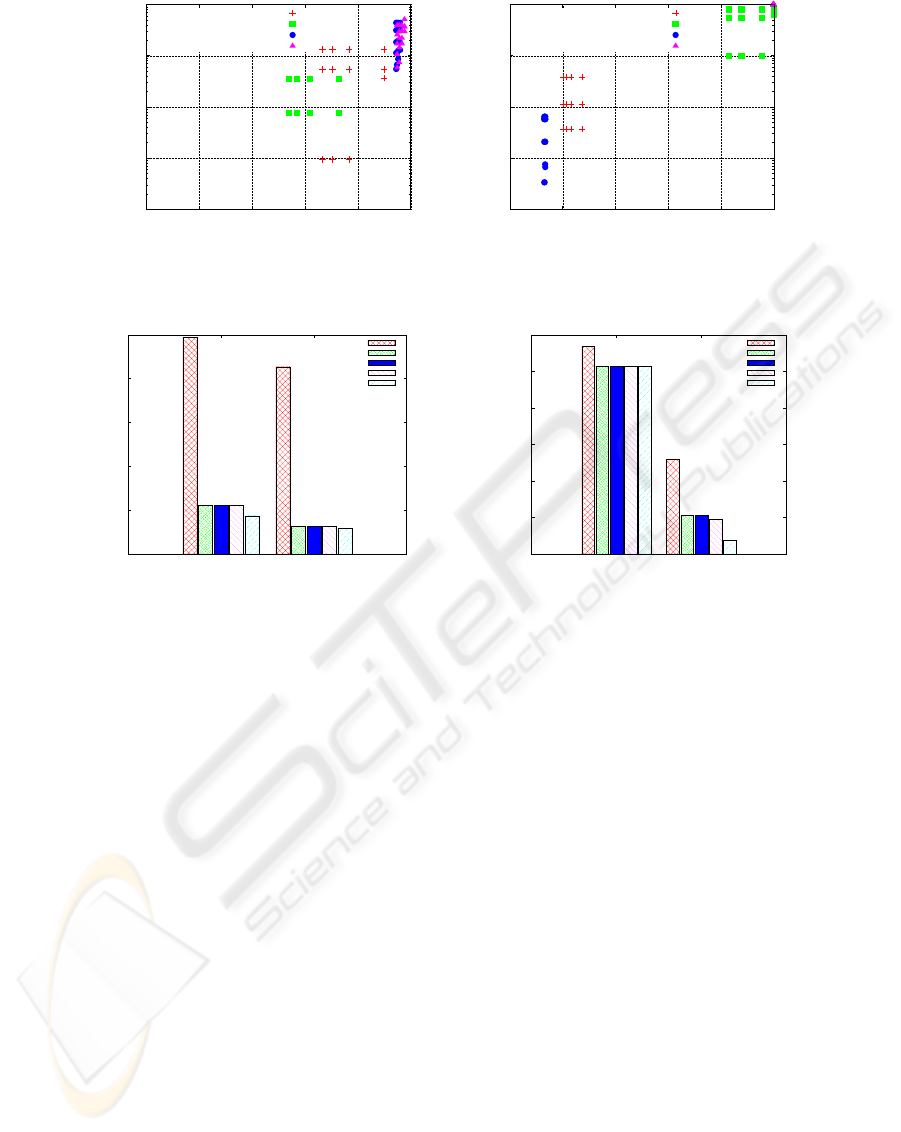
We plotted in Figure 7 the false-positive and false-
negative indexes as a function of the relative en-
tropy (entropy/log(tag-cloud size)) using various ice-
berg limit values (150, 600, 1200, 4800, and 19600)
and various tag-cloud sizes (50, 100, 150, and 200),
for a total of 20 tag clouds per dimension. The Y axis
is in a logarithmic scale. Points having their in-
dexes equal to zero are not displayed. As discussed
in Section 4, false-positive and false-negative indexes
should be low when the entropy is low. We verify
that for low-entropy values (<
3
4
log(tag-cloud size)),
the indexes are always close to zero which indicates
a good approximation. Meanwhile, small iceberg
cuboids can be processed much faster.
6.2 Similarity Computation
Using our two data sets, we tested the NN, PWMC,
and MC heuristics using both the cosine and the Tan-
imoto similarity measures. From data cubes made
of all available dimensions, we used all possible 1-
tag clouds, using successively all other dimensions as
clustering dimension for a total of 2×(18×17 +42×
41) = 4056 layout optimizations. The iceberg limit
value was set at 150. The MC heuristic never fared
better than NN, even when considering a very large
number of random block permutations: we rejected
this heuristic as ineffective. However, as Figure 8
shows, the PWMC heuristic can sometimes signifi-
cantly outperform NN when a large number (1000) of
tag exchanges are considered, but it only outperforms
NN by more than 20% in less than 5% of all layout op-
timizations. Meanwhile, PWMC can be several order
of magnitudes slower than NN: NN is 10 times faster
than PWMC with 100 exchanges and 70 times faster
than PWMC with 1000 exchanges. Computing the
similarity function over an iceberg cuboid was mod-
erately expensive (0.07 s) for a small iceberg cuboid
(limit set to 150 cells): the exact computation of the
similarity function can dwarf the cost of the heuristics
(NN and PWMC) over a moderately large data set.
Informal tests suggest that NN computed over a small
iceberg cuboid provides significant visual layouts.
7 CONCLUSIONS
According to our experimental results, precomputing
a single iceberg cuboid per data cube allows to gen-
erate adequate approximate tag clouds online. Com-
bined with modern Web technologies such as AJAX
WEBIST 2008 - International Conference on Web Information Systems and Technologies
10
0.0001
0.001
0.01
0.1
1
0 0.2 0.4 0.6 0.8 1
False-positive and false-negative indexes
entropy/log(tag-cloud size)
State(52)
MiddleInitial (26)
Surname (7270)
City (4102)
(a) Swivel
0.0001
0.001
0.01
0.1
1
0 0.2 0.4 0.6 0.8 1
False-positive and false-negative indexes
entropy/log(tag-cloud size)
Country of birth (43)
Age (91)
Capital losses (1478)
Household (99800)
(b) US Income 2000
Figure 7: False-negative and false-positive indexes (0 is best, 1 is worst), values under 0.0001 are not included.
0
5000
10000
15000
20000
25000
COSINE TANIMOTO
MLA cost
No Clustering
NN
PWMC10
PWMC100
PWMC1000
(a) Displaying dimension “Givenname” and clustering
by “State” (Swivel)
1e+006
1.02e+006
1.04e+006
1.06e+006
1.08e+006
1.1e+006
1.12e+006
COSINE TANIMOTO
MLA cost
No Clustering
NN
PWMC10
PWMC100
PWMC1000
(b) Displaying dimension “HHDFMX” and clustering
by “ARACE” (US Income 2000)
Figure 8: MLA costs for two examples: the PWMC heuristic was applied using 10, 100 and 1000 random exchanges.
and JSON, it provides a responsive application. How-
ever, we plan to make more precise the relationship
between iceberg cubes, entropy, dimension sizes, and
our quality indexes. Yet another approach to com-
pute tag clouds quickly may be to use a bitmap in-
dex (O’Neil and Quass, 1997). While we built a
Web 2.0 with support for numerous collaborations
features such as permalinks, tag-cloud embeddings
with iframe elements, we still need to experiment
with live users. Our approach to multidimensional tag
clouds has been to rely on k-tags. However, this ap-
proach might not be appropriate when a dimension
has a linear flow such as time or latitude. A more ap-
propriate approach is to allow the use of a slider (Rus-
sell, 2006) tying several tag clouds, each one corre-
sponding to a given attribute value.
ACKNOWLEDGEMENTS
The second author is supported by NSERC
grant 261437 and FQRNT grant 112381. The third
author is supported by NSERC grant OGP0009184
and FQRNT grant PR-119731. The authors wish to
thank Owen Kaser from UNB for his contributions.
REFERENCES
Alon, N., Matias, Y., and Szegedy, M. (1996). The space
complexity of approximating the frequency moments.
In STOC ’96, pages 20–29.
Ben Messaoud, R., Boussaid, O., and Loudcher Rabas
´
eda,
S. (2006). Efficient multidimensional data represen-
tations based on multiple correspondence analysis. In
KDD’06, pages 662–667.
Bhasker, J. and Sahni, S. (1987). Optimal linear arrange-
ment of circuit components. J. VLSI Comp. Syst.,
2(1):87–109.
Body, M., Miquel, M., B
´
edard, Y., and Tchounikine, A.
(2002). A multidimensional and multiversion struc-
ture for OLAP applications. In DOLAP ’02, pages
1–6.
Booth, K. S. and Lueker, G. S. (1976). Testing for the con-
secutive ones property, interval graphs, and graph pla-
narity using PQ-tree algorithms. Journal of Computer
and System Sciences, 13:335–379.
Butler, D. (2007). Data sharing: the next generation. Na-
ture, 446(7131):1–10.
Carey, M. J. and Kossmann, D. (1997). On saying “enough
already!” in SQL. In SIGMOD’97, pages 219–230.
COLLABORATIVE OLAP WITH TAG CLOUDS - Web 2.0 OLAP Formalism and Experimental Evaluation
11

Chazelle, B. (1988). A functional approach to data struc-
tures and its use in multidimensional searching. SIAM
J. Comput., 17(3):427–462.
Chen, Q., Dayal, U., and Hsu, M. (2000). OLAP-based
data mining for business intelligence applications in
telecommunications and e-commerce. In DNIS ’00,
pages 1–19.
Chung, Y., Yang, W., and Kim, M. (2007). An efficient, ro-
bust method for processing of partial top-k/bottom-k
queries using the RD-tree in OLAP. Decision Support
Systems, 43(2):313–321.
Codd, E. (1993). Providing OLAP (on-line analytical pro-
cessing) to user-analysis: an IT mandate. Technical
report, E.F. Codd and Associates.
Cormode, G. and Muthukrishnan, S. (2005). What’s hot and
what’s not: tracking most frequent items dynamically.
ACM Trans. Database Syst., 30(1):249–278.
Donjerkovic, D. and Ramakrishnan, R. (1999). Probabilis-
tic optimization of top n queries. In VLDB’99, pages
411–422.
Feige, U. and Lee, J. R. (2007). An improved approxima-
tion ratio for the minimum linear arrangement prob-
lem. Inf. Process. Lett., 101(1):26–29.
Gray, J., Bosworth, A., Layman, A., and Pirahesh, H.
(1996). Data cube: A relational aggregation opera-
tor generalizing group-by, cross-tab, and sub-total. In
ICDE ’96, pages 152–159.
Green, T. J., Karvounarakis, G., Taylor, N. E., Biton, O.,
Ives, Z. G., and Tannen, V. (2007). ORCHESTRA: fa-
cilitating collaborative data sharing. In SIGMOD ’07,
pages 1131–1133, New York, NY, USA. ACM.
Hassan-Montero, Y. and Herrero-Solana, V. (2006). Im-
proving tag-clouds as visual information retrieval in-
terfaces. In InSciT’06.
Havenstein, H. (2003). BI vendors seek to tap end-user
power: New class of tools built to reap user knowl-
edge for customizing analytic applications. InfoWorld,
22:20–21.
Heer, J., Vi
´
egas, F. B., and Wattenberg, M. (2007). Voy-
agers and voyeurs: supporting asynchronous collab-
orative information visualization. In CHI ’07, pages
1029–1038.
Hettich, S. and Bay, S. D. (2000). The UCI KDD archive.
http://kdd.ics.uci.edu. [Online; accessed 21/12/2007].
IBM (2007). Many Eyes.
http://services.alphaworks.ibm.com/manyeyes/
[Online; accessed 7-6-2007].
Jaffe, A., Naaman, M., Tassa, T., and Davis, M. (2006).
Generating summaries and visualization for large col-
lections of geo-referenced photographs. In MIR ’06,
pages 89–98.
Johnson, D., Krishnan, S., Chhugani, J., Kumar, S., and
Venkatasubramanian, S. (2004). Compressing large
boolean matrices using reordering techniques. In
VLDB’04, pages 13–23.
Kaser, O. and Lemire, D. (2007). Tag-cloud drawing: Algo-
rithms for cloud visualization. In WWW 2007 – Tag-
ging and Metadata for Social Information Organiza-
tion.
Loh, Z., Ling, T., Ang, C., and Lee, S. (2002a). Adaptive
method for range top-k queries in OLAP data cubes.
In DEXA’02, pages 648–657.
Loh, Z. X., Ling, T. W., Ang, C. H., and Lee, S. Y. (2002b).
Analysis of pre-computed partition top method for
range top-k queries in OLAP data cubes. In CIKM’02,
pages 60–67.
Luo, Z., Ling, T., Ang, C., Lee, S., and Cui, B. (2001).
Range top/bottom k queries in OLAP sparse data
cubes. In DEXA’01, pages 678–687.
Maniatis, A., Vassiliadis, P., Skiadopoulos, S., Vassiliou,
Y., Mavrogonatos, G., and Michalarias, I. (2005). A
presentation model & non-traditional visualization for
OLAP. International Journal of Data Warehousing
and Mining, 1:1–36.
Millen, D. R., Feinberg, J., and Kerr, B. (2006). Dogear:
Social bookmarking in the enterprise. In CHI ’06,
pages 111–120.
Morzy, T. and Wrembel, R. (2004). On querying versions
of multiversion data warehouse. In DOLAP ’04, pages
92–101.
O’Neil, P. and Quass, D. (1997). Improved query perfor-
mance with variant indexes. In SIGMOD ’97, pages
38–49.
Poon, C. (2003). Dynamic orthogonal range queries in
OLAP. Theoretical Computer Science, 296(3):487–
510.
Rivadeneira, A. W., Gruen, D. M., Muller, M. J., and
Millen, D. R. (2007). Getting our head in the clouds:
toward evaluation studies of tagclouds. In CHI’07,
pages 995–998.
Russell, T. (2006). cloudalicious: folksonomy over time. In
JCDL’06, pages 364–364.
Seokjin, H., Moon, B., and Sukho, L. (2005). Efficient exe-
cution of range top-k queries in aggregate r-trees. IE-
ICE – Transactions on Information and Systems, E88-
D(11):2544–2554.
Swivel, Inc (2007). Swivel. http://www.swivel.com. [On-
line; accessed 7-6-2007].
Taylor, N. E. and Ives, Z. G. (2006). Reconciling while
tolerating disagreement in collaborative data sharing.
In SIGMOD ’06, pages 13–24, New York, NY, USA.
ACM.
Techapichetvanich, K. and Datta, A. (2005). Interactive vi-
sualization for OLAP. In ICCSA ’05, pages 206–214.
Wattenberg, M. and Kriss, J. (2006). Designing for social
data analysis. IEEE Transactions on Visualization and
Computer Graphics, 12(4):549–557.
Wu, P., Sismanis, Y., and Reinwald, B. (2007). Towards
keyword-driven analytical processing. In SIGMOD
’07, pages 617–628.
WEBIST 2008 - International Conference on Web Information Systems and Technologies
12
