
A PROTOTYPE FOR ON-LINE MONITORING AND CONTROL
OF ENERGY PERFORMANCE FOR RENEWABLE ENERGY
BUILDINGS
Benjamin Paris, Julien Eynard, Gregory François, Thierry Talbert and Monique Polit
Laboratoire ELIAUS, Université de Perpignan Via Domitia, 52 avenue Paul Alduy, 66860 Perpignan, France
Keywords: Renewable energies, Energy performance indicators, Monitoring system, Smart transducers, Control
algorithms, Predictive control, Optimal control, High efficiency buildings.
Abstract: In this article, ways for improving the energetic performance of buildings are investigated. A state of the art
leads to the introduction of a performance indicator expressed in kWh/m
2
/yr. To improve the value of this
indicator, a processor-based prototype of a real-time data-acquisition and monitoring system is developed in
collaboration with two industrial companies. The set of measurements and corresponding sensors that are
necessary to compute the value of the indicator while being consistent with the natural segmentation of
energy consumption, is listed, thanks to the representation of the building using a systemic approach.
Control algorithms are tested in simulation to improve renewable energy consumption while reducing fossil
energy dependence, which are deemed to be applicable in practice using the proposed electronics.
Simulations concerning the control and optimization of the power applied to two warmers in a room show
large potential for fossil energy consumption reduction.
1 INTRODUCTION
Nowadays, it is widely admitted that climate
change is induced by the intense human activity,
and that greenhouse effect gases (GEG) exhaustion
is one of the main contributors to this
phenomenon. Hence, the decision to stabilize or to
reduce GEG emission was taken in the late nineties
by most of the industrialized country.
In France, 25% of GEG emissions and 46% of
global energy consumption (Ademe, 2007) are due
to the buildings. Using legal documentation, e.g.
“Réglementation Thermique 2005” (RT2005), or
“Diagnostic de Performance Energétique” (DPE),
(Sesolis, 2006), French government would like to
restrict building energy consumption while
limiting wastefulness. Labels are investigated to
promote good practice and make the French public
opinion sensitive to these issues. In Europe, the
situation is similar, witness the development of
Swiss and German labels: “Minergie” and
“Passivhause”, respectively. Hence, performance
of building materials, design or management,
needs to be improved.
However, one of the main difficulties when trying
to achieve this purpose lies in the fact that energy
consumption may vary from a building to another. In
addition, energy consumption is segmented in terms
of objectives. In this context, the method of choice for
improving building energetic behaviour without
reducing comfort is obviously to reduce the
dependency to fossil energy by, e.g., developing the
use of renewable energies. To achieve this goal, it is
needed to: (i) characterize global and segmented
energy consumption in a building, (ii) compute a
performance indicator that takes into account the
environment of the building, as well as the way
energy is consumed, (iii) acquire and process data
measurements to monitor energy consumption, (iv)
propose control and optimization strategies for
promoting the use of renewable energies.
The goal of this work, performed in collaboration
with Apex BP Solar, Pyrescom and CSTB (Centre
Scientifique et Technique du Bâtiment), is to develop
a prototype of a commercially viable tool that will be
able to perform the four aforementioned tasks. To be
cost-effective, the tool needs to be small and easy to
handle, to remain relatively cheap, to avoid the
implementation of many sensors, to be applicable to
125
Paris B., Eynard J., François G., Talbert T. and Polit M. (2008).
A PROTOTYPE FOR ON-LINE MONITORING AND CONTROL OF ENERGY PERFORMANCE FOR RENEWABLE ENERGY BUILDINGS.
In Proceedings of the Fifth International Conference on Informatics in Control, Automation and Robotics - SPSMC, pages 125-130
DOI: 10.5220/0001487201250130
Copyright
c
SciTePress

various buildings, regardless their localization, and
to propose solutions depending on energy
consumption segmentation.
In this context, the goal of this paper is not only
to discuss independently the choice of the
electronics or the choice of a specific control law
but rather to present the approach as a whole. To
estimate energetic performance, an indicator is
necessary that is firstly defined. To compute this
indicator, the set of needed measurements and
corresponding sensors is listed. These sensors are
also capable of providing information about the
segmentation of energy consumption. To process
the acquired data, appropriate electronics are
needed. Hence, a processor-based electronic
architecture is proposed. The advantages of the use
of a processor instead of a standard microcontroller
are discussed. Finally, control laws should be
implemented to reduce fossil energy consumption.
Hence, such laws (potentially applicable using the
chosen processor) are investigated in simulation to
enforce the use of renewable energies.
The corresponding simulated illustrative
example deals with the energy consumption
reduction in a room, which is assumed to be
equipped with two controllable warmers,
respectively using renewable (W
RE
) and fossil
(W
F
) energies. To reduce fossil energy
consumption, a mix of on-line and predictive
control laws is proposed and compared to open
loop simulations and to standard online control
laws. The general underlying idea is to use W
F
if
predictions or measurements indicate that W
RE
reaches saturation. In simulation, this approach
leads to a large energy consumption reduction.
This article is organized as follows: Section 2
discusses the choice of a performance indicator.
Section 3 presents the prototype of the data-
acquisition system, while its applicability for on-
line control and optimization of the energetic
behaviour of buildings is investigated in simulation
in Section 4. Finally, Section 5 concludes the
paper.
2 PERFORMANCE INDICATOR
2.1 Choice of the Indicator
Almost twenty years ago, the energetic
performance of building was not a strong
preoccupation for governments, building material
suppliers or real estate developers. Then, energy
performance turned to a priority due to the impact
of greenhouse effect gases together with the high level
of energy costs. The first indicator proposed was a
measurement of energy consumption (Duffaure-
Gallais, 2006). However, it did not allow performing
comparisons regarding localization or areas of the
buildings. Recent researches provided specific
documentation, which explains the method for
computing a global indicator, i.e. annual energy
consumption per square meter (kWh/m
2
/yr), and fixes
clear objectives in terms of energy consumption. This
unit allows comparison between different buildings,
with different constraints.
In France, successive governments have been
showing a strong will to reduce human impact on
climate (Maïzi, 2007), witness the attribution of
“HPE” and “THPE” (Journal Officiel, 2006) labels
whenever the energetic performance is 10% or 20%
less than standard energy consumption. The
underlying idea is very similar to the American
“Energy Star” (Boyd, 2007) that is used in industry.
Recently, the “HPE ENR” label was created to
promote renewable energies. For old constructions,
the DPE (Energetic Performance Diagnosis) label is
expressed in kWh/m
2
/yr as well. Software, such as
“3CL Excel
©
” (CSTB), which are based on building
materials parameters (thermal conductivity insulation,
glazing losses …), on the building design or
equipment, can be used to compute the DPE index to
classify buildings according to their levels of energy
consumption.
However, the chosen indicator only provides a
cumulated indication about energy consumption that
aggregates different consumptions, e.g. for heating or
cooling. In practice, European labels do not always
use the same variables to compute this indicator and
do not fix the same goals to reach: “Minergie” label
suggests 42 kWh/m
2
/yr only for heating, while
“PassivHause” label considers 30 kWh/m
2
/yr as
normal energy consumption for heating and
ventilation...
2.2 Environmental Factors and Energy
Segmentation
In order to establish a fair diagnosis of the energetic
behaviour of a building and to control energy
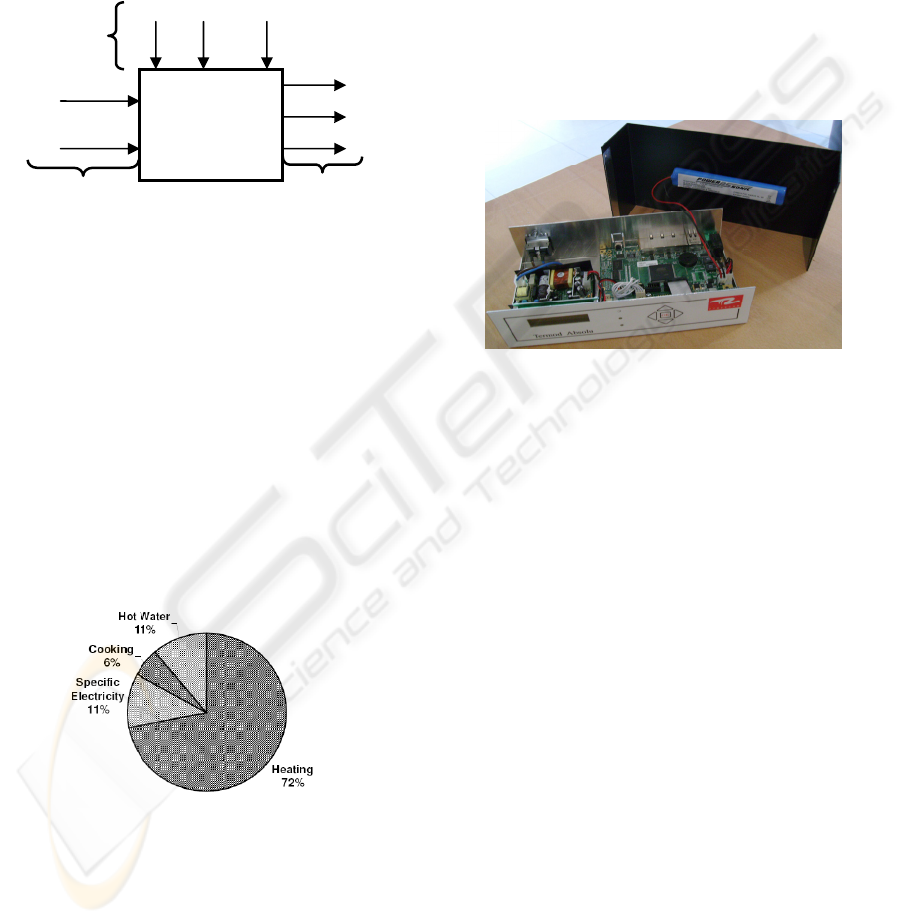
consumption, buildings can be represented as dynamic
systems, interacting with their environment, which
consume energy with regard to different objectives
(fig. 1).
It is proposed to focus on the following
environmental factors:
1. Indoor and outdoor temperatures that can be
acquired with smart transducers…
ICINCO 2008 - International Conference on Informatics in Control, Automation and Robotics
126
2. Wind and solar radiation that can help
explaining many consumption levels or provide
information about renewable energy availability.
3. Indoor relative humidity, which represents a
specific comfort parameter and, thus, affects the
user’s behaviour.
4. If meteorological predictions are available,
which is recommended, pressure can also be
measured.
Figure 1: Building System and Interactions.
Buildings use different energies with a large
emphasis on electricity. In the case of several kinds
of sources (fuel, gas, electricity are used),
computation rules exist to estimate the individual
contributions to the indicator. The following list
summarizes the main sources (inputs) of energy
consumed in buildings, together with the
objectives (outputs):
1. Electricity (includes heating …).
2. Specific electricity: (electricity that cannot be
substituted by any other type of energy).
3. Cooling and ventilation energy.
4. Heating energy (apart from electricity): fuel
oil, gas or wood.
Figure 2: Segmentation of Energy End-Uses in
Household (Ademe).
Figure 2 provides the typical energy
consumption segmentation. Obviously, the main
output is heating, hence the need for focusing on
heating control and optimization for reducing
energy consumption.
3 INSTRUMENTATION AND DATA
ACQUISITION
3.1 Monitoring System Prototype
The acquisition of the aforementioned variables
requires the choice of appropriate electronics.
However: (i) implementation should be easy and (ii)
total cost should remain rather low. In collaboration
with our industrial partners, such architecture was
developed and implemented at three different
locations (Apex BP Solar and Pyrescom headquarters
and at the University of Perpignan).
Figure 3: Monitoring System Prototype.
The prototype, which can be seen on Figure 3, is
divided into two separate parts: (i) a core-bloc
(composed of a low power processor, corresponding
memory, and integrated hosts controllers), and (ii) a
set of adaptable bloc sensors, which means that it is
possible to record and process different data.
3.2 Data Acquisition System
As mentioned, with the chosen architecture, it is
possible to use both information concerning energy
consumption segmentation and operating conditions
measurements. The smart transducers transmit data to
the monitoring system discussed in the next
subsection, through preferably a Controlled Area
Network (CAN) bus. To avoid drilling, or pulling
cable, wireless or Power Line Communication (PLC)
systems are also studied.
Constraints discussed previously have been taken
into account and the quantity and localization of
implemented transducers depend on the interactions
within the building and on the impact of disturbances.
Heating
Cooling
…
Building
Fossil Energy
Renewable Energies
Inputs Outputs
T
ext
P
ext
…
Disturbances
A PROTOTYPE FOR ON-LINE MONITORING AND CONTROL OF ENERGY PERFORMANCE FOR RENEWABLE
ENERGY BUILDINGS
127
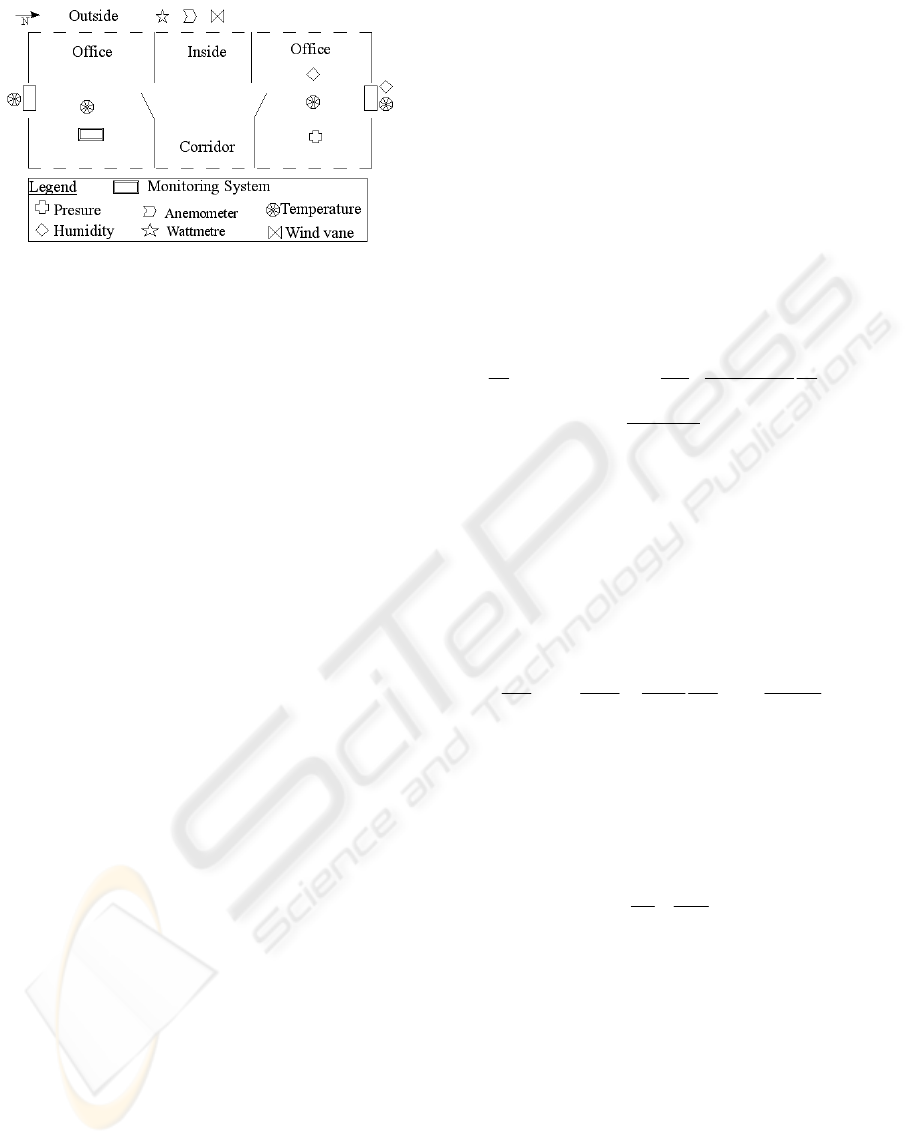
Figure 4: Smart Transducers and Monitoring System
Localization (University Offices).
Figure 4 shows the example of the University’s
offices, where one of the three experimental setups
is under implementation. Researches (Hensen,
1991) on heating control systems or on energetic
efficiency (Mendoça, 2003, 2007) showed that
north front temperature and inside temperature
measurements are definitely musts for heating
control purposes.
In addition, a compromise was found between
the number of transducers, avoiding information
redundancy and total cost. To generalize this
approach to a broader range of customers, indirect
measurements were preferred whenever possible.
Note that, for confidentiality reasons, more details
concerning the sensors cannot be given. However,
all these sensors can interact with the processor
described in the following subsection.
3.3 Core Architecture
It is proposed to use an ARM9
©
processor instead
of a microcontroller, which is typically used in the
metrology literature (Gungor, 1997, Leong, 1998),
since:
1. ARM9
©
has a low level of energy
consumption.
2. Hosts controllers are already integrated for: (i)
connectivity, (ii) control purposes, (iii) human
interface (CSI, Keypad…), (iv) memory
expansion (MMC, PCMCIA…), and (v)
providing e.g. Bluetooth communication.
3. Computation power is higher (4-8 bits versus
32-64 bits, 40 MHz versus 100-400 MHz).
4. Its high level of memory allows the handling
of a higher number of different kinds of signals
(Segars, 1998, Xingwu, 2006).
5. Control laws can be implemented, e.g. energy
consumption prediction (Kalogirou, 2000), fuzzy
logic (Lygouras, 2006) or fault diagnosis
(Kalogirou, 2007).
4 ILLUSTRATIVE EXAMPLE
In this section, modelling and control of university
offices temperature was investigated in simulation.
The control methods were chosen to be potentially
applicable with the prototype discussed above.
4.1 Model Description
The modelled room (Figure 4) corresponds to a
University office, where one of the prototypes is
installed, and is 10m long, with a north/south
orientation. To represent the thermal behaviour of this
room a dynamic model is developed as shown in
Equation (1):
{}
()
∑
∑
+
⎪
⎭
⎪
⎬
⎫
⎪
⎩
⎪
⎨
⎧
∂
∂
+
∂
∂
=
∂
∂
=
i
i
pi
pi
zyxiii
i
i
zyxP
zyx
zyxa
i
T
Cpzyx
zyxh
i
T
zyxa
t
T
),,(
),,(
,,
),,(
),,(
),,(
,,
2
2
λ
ρ
(1)
Where: (λ/ρC
p
) is the diffusivity coefficient
(m
2
/s), λ is the conduction coefficient (W/m.K), ρ is
the density (kg/m
3
), C
p
the calorific capacity (J/kg.K),
h stands for the convection coefficient (W/m
2
.K) and
P
i
is power density of the i
th
heat source (W/m
3
). In
order to fine down equation (1), the room is supposed
to be constituted by a homogenous and isotropic
material, and y- and z-axes are assumed to have
infinite lengths. Thus, equation (1) becomes:
i
iii
xi
x
P
Cp
a
x
T
Cp
h
x
T
a
t
T
∑
+
∂
∂
+
∂
∂
=
∂
∂
ρρ
2
2
(2)
The Crank-Nicholson discrimination method was
preferred due to the increased simulation stability and
the reduced truncation error (Nougier, 1993). One-
dimension heat propagation was considered to
promote the preferential direction. External conditions
influence the front temperature of the walls by
convection, as can be seen in Equation (3):
Cp
Th
x
T
ρ
Δ
=
∂
∂
(3)
Model parameters used were (Sacadura, 1993): air
diffusivity coefficient: 2.22.10
-5
m
2
/s, concrete
diffusivity coefficient: 4.2.10
-5
m
2
/s, air conductivity
coefficient: 0.03 W/m.K, indoor and outdoor
convection coefficients 10 and 30 W/m
2
.K,
respectively, air density: 1.177 kg/m
3
and air specific
heat: 1.006 kJ/kg.K. Open loop simulations were
performed using real external temperature
measurements and constant and equal powers (396W).
Figure 5 presents the simulation results, using real
external temperature data. Note that walls play the
role of linear filters, which explains the stability of the
indoor temperature profile. Energy consumptions of
the warmers were constant and equal to 792 Wh/m
2
.
ICINCO 2008 - International Conference on Informatics in Control, Automation and Robotics
128
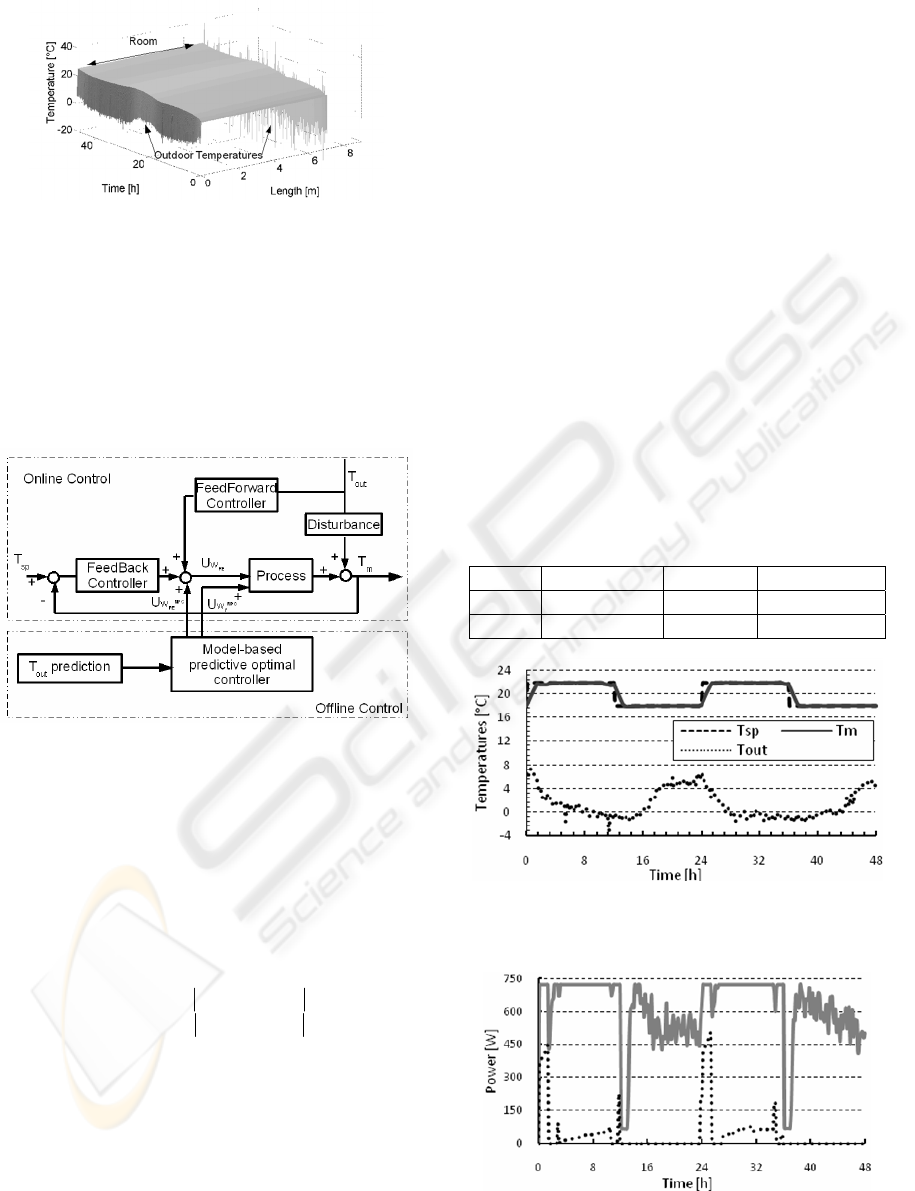
Figure 5: Room Temperature Profile with Open-Loop
Control.
4.2 Model Predictive Control
Model Predictive Control (García, 1989) is a
process control method that uses: (i) a dynamic
model of the process, (ii) past control history and
(iii) cost optimization over a prediction
horizon
p
H
, as shown in Figure 6.
Figure 6: Mixed FB/FF and Predictive Control Scheme.
Such an approach was already tested in this
context, but using static modelling, (Kalagasidis,
2006). The corresponding optimization problem is
formulated as follows:
()()
() ()
() ()
0
0
)(
)(
(3)-(2) Equations:s.t.
min
maxmin
maxmin
1
2
,
=−
=−
≤≤
≤≤
⎟
⎟
⎠
⎞
⎜
⎜
⎝
⎛
∑
=
cspcm
psppm
WWW
WWW
Hp
k
WF
UU
HTHT
HTHT
UtUU
UtUU
kU
RERERE
FFF
MPC
WREWF
(4)
Where
F
W
U
and
MPC
W
RE
U
are the power applied to
W
F
and an extra-power applied to W
RE
. The idea
herein is to use W
RE
upon saturation before using
W
F
. Hence,
)()()(t, tUtUtU
MPC
W
FFPI
WW
RERERE
+=∀
+
,
where
FFPI
W
RE
U
+
is the contribution to the power
applied to W
RE
computed by the on-line controller.
The advantage of this formulation is that,
while
max
)(
RERE
WW
UtU ≤
,
0=
F
W
U
for optimality. It is
imposed that the room temperature reaches its setpoint
at H
c
and H
p
while minimizing
F
W
U
(Equation 4). W
RE
is controlled through online Feedback/Feedforward
Control, while W
F
power increments are computed by
MPC, using
h2=
p
H
and
h3
0
1=
c
H
. The optimization
problem uses biased external temperatures predictions
by means of a 1°C oscillating prediction error.
Figures 7 and 8 show the temperatures time
profiles and the powers applied to the warmers,
respectively, and Table 1 summarizes energy
consumption for the investigated scenarios.
Feedback/Feedforward (FB/FF) of the two warmers,
for which priority is given to W
RE
, was also
investigated for comparison purposes. It seems that
most of the reduction is due to the use of time-varying
setpoint (see FB/FF results), while setpoint tracking is
efficiently achieved. However, this table shows that
MPC allows a 7% additional fossil energy
consumption reduction when compared to FB/FF.
Table 1: Performance Indicator Values for the Different
Control Strategies.
Open-loop FB/FF FB/FF+MPC
W
RE
792 1223.3 1227.6
W
F
792 100.9 93.5
Figure 7: Room, Setpoint and Outdoor Temperatures for
FB/FF+MPC Control.
Figure 8: Power Profiles Applied to the Warmers for
FB/FF+MPC Control (W
RE
: solid line; W
F
: dotted).
A PROTOTYPE FOR ON-LINE MONITORING AND CONTROL OF ENERGY PERFORMANCE FOR RENEWABLE
ENERGY BUILDINGS
129

5 CONCLUSIONS
This article presents the results of a study dealing
with the improvement of energetic performance of
renewable energy buildings. A performance
indicator (kWh/m
2
/yr) was chosen that allows
comparisons between buildings of different areas
and localizations. A processor-based prototype was
developed, to perform on-line acquisition,
monitoring and control of heat consumption in
renewable energy buildings. The potential for the
fossil energy consumption reduction is illustrated
by the simulation of temperature control of
University’s offices. Mixed online and model-
based predictive control using both external
temperature predictions and real measurements
with time-varying temperature setpoint leads to a
very large fossil energy consumption reduction.
Future work will include the improvement of
the dynamic model, so as to test the developed
control algorithms on larger and more complex
dynamic systems. Furthermore, in-situ application
of the prototype has already begun in our partner’s
headquarters. It is planned to include control
algorithms in addition to real-time data-acquisition
and performance indicator monitoring.
ACKNOWLEDGEMENTS
This work is supported by a fund from the FCE
(Funds for the Competitiveness of the Enterprises,
DERBI cluster). The authors would like to thank
Apex BP Solar, CSTB and Pyrescom for our
collaboration and their involvement in this project.
REFERENCES
ADEME (Agence Départementale de l’Environnement
et de la Maîtrise de l’Energie), 2007. Les chiffres
clés du bâtiment en 2006, Publications de l’ADEME.
Boyde, G., Dutrow, E., Tunnessen, W., 2007. The
evolution of the ENERGY STAR
®
energy
performance indicator for benchmarking industrial
plant manufacturing energy use, J Clean Prod
(2007), doi: 10.1016/j.jclepro., 2007.02.024.
Duffaure-Gallais, I., 2006. La nouvelle réglementation
thermique arrive. Le Moniteur, pages: 16-17.
García, C.E., Prett, D.M., Morari M., 1989: Model
predictive control: Theory and practice - A survey,
Automatica, Vol. 25, n°3, Pages 335-348.
Gungor, M.B., Kyriacou, P.A., Jones, D.P., 1997. A new
micro-controller based wear-time monitor for use
with removable orthodontic appliances. In
Proceedings of the 19th Engineering in Medicine and
Biology society, Vol. 6, pages: 2419 – 2421.
Hensen, J.L.M., 1991. On the thermal interaction of
building structure and heating and ventilation system,
Ph.D. Thesis Technische Univ., Eindhoven
(Netherlands).
Journal Officiel, 2006. Arrêté du 27 juillet 2006 relatif au
contenu et aux conditions d’attribution du label HPE,
République française.
Kalagasidis, A.S., Taesler, R., Andersson C., Nord, M.,
2006: Upgraded weather forecast control of building
heating systems. In Proceedings of the 3rd International
Building Physics Conference, Concordia University,
Montreal, Canada, pages: 951-958.
Kalogirou, S., Bojic, M., 2000. Artificial neural networks
for prediction of the energy consumption of a passive
solar building, Energy, Vol. 25, n°5, Pages 479-491.
Kalogirou, S., Lalot, S., Florides, G., Desmet, B., 2007.
Development of neural network-based fault diagnostic
system for solar thermal applications, Sol. Energy, doi:
10.1016/j.solener.2007.06.010.
Leong, S.S., Vun, C.H., 1998, Design and implementation
of an authentication protocol for home automation
systems, IEEE Transactions on Consumer Electronics,
Vol. 44, n°3, pages: 911-921.
Lygouras, J.N., Botsaris, P.N., Vourvoulakis, J.,
Kodogiannis, V., 2006. Fuzzy logic controller
implementation for a solar air-conditioning system, Ap.
Energy, doi: 10.1016/j.apenergy.2006.10.002.
Maïzi, N., Assoumou, E., 2007. Modélisation prospective et
spécificités de la politique énergétique française,
Journal sur l'enseignement des sciences et technologies
de l'information et des systèmes, vol. 6,
doi :10.1051/J3EA :2007002.
Mendoça, P., Bragança, L., 2003. Energy optimization
through thermal zoning the outer skin, In Proceedings of
the Healthy Buildings 7
th
International Conference,
School of Design and Environment, National Univ. of
Singapore.
Mendoça, P., Bragança, L., 2007. Sustainable housing with
mixedweight strategy - A case of study. Building and
Environment, doi: 10.1016/j.buildenv., 2006.08.025.
Nougier, J.P., 1993. Méthodes de calculs numériques,
Masson.
Sacadura, J.F., 1993. Initiation aux transferts thermiques,
Edition Technique et Documentation.
Segars, S., 1998. The ARM9 family-high performance
microprocessors for embedded applications, In
Proceedings of the International Conference on
Computer Design: VLSI in Computers and Processors,
pages: 230-235.
Sesolis, B, 2006. Amélioration de la performance
énergétique : Une nouvelle réglementation pour tous les
bâtiments neufs, la RT 2005, JMG.
Xingwu, C., Xinhua, J., Lei, W., 2006. Development on
ARM9 System-on-chip Embedded Sensor Node for
Urban Intelligent Transportation System. In
Proceedings of the International Symposium on
Industrial Electronics, IEEE, Vol. 4, Pages: 3270-3275.
ICINCO 2008 - International Conference on Informatics in Control, Automation and Robotics
130
