
A FRAMEWORK FOR 4-D BIOMEDICAL IMAGE PROCESSING,
VISUALIZATION AND ANALYSIS
Matteo Campana, Barbara Rizzi, Camilo Melani
Electronics, Computer Science and Systems Department (DEIS), Bologna University, Bologna, Italy
Paul Bourgine
CREA-Ecole Polytechnique, Paris, France
Nadine Peyri´eras
CNRS-DEPSN, Gif sur Yvette, France
Alessandro Sarti
Electronics, Computer Science and Systems Department (DEIS), Bologna University, Bologna, Italy
Keywords:
Graphical Interface, Image Visualization, Graphics Architecture, Image Processing System, Image Analysis,
Surface Geometry and Shape Extraction.
Abstract:
Today, studies on biological systems are often realized acquiring, processing and analyzing 3D-time lapse
images. Different structures of the organism can be simultaneously observed by acquiring multi-channel image
datasets. In this paper we present a software framework that aims at providing support for managing these
kinds of multidimensional images, designing and validating new image processing algorithms, and analyzing
processed images through different visualization techniques. We present a real scenario where the framework
has been used for the detection and segmentation of biological cell membranes and nuclei imaged from live
zebrafish embryos.
1 INTRODUCTION
Thanks to advanced technologies in imaging, such as
laser scanning microscopy, it is today possible to re-
construct at hight resolution, in time and space, the
development of living organisms. To achieve this goal
a set of strategies, methods, and algorithms have to be
designed to extract useful information from the huge
amount of acquired images. As a final goal of these
studies, it is often expected that a semi-automated re-
construction of the biological structures will emerge
from the highly interactive work of researchers from
different disciplines. This reconstruction will be a
sequential multistep process, composed by different
algorithms designed for processing multidimensional
image dataset.
A software environment is needed to design, test,
and collect algorithms working on 3D-time lapse (4-
D) and multi-channel image datasets and to be able
to detect and reconstruct the spatial and temporal
characteristics of the biological structures. This soft-
ware environment should provide relevant visualiza-
tion tools suitable for the analysis of the acquired and
processed data. The image processing and visualiza-
tion framework should also be freely available and
able to work in different operating systems (Linux,
Windows and OS-X) in order to satisfy all the mem-
bers of an heterogeneous research team. Finally, it
should be able able to operate in a parallel architecture
(cluster) with high computational capacity, so that to
achieve rapidly the complete reconstruction of 4-D
images datasets. A good comparison of four freely
available frameworks for image processing and visu-
alization has been recently done (Bitter et al., 2007).
The analyzed toolkits are SCIRun (Scientific Com-
puting and Imaging Inst. (SCI), 2002), Medical Imag-
ing Interaction Toolkit (MITK) (German Cancer Re-
search Center, 2006), the free version of VolView
403
Campana M., Rizzi B., Melani C., Bourgine P., Peyriéras N. and Sarti A. (2008).
A FRAMEWORK FOR 4-D BIOMEDICAL IMAGE PROCESSING, VISUALIZATION AND ANALYSIS.
In Proceedings of the Third International Conference on Computer Graphics Theory and Applications, pages 403-408
DOI: 10.5220/0001096204030408
Copyright
c
SciTePress

(Kitware Inc., 2006) and MeVisLab (MeVis, 2006).
MITK and MeVisLab are the only two toolkik de-
signed to also allow batch mode execution without a
GUI to executeon a cluster. None of them can be used
in the scenario we described; MITK is not able to op-
erate on OS-X operating system and the free version
of MeVisLab has some limitations on the number of
custom coded modules. Moreover these toolkits are
not specified designed to work on multi-channel 4-D
images.
In this paper we present a framework that aims
at providing support for designing and testing new
image processing algorithms dedicated to the pattern
recognition and shape reconstruction, able to work
on multi-channel 4-D images and providing some vi-
sualization tools suitable for the analysis of the ac-
quired and processed data. Although it can provide
support for visualizing and processing different types
of multi-channel 4-D images, in this paper we will
describe the framework referring to a specific biolog-
ical case study. The framework has been used to im-
plement algorithms able to reconstruct the Zebrafish
embryogenesis at the cellular organization level from
high resolution multi-channel 4-D images (Megason
and Fraser, 2003). Through these algorithms impor-
tant data can be extracted such as the variation of the
cell population and the membranes and nuclei shape.
These kind of data is highly relevant for further un-
derstanding biological processes at the cellular level.
In Section 2 we briefly explain how the 4-D
imaging of the zebrafish embryonic development is
achieved and what are the main steps of images re-
construction. In Section 3 we illustrate the frame-
work architecture and its main components. In the
same section we illustrate some possible application
scenarios. In Section 4 we describe a real scenario
where the system has been used for designing, test-
ing, and computing an algorithm for the segmentation
of cell nuclei and membranes from a multi-channel
4-D image dataset.
2 4-D IMAGING AND IMAGE
PROCESSING STRATEGIES
High resolution time-lapse microscopy imaging of
living organisms is best achieved by multiphoton laser
microscopy (MLSM) (Gratton et al., 2001). It allows
imaging the zebrafish embryo, engineered to high-
light with two distinct fluorescent proteins all nuclei
and cell membranes, during early embryonic stages.
Optical sections of the organism are obtained by de-
tecting the fluorescent radiation coming from the laser
excited focal plane. The 3-D spatial sampling of the
embryo is achieved by changing the focal plane depth.
Repeating the acquisition at time intervals throughout
the embryo development, it produces a 4-D dataset
composed of a series of 3-D images. Separate chan-
nels of 4-D images are acquired for nuclei and mem-
branes. Every 3-D image produced is described by a
structured grid geometry composed of 512 pixels in X
and Y direction and 30 in Z. The spatial resolution is
0.584793 µm in X, Y and 1.04892 µm in Z. The time
required to capture one 3-D image is about 5 minutes.
The embryo has been imaged from 3.5 hours post fer-
tilization (developmentat 28
o
C) for 4 hours (25
o
C un-
der the microscope) (Kimmel et al., 1995). The two-
channel 4-D dataset of nuclei and membranes has a
total memory storage occupation of 755 MB.
The images captured by microscopy need to be
processed so that to reconstruct the cells shape and
movements. This should be achieved through an au-
tomated or semi-automated procedure consisting of
a number of sequential steps. First the images are
processed by filtering, cells detection, and segmenta-
tion algorithms. The goal of filtering algorithms is to
decrease the noise of the acquired images. The cells
detection step aims at finding the spatial coordinates
of the cells center. The segmentation goal is to extract
the boundaries of nuclei and membranes. At the end
of the images treatment, a tracking algorithm will be
applied on processed images to achieve the tracking
of cells division, cells death, cells displacement in the
whole organism through time and space.
3 THE FRAMEWORK
In order to support the image processing strategies,
the design of a software environment is needed to 1)
manage the two-channel 4-D biological images 2) de-
velop and validate new algorithms for cells detection
and segmentation 3) process images with different
algorithms, and 4) analyze results produced in each
step by different visualization techniques. The sys-
tem should also be able to operate in a parallel ar-
chitecture (cluster) with high computational capacity,
so that to achieve rapidly the complete reconstruction
of the whole dataset. In this section we describe the
architecture and the functionalities of the framework
that we developed.
3.1 Architecture
The system comprises three main components: The
“Visualization”, “Script”, and “ImageProcessing”
components. The “ImageProcessing” component en-
capsulates the capacity to process the images. The
GRAPP 2008 - International Conference on Computer Graphics Theory and Applications
404
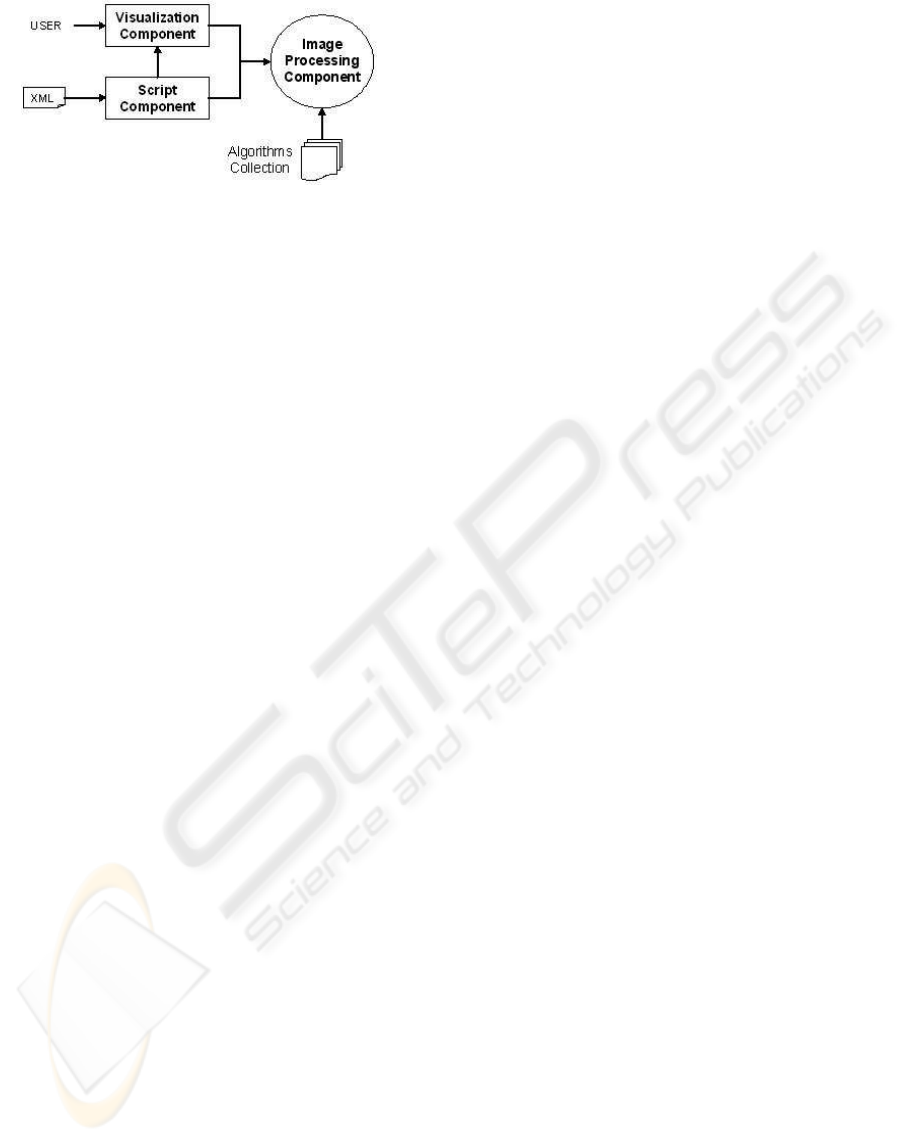
Figure 1: Graphic representation of the Framework archi-
tecture. Here, the main components are illustrated : Visu-
alizationComponent, ScriptComponent and ImageProcess-
ingComponent. If the VisualizationComponent is used in
the framework, the user can control the image process-
ing through a GUI. Otherwise a ScriptComponent can be
used, to control the visualization tool and the processing
of images in batch mode, with an XML script file. The
ScriptComponent allows, without a GUI, to execute in batch
mode the image parallel processing on a cluster architec-
ture.
image treatment can be obtained by a multistep pro-
cedure that in our scenario performs filtering, cells de-
tection, and segmentation. For each step it is possible
to choose one of the algorithms developed by users
and archived in the “Algorithms Collection”. The
ImageProcessing component can be graphically con-
trolled by the user through the “Visualization” com-
ponent. It encapsulates the graphic user interface for
setting up the images treatment, and different visual-
ization tools that can be used to examine the 4-D im-
ages. The image processing and visualization can also
be controlled by the “Script” component; this compo-
nent is used to manage the framework in batch mode,
through a script defined with the extensible markup
language (XML) schema. As we will describe in Sec-
tion 3.3 and Section 3.4 the choice of which compo-
nent will control the image processing, depends on
the scenario that the user is working on.
The system has been written in C++ language.
The “Insight Segmentation and Registration Toolkit”
(ITK) and the “Visualization Toolkit” (VTK) libraries
have been used for implementing the image process-
ing and visualization features. ITK (National Library
of Medicine, ) is a software system for image process-
ing, segmentation, and registration. VTK (Schroeder
et al., 1998) provides libraries to enable scientific vi-
sualization. Both are object-oriented, cross-platform,
free and open-source software.
The framework architecture is based on the
component-oriented paradigm; the components inter-
act with each others by a support that we call “Glue-
Support”. It has been designed with the goal of op-
timizing the exchange of big images between com-
ponents, even if they reside in a distributed environ-
ment. In order to realize these “remote” communica-
tions we used the MPI functionality provided by the
VTK toolkit.
3.2 Designing New Algorithms
To realize a complete image treatment procedure, in
our scenario, the framework will sequentially execute
the filtering, cells detection, and segmentation steps.
To design a new algorithm the user will only write
a function called “Execute” specifying how to trans-
form the input image; this function will be executed
by the infrastructure when all the previous steps are
completed.
void TestFilteringModule::Execute(){
inputValue= GetInputPixel(x,y,z);
<Algorithm routine>
SetOutputPixel(x,y,z, outputValue);
}
As we can see in the example above, some vari-
ables and functions have been implemented to help
the user getting the image produced by the previous
step, transform it by a routine, and pass it to the next
step. The user gets and sets the input and output im-
age pixel values by two predefined functions called
“GetInputPixel” and “SetOutputPixel”. Some prede-
fined variables can also be used inside the Execute
method to get some property like Size, Spacing, and
Origin of the image produced by the previous step.
One goal of the framework is to offer a support to
create algorithms able to process 4-D datasets. The
idea is to predefine some functions that the user will
use to move along the time dimension, providing in
this way the access to pixel values of the 4-D dataset.
As we described in Section 2 the images are stored as
a temporal sequence of 3-D images. Let us assume
that we are filtering the images at time point 5 and
that the filtering algorithms compute the pixel values
taking into account the values of images in the previ-
ous and next time points (time 4 and 6). To do that
the user can use the functions “NextTime” and “Pre-
viousTime” to load the images he is interested in and
then accessing to the pixel values. The infrastructure
will manage the access to the file-system hiding to the
user the complexity of the dataset file-names format.
In this way the algorithms routines are “general” and
can be applied to different 4-D datasets. The user can
also call the functions “Channel(0)” or “Channel(1)”
to respectively load the membranes or nuclei channel.
ITK toolkit provides several algorithms (called
filters) and useful functionalities to process images.
Sometime the user may need to integrate his code
with some ITK filters. For this reason the framework
provides some utilities to easily connect ITK filters
with the user C++ routines. In this way it is also pos-
sible to take advantage of the ITK algorithms by cre-
A FRAMEWORK FOR 4-D BIOMEDICAL IMAGE PROCESSING, VISUALIZATION AND ANALYSIS
405
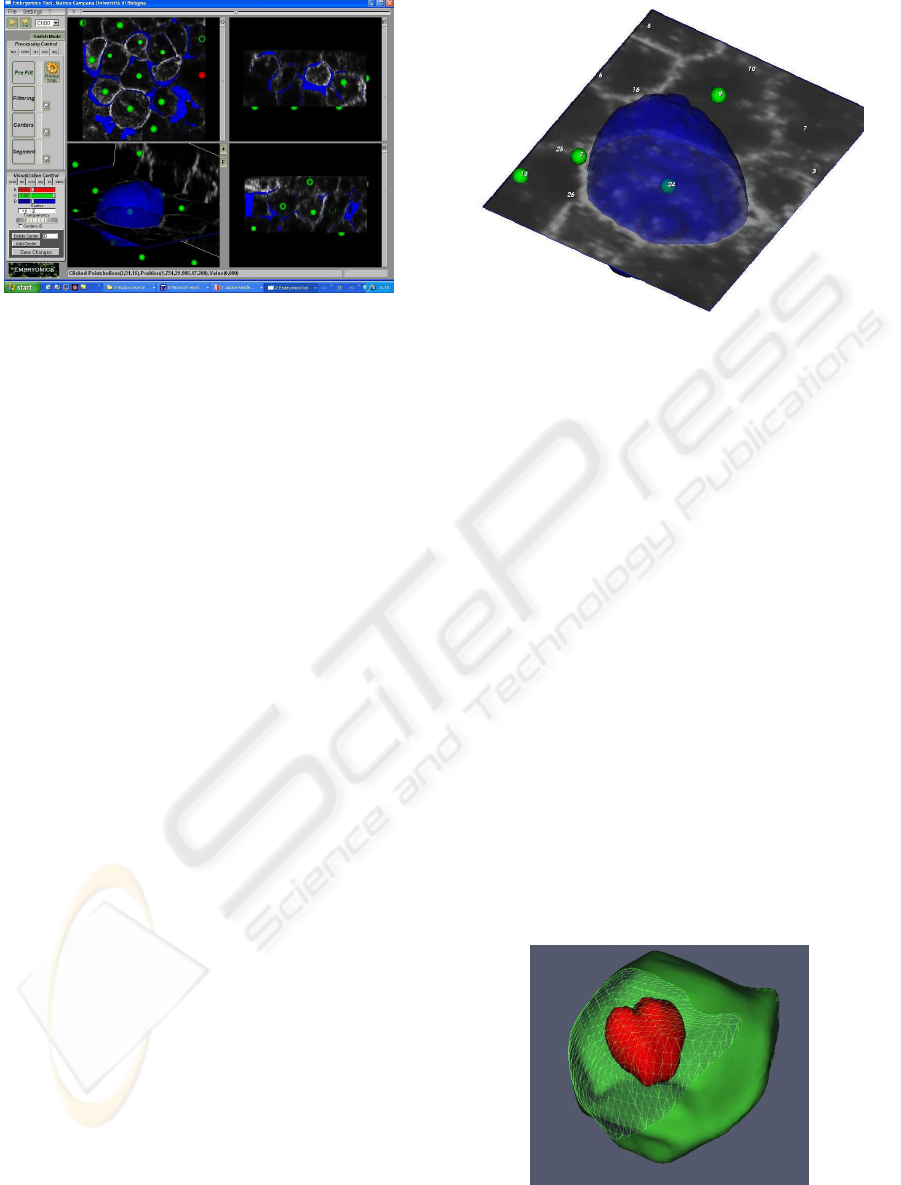
Figure 2: The Visualization component interface. By the
graphic user interface on the left side, the user can select
the algorithms workfl ow to be used for the image treatment.
On the right side the 2-D and 3-D view.
ating hybrid algorithms composed of both ITK filters
and C++ routines.
3.3 Visual Inspection
Suppose that a user, after designing a new algorithm,
has to validate it working on a local machine, with a
small subset of the images. He would need to have
a graphical interface to quickly select the algorithms
and the parameters for each step of the image treat-
ment. He would also probably like to visualize and
analyze the processed images. To achieve these tasks,
the framework provides the “Visualization” compo-
nent providing the interface illustrated in Fig. 2.
Through this interface the user can load a single 3-
D image or open a complete two-channel 4-D dataset.
Once the 4-D series is loaded, it is possible to choose
the channel to be visualized (membranes or nuclei) or
move through the time dimension dragging the time
line control on top of the graphic interface. To achieve
these functionalities the framework keeps in memory
a list of filenames that composes the 4-D series; for
any user request (change time or channel) it will load
the corresponding file. In this way it is possible to
work with the complete time series avoiding to load
all the images, reducing the memory consumption.
The workflow of the image processing can be con-
trolled by the “Processing Control” panel situated on
the left side of the graphic user interface. With this
panel, it is possible to select the algorithms and pa-
rameters to use for each step of the image treatment.
Once the algorithms have been selected, it is possible
to launch the image processing.
The images produced by filtering, cells detection,
and segmentation algorithms will be visualized alto-
gether in the 4 views of the interface; three of them
Figure 3: In figure the membranes image is analyzed by
a cutting plane. The plane can be moved around the 3-D
space. The center of cell number 24 is represented by the
green sphere, and its membrane boundary is displayed as a
blue surface.
show the images through bi-dimensional representa-
tions with different points of view; one offers a tri-
dimensional representation of the images through dif-
ferent visualization techniques. The images are super-
imposed with the original non-processed image (raw
data) so that to easily compare and analyze the re-
sults obtained through the image treatment, as shown
in Fig. 3. The filtered images can be visualized
with three different kinds of visualization techniques:
“Cutting Planes”, “IsoSurface”, and “Volume Render-
ing” (Schroeder et al., 1998). A visualization tech-
nique is a method to create or manage a graphic rep-
resentation from data; in that case the methods used to
represent the filtered data allow to analyze the inter-
nal parts of the 3-D filtered volumes. The positions of
the cells detected inside each volume are represented
by small spheres. Near each sphere it is also possi-
ble to visualize the number that identifies the cell. By
the graphic user interface it is also possible to delete
Figure 4: Reconstructed boundaries of a cell; in red the nu-
cleus and in green the membrane. The section of the mem-
brane shows how the surfaces are represented with polygo-
nal mesh.
GRAPP 2008 - International Conference on Computer Graphics Theory and Applications
406
and insert new cells centers. The segmented im-
ages are described by surfaces represented through a
VTK PolyData format (Schroeder et al., 1998). Each
closed surface identifies a nucleus or a membrane in-
side the image and they are described with triangles-
polygonal mesh (Fig. 4). Through the interface, the
user can select one cell, change its colour and opac-
ity, and validate the reconstruction process superim-
posing the surfaces with the raw images.
The three-dimensional view can also work in a
“stereo” visualization mode. This technique, inspired
by the human visual system, improves the depth per-
ception of the visualized objects. Switching the visu-
alization to stereo mode and using some stereo de-
vices, like shutter glasses, it is possible to use the
framework for an immersive visualization.
3.4 Process the Complete 4-D Dataset
Suppose now that the user needs to process a com-
plete 4-D dataset. At this point he probably knows
which algorithm to use and what are the best parame-
ters values; he also probably would need to quickly
process all the images taking advantage of clusters.
In this scenario there is no need to graphically con-
trol the image processing; we simply need to describe
the treatment by an easy and flexible schema. To do
that, we can use an XML script containing the al-
gorithms and parameters to be used; The following
XML schema illustrates a script that defines algorithm
and parameters to be used for image filtering:
<Command cmd="SetFilteringType">
<Parameter type="CurvatureFlow" />
</Command>
<Command cmd="SetFilteringParameters">
<Parameter iterations="3" />
<Parameter timestep="0.061" />
</Command>
In order to realize this scenario we implemented a
component called “Script” able to parsing an XML
file created by the user, and execute the commands.
By a script file it is possible to realize most of the
operations that the user can do by the graphic user
interface introduced in previous section, such as load-
ing 4-D dataset, moving in time, selecting algorithms,
and launch the image processing.
4 A REAL APPLICATION
SCENARIO
In this section we shortly describe how the framework
has been used for a segmentation algorithm, from its
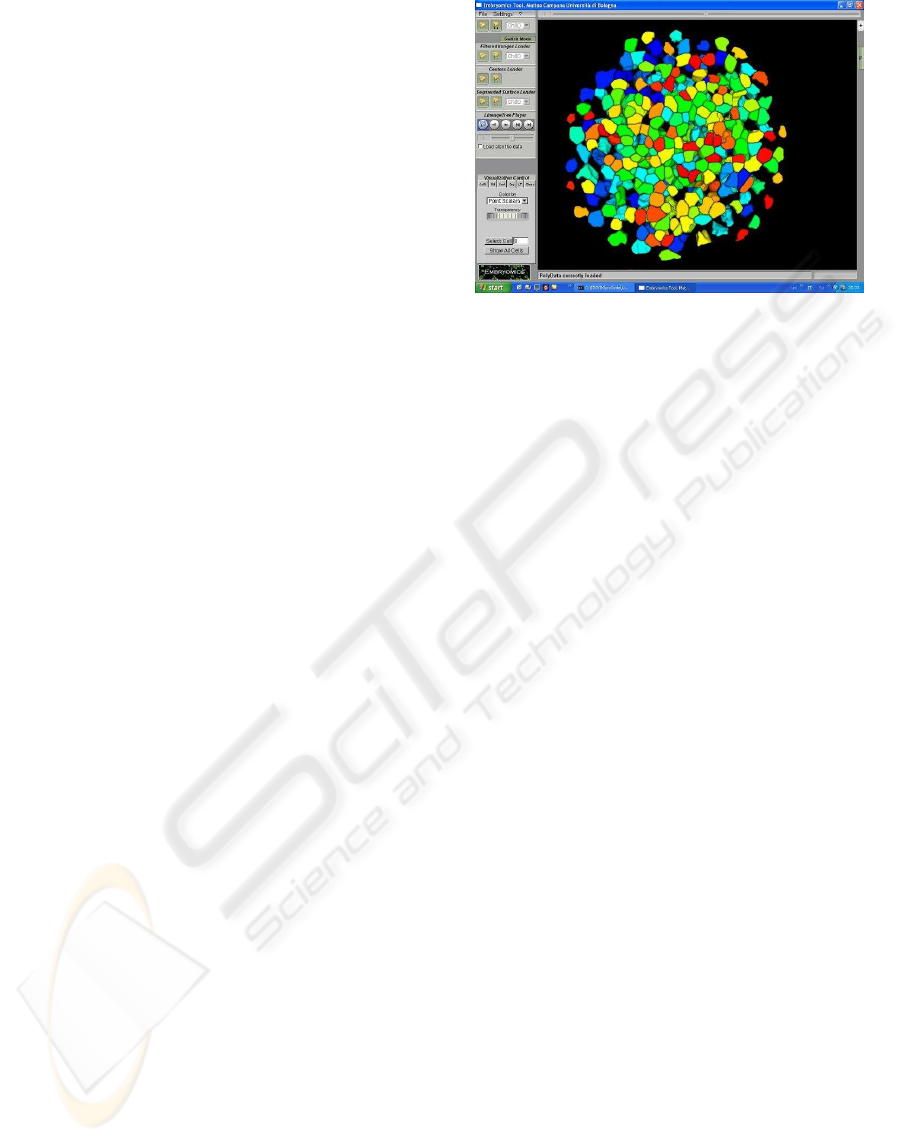
Figure 5: The Membranes surfaces segmented by Subjec-
tive Surfaces algorithm and visualized by the framework
graphic user interface.
design to the complete 4-D embryo dataset segmen-
tation. The designed segmentation algorithm is based
on “Subjective Surfaces” model (Sarti et al., 2002),
(Campana et al., 2007); it implements a method that
can be used to extract cell surfaces from images with
missing boundaries. The algorithm has been imple-
mented inside the framework and it uses some of the
functionalities described in Section 3.2 such as mov-
ing across channel (membrane and nuclei) and con-
necting ITK filter with C++ routines. Once designed,
the algorithm has been tested by processing a small
subset of the complete 4-D dataset. In order to extract
the cell surfaces, some other algorithms integrated in
the framework have been used to filter the images and
to detect the cells centers. The images have been first
denoised by the Geodesic Curvature filtering (Sarti
et al., 2000), (Rizzi et al., 2007). The cells have been
then detected by an algorithm (Melani et al., 2007)
based on Hough Transform (Duda and Hart, 1972);
it allows to detect the cells position recognizing the
ellipsoidal shape of nuclei. The surfaces obtained
by the segmentation algorithm have been finally an-
alyzed through the visualization techniques provided
by the graphic user interface. For example in Fig. 3,
the extracted surfaces have been superimposed to the
raw images.
The “Subjective Surfaces” algorithm has been
used to segment the image dataset encompassing
the Zebrafish embryo throughout early developmen-
tal stages. The time required to totally segment the
images strictly depends on the number of cells de-
tected inside the images; in our scenario the number
of cells detected at each time step is high and it in-
creases throughout the embryo development. To seg-
ment fast enough membranes and nuclei we need high
computational capacity, such as the one provided by
clusters of computers. For this reason the framework
A FRAMEWORK FOR 4-D BIOMEDICAL IMAGE PROCESSING, VISUALIZATION AND ANALYSIS
407

has been installed in a Linux cluster. The “Subjec-
tive Surfaces” algorithm has been parallelized in or-
der to simultaneously segment a number of cells. The
segmentation has been finally managed and launched
by the “Script” component; meaning that all the algo-
rithms and parameters to be used have been specified
by an XML script file. The Fig. 5 shows the surfaces
of membranes extracted from the embryo 4-D dataset
and visualized by the framework graphic user inter-
face.
5 CONCLUSIONS AND FUTURE
WORKS
In this paper we presented a framework designed for
the analysis of multi-channel 4-D image datasets and
for supporting the implementation and test of new im-
age processing algorithms. We discussed its architec-
ture describing the different components and we illus-
trated some possible scenario of use. We finally de-
scribed a real scenario where the framework has been
used to design, test and apply to biological images an
algorithm for the segmentation of cells.
The framework actually can work only on two-
channel 4-D dataset; we will improve the toolkit with
the goal to extend the image processing on n-channel
4-D dataset. Another improvement of the system is
needed in order to simplify the insertion of new rou-
tines in the algorithm collection; a plug-in “updating
procedure” may will be adopted for this.
In the next future, we will focus on the analysis of
the data produced by the tracking of nuclei. This final
step will produce the cell lineage tree that describes
division, death and movements of cells in time and
space.
ACKNOWLEDGEMENTS
We thank all the members of the Embryomics and
BioEmergences projects for our very fruitful interdis-
ciplinary interaction.
REFERENCES
Bitter, I., Uitert, R. V., Wolf, I., Ibez, L., and Kuhnigk, J.-
M. (2007). Comparison of four freely available frame-
works for image processing and visualization that use
itk. IEEE Transactions on Visualization and Com-
puter Graphics, 13(3):483–493.
Campana, M., Zanella, C., Rizzi, B., Bourgine, P., Peyri-
ras, N., and Sarti, A. (2007). A subjective surfaces
based segmentation for the reconstruction of biolog-
ical cell shape. In VISAPP 08-International Confer-
ence on Computer Vision Theory and Applications.
Duda, R. and Hart, P. (1972). Use of the hough transforma-
tion to detect lines and curves in pictures. Communi-
cations of the ACM, 15(1):11–15.
German Cancer Research Center (2006). Mitk: The medical
interaction toolkit.
Gratton, E., Barry, N. P., Beretta, S., and Celli, A.
(2001). Multiphoton fluorescence microscopy. Meth-
ods, 25(1):103–110.
Kimmel, C. B., Ballard, W. W., Kimmel, S. R., Ullmann,
B., and Schilling, T. F. (1995). Stages of embryonic
development of the zebrafish. Dev. Dyn., 203:253–
310.
Kitware Inc. (2006). Volview: A volume visualization sys-
tem.
Megason, S. and Fraser, S. (2003). Digitizing life at the
level of the cell: high-performance laser-scanning mi-
croscopy and image analysis for in toto imaging of
development. Mech. Dev., 120:1407–1420.
Melani, C., Campana, M., Lombardot, B., Rizzi, B.,
Veronesi, F., Zanella, C., Bourgine, P., Mikula, K.,
Pe-yrieras, N., and Sarti, A. (2007). Cells tracking in
a live zebrafish embryo. In Proceedings 29th Annual
International Conference of the IEEE EMBS, pages
1631–1634.
MeVis (2006). Mevislab: A development environment for
medical image processing and visualization.
National Library of Medicine. Insight segmentation and
registration toolkit (itk).
Rizzi, B., Campana, M., Zanella, C., Melani, C., Cunderlik,
R., Kriv, Z., Bourgine, P., Mikula, K., Pe-yrieras, N.,
and Sarti, A. (2007). 3d zebra fish embryo images
filtering by nonlinear partial differential equations. In
Proceedings 29th Annual International Conference of
the IEEE EMBS.
Sarti, A., de Solorzano, C. O., Lockett, S., and Malladi,
R. (2000). A geometric model for 3-d confocal image
analysis. IEEE Transactions on Biomedical Engineer-
ing, 47(12):1600–1609.
Sarti, A., Malladi, R., and Sethian, J. A. (2002). Subjec-
tive surfaces: A geometric model for boundary com-
pletion. International Journal of Computer Vision,
46(3):201–221.
Schroeder, W., Martin, K., and Lorensen, B. (1998). The Vi-
sualization Toolkit. Prentice Hall, Upper Saddle River
NJ, 2nd edition.
Scientific Computing and Imaging Inst. (SCI) (2002). A
scientific computing problem solving environment-
scirun.
GRAPP 2008 - International Conference on Computer Graphics Theory and Applications
408
