SURFACE DEFECTS DETECTION ON ROLLED STEEL STRIPS
BY GABOR FILTERS
Roberto Medina, Fernando Gayubo, Luis M. González, David Olmedo
CARTIF Foundation, Boecillo (Valladolid, Spain
Jaime Gómez, Eduardo Zalama, José R. Perán
ETSII, University of Valladolid, Valladolid, Spain
Keywords: Machine vision, surface inspection, defect detection, thresholding, Gabor filters.
Abstract: Product material integrity and surface appearance, in steel flat products manufacturing and processing, are
important attributes that will affect product operation, reliability and customer confidence. Automated
visual inspection has to be envisaged, but five major problems have to be overcome: (i) The variable nature
of the defects, (ii) The high reflective nature of the metallic surfaces, (iii) The oil presence, (iv) The huge
amount of visual data to be acquired and processed, and (v) The high speed in the section where inspections
are performed. We have developed an automated cellular visual inspection system of flat products in a flat
steel cutting factory. Among the approaches that the system uses to detect defects, we have included the
two-dimensional Gabor filters. In this paper a detection procedure of defects in flat steel products based on
Gabor filters is presented. The traditional methods based on the study of the grey-level histogram and shape
analysis, have shown quite good results, but there are not good enough to achieve the level of success
required. Experimental results show that a greater number of defects can be readily detected using the
proposed approach.
1 INTRODUCTION
The steel coils produced by the iron and steel
industry are rarely directly usable by the end users.
Therefore, they must be reprocessed in cutting lines
or processes to more manageable products with
dimensions and features that the customer desires,
but always with the highest quality.
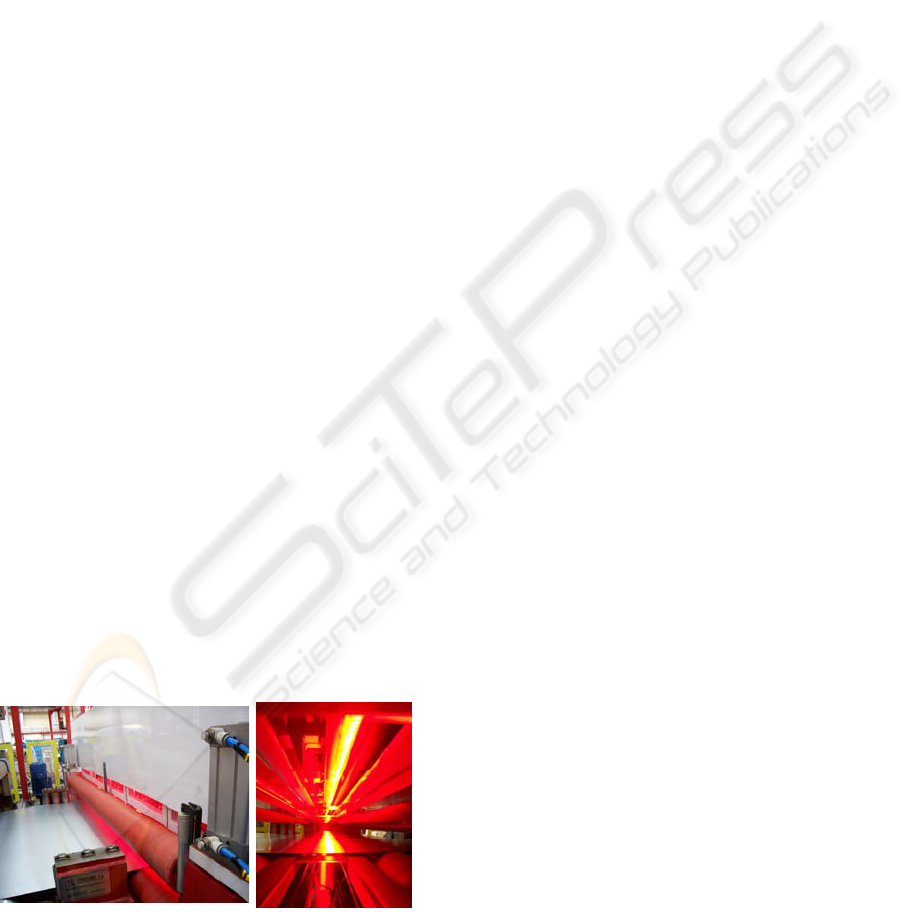
Figure 1: Automatic surface defect visual inspection
system developed by CARTIF Foundation for
GONVARRI Industrial (Spain).
Automated visual inspection is the obvious
alternative to the human inspector (Gayubo et al.,
2006a; Gayubo et al, 2006b). An automatic surface
inspection system provides the following advantages
(Obeso et al., 1997):
Uniform quality control.
Programmable quality control oriented to
different acceptance levels for different
standards.
Possibility of assigning different quality
products to different customers, based on their
requirements.
We have developed an automated cellular visual
inspection system of flat products in a flat steel
cutting factory (Figures 1 and 2). Among the
approaches that the system uses to detect defects, we
have included the two-dimensional Gabor filters. In
this work a detection procedure of defects in flat
steel products based on Gabor filters is presented.
479
Medina R., Gayubo F., González L., Olmedo D., Gómez J., Zalama E. and Péran J. (2008).
SURFACE DEFECTS DETECTION ON ROLLED STEEL STRIPS BY GABOR FILTERS.
In Proceedings of the Third International Conference on Computer Vision Theory and Applications, pages 479-485
DOI: 10.5220/0001088504790485
Copyright
c
SciTePress
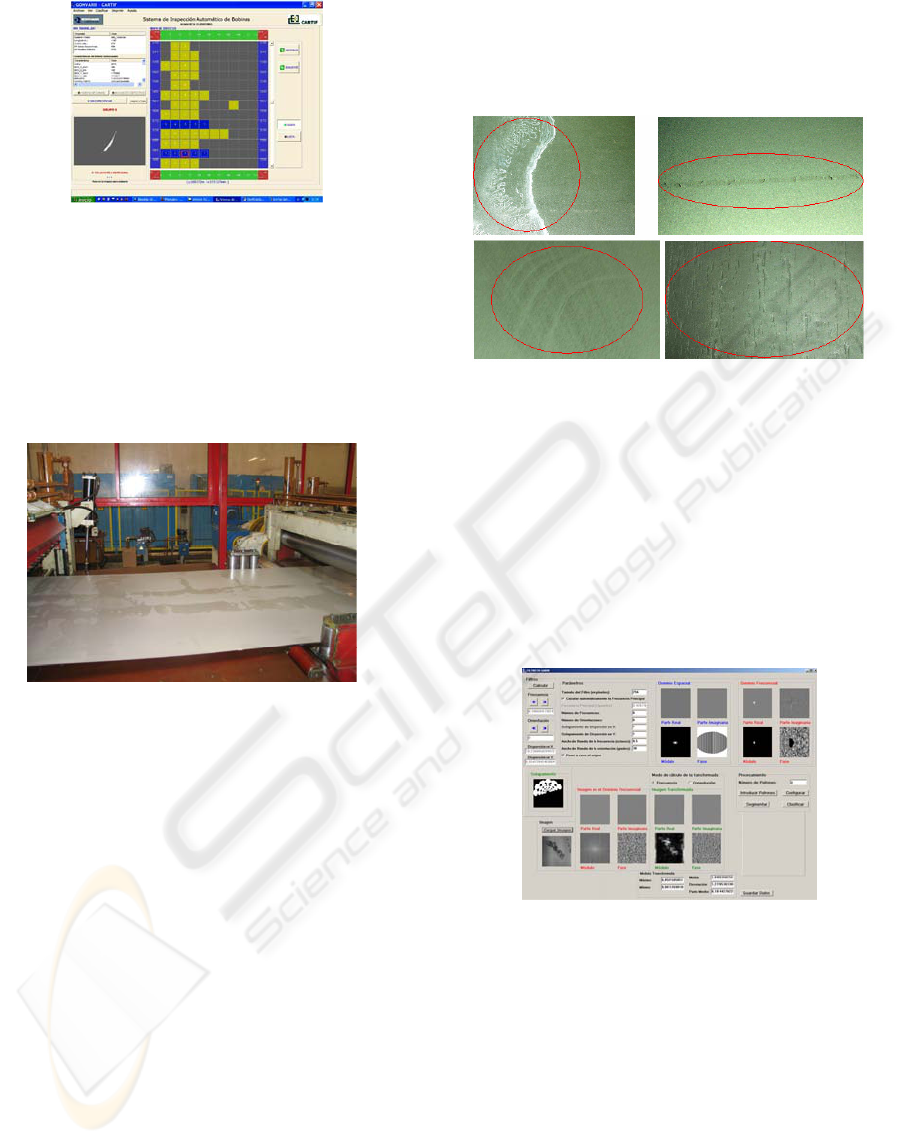
Figure 2: User interface.
Automated visual inspection has to be envisaged,
but five major problems have to be overcome: (i)
The variable nature of the defects, (ii) The high
reflective nature of the metallic surfaces, (iii) The oil
presence, (iv) The huge amount of visual data to be
acquired and processed, and (v) The high speed in
the section where inspections are performed (Fig. 3).
Figure 3: Coil slitting line (images courtesy of
GONVARRI Group).
The practice of detecting, analysing and
classifying abnormal structures in a surface is called
surface inspection (Chin, 1992). Deviations form the
surrounding surface can be either design elements
that must have been adequately fabricated or
fabrications faults that ought not have been present.
It is clear the immediate detection of surface defects
is important.
The number of surface defect types is large. Also
the naming of similar defect may differ from plant to
plant. Figure 4 shows examples of defect images.
One of the main problems of this application is
the huge amount of visual data to be acquired and
processed. The development of electronics and
information technology have made the actual image
applications possible. However the on-line
inspection is not an easy task due to the subtle
characteristics of the defects, high reflective nature
of the metallic surfaces, and the oil presence.
A surface of flat steel products may be defined in
terms of shape and reflectance, a defect may be
described as a local aberration in shape and/or
reflectance. The key is the ability to determine a
deviation in the expected shape and reflectance of
the surface.
Figure 4: Surface defects. Pattern-type and roughness-type
surface defects (rust, coat-less...).
Among the approaches that the system uses to
detect defects, we have included the two-
dimensional Gabor filters (Fig. 5). A two-
dimensional Gabor filter consists of a sinusoidal
wave modulated by a gaussian envelope. It performs
a localized and oriented frequency analysis of a two-
dimensional signal (Kamarainen, 2003).
Experimental results show that a number of defects
can be readily detected using the proposed approach.
Figure 5: 2D-Gabor filters interface.
2 DEFECT DETECTION
2.1 Introduction
Many methods have been proposed to extract
features either directly from the spatial domain or
from the spatial-frequency domain. In the spatial
domain, the more simple features are first-order
statistics such as mean, variance, skewness and
kurtosis from the grey-level histogram (Fig. 6) of an
image (Ramana and Ramamoorthy, 1996).
VISAPP 2008 - International Conference on Computer Vision Theory and Applications
480
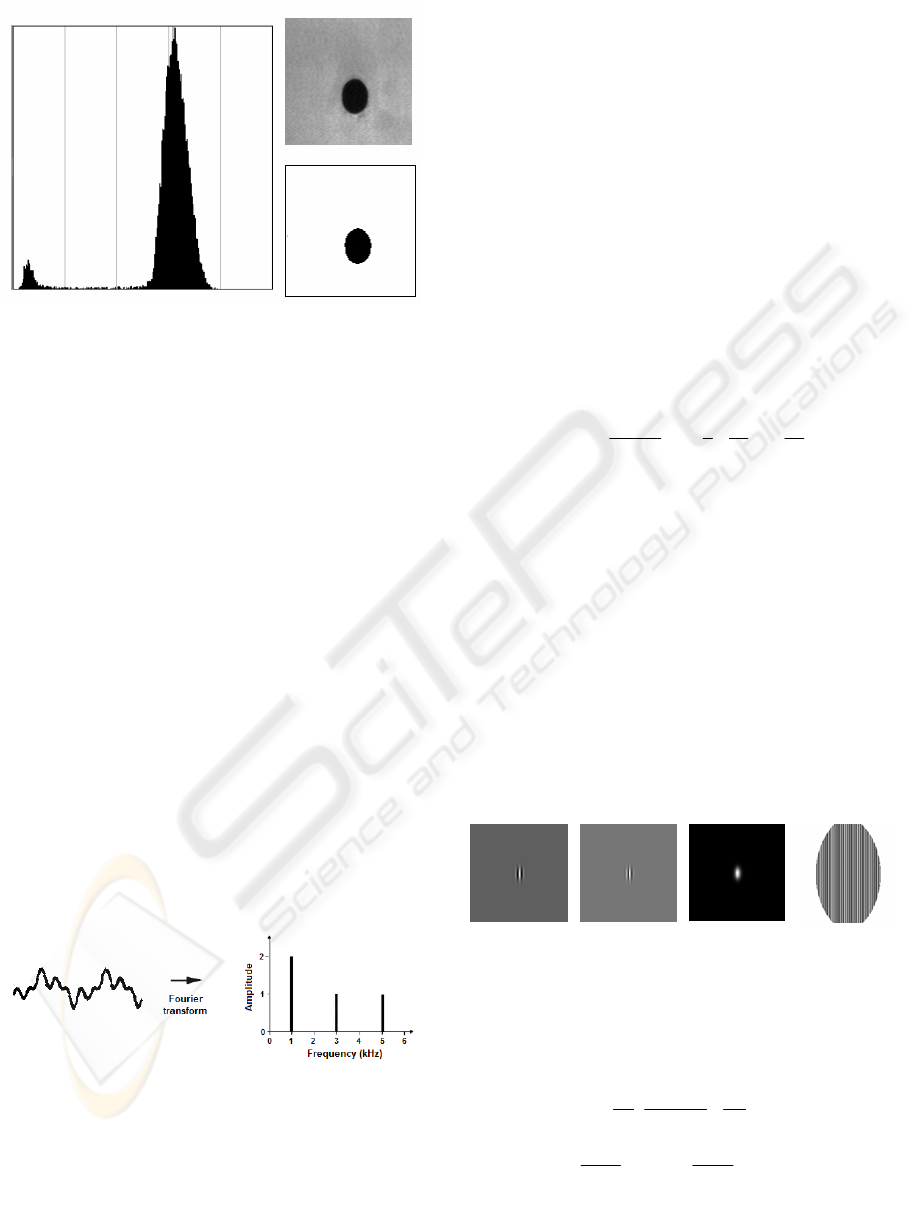
Figure 6: Thresholding.
Thresholding is a very fast and simple method,
but there are two major problems. First, it is often
difficult to determine, automatically or even
manually, the optimal threshold. Second, only in
very simple images can a threshold segment all
objects correctly. To perform local thresholding, an
approach is to divide the image into square sub-
regions and calculate the threshold independently for
each one. However, there may be some
discontinuities between edges of different regions.
To determinate the threshold there are two methods:
consider it equal to the mean minus three standard
deviations or choose the threshold according to the
valley points and inflexion points of the histogram
(Sahoo et al., 1988).
Many work suggested that it may be possible to
find better features, which are less sensitive to noise
and intensity variation, in the spatial-frequency
domain than those features extracted from the spatial
domain (Wechsler, 1980). Measures of the shape of
the spatial frequency spectrum such as location, size,
and orientation of peaks in regions of spatial
frequency using the 2D Fourier transform can be
used to design the textural features.
Figure 7: Fourier transform of a signal.
The Fourier methods characterise the spatial-
frequency distribution, but they do not consider the
information in the spatial domain. In the recent past,
Gabor filters have been well recognised as a joint
spatial/spatial-frequency representation for analysing
images containing highly specific frequency and
orientation characteristics. Daugman (Daugman,
2002) showed that Gabor filters have optimal joint
localisation in both the spatial and the spatial-
frequency domains. In addition, they are bandpass
filters, which are inspired by a multichannel filtering
theory for processing visual information in the early
stages of the human visual system (Beck et al.,
1986).
2.2 2D Gabor Filters Bank
A two-dimensional Gabor filter consists of a
sinusoidal wave modulated by a gaussian envelope.
It performs a localized and oriented frequency
analysis of a two-dimensional signal. The
formulation in the spatial domain is the following:
[
]
θθθθ
σσσπσ
π
σ
σϑσ
cossinsincos
2
1
exp
2
1
),(
2exp),(),(
2
2
,,
yxyyxxwith
yx
yxgwhere
xFjyxgyxG
yxyx
F
+−=
′
+=
′
⎥
⎥
⎦
⎤
⎢
⎢
⎣
⎡
⎟
⎟
⎟
⎠
⎞
⎜
⎜
⎜
⎝
⎛
⎟
⎟
⎠
⎞
⎜
⎜
⎝
⎛
′
+
⎟
⎟
⎠
⎞
⎜
⎜
⎝
⎛
′
−=
′
⋅
=
(1)
where F is the central frequency of the filter, θ is the
angle between the direction of the sinusoidal wave
and the x axis of the spatial domain, σ
x
and σ
y
the
standard deviations of the gaussian envelope
respectively in the direction of the wave and
orthogonal to it. These last two parameters
(sometimes referred to as the smoothing parameters)
represent the shape factor of the gaussian surface:
they determine the greater or less selectivity of the
filter in the spatial domain (Fig. 8). In the
above
formulation it is assumed that the angle between the
wave direction and the axis of the gaussian envelope
is zero
Figure 8: Real part, imaginary part, magnitude and phase
of Gabor filter in the spatial domain. F=0.09375; θ=0º;
σx=6; σy=10.
In frequency domain the Gabor filter can be written
as follows (Fig. 9):
()
θθθθ
πσ
σ
πσ
σ
σσ
θσ
cossinsincos
2
1
,
2
1
2
1
exp),(
2
2
2
2
,,
vuvyvuuwith
where
vFu
vuG
y
v
x
u
vu
F
+−=
′
+=
′
==
⎥
⎥
⎦
⎤
⎢
⎢
⎣
⎡
⎟
⎟
⎠
⎞
⎜
⎜
⎝
⎛
′
+
−
′
−
=
(2)
SURFACE DEFECTS DETECTION ON ROLLED STEEL STRIPS BY GABOR FILTERS
481
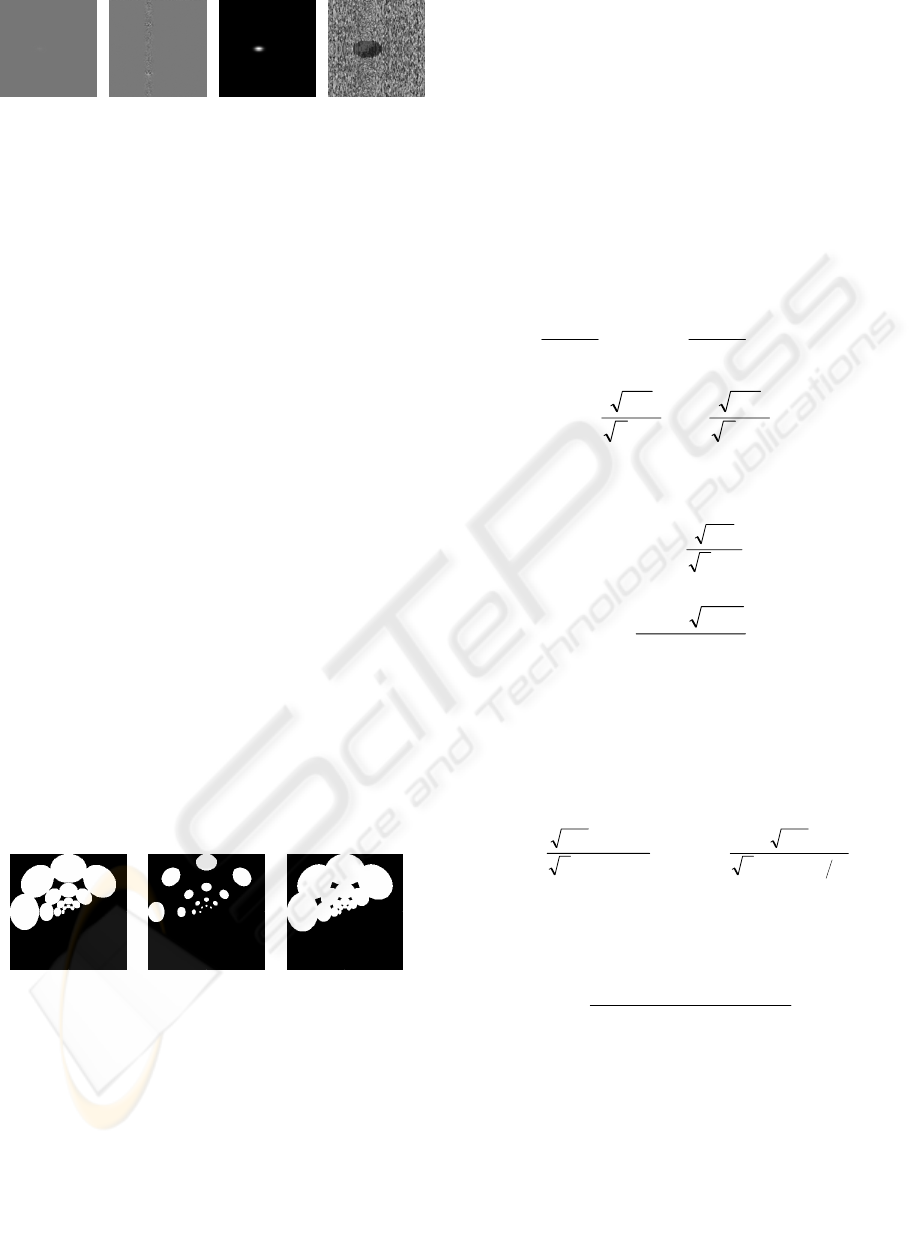
Figure 9: Real part, imaginary part, magnitude and phase
of Gabor filter in the frequency domain. F=0.09375; θ=0º;
σ
x
=6; σ
y
=10.
Gabor filters seem to have important relations
with the vision system of mammals. It has been
shown that the response of cortical simple cells
devoted to the processing of visual signal can be
approximated with Gabor functions (Daugman,
1985).
A defect detection procedure based on Gabor filters
is usually carried out through the following steps:
1. design of a filter bank with filters at different
frequencies and orientations;
2. computation of the transformed images;
3. extraction of a set of synthetic parameters
(features) from the transformed images
(definition of the feature space);
4. definition of a proper distance in the feature
space;
5. detection through a suitable pattern detection
algorithm.
The design of the filter bank consists in the
selection of a proper set of values for the filter
parameters: F, θ, σx and σy. The possible
combinations of the various parameters determine
how the filter bank analyses the spatial and
frequency domain. In frequency domain it is
common practice to display the zones covered by the
various filters by plotting the half-peak magnitude
iso-curves, as shown in the figure 10.
Figure 10: Half-peak iso-curve of the filter.
The design of a proper Gabor filter bank is a key
aspect of the problem, and it is also controversial.
Various authors proposed different values of the
parameters, based on mathematical and
physiological considerations. In order to simplify the
selection the Gabor filter bank, we made the
following assumptions: uniform separation in
orientation; constant ratio between the central
frequency of two adjacent filters:
•
the central frequency of the filter at the highest
frequency F
M
•
the total number of frequencies n
F
•
the total number of orientations n
O
•
the ratio between the central frequencies of two
adjacent filters k
F
• the value of the parameters σ
x
and σ
y
.
In general the highest central frequency of the
filter at the highest frequency is chosen such as that
the half-peak iso-curve of the filter reaches the value
of 0.5, which represents the Nyquist frequency.
Setting G(u,v) = 1/2 in (2), it gives the equation of
the half-peak magnitude iso-curve:
()
1
2ln
2
2ln
2
2
22
2
22
=
′
+−
′
vFu
y
x
σπ
σπ
(3)
This is an ellipse of semiaxes
yx
ba
πσπσ
2
2ln
2
2ln
==
(4)
The maximum frequency value reached by the
half-peak magnitude iso-curve of the filter at the
highest frequency (F
M
) is:
x
M
FF
πσ
2
2ln
max
+=
(5)
Setting F
max
= ½
x
x
M
F
πσ
πσ
2
2ln2−
=
(6)
The smoothing parameters, σ
x
and σ
y
, can be set
of such way that the half peak magnitude iso-curve
overlaps in greater or smaller measurement
modifying in (7) the parameters K
x
and K
y
, called
radial overlap and circumferencial overlap. Setting
this values to one makes adjacent filters touch each
other.
(
)
()
()
2tan2
2ln
122
122ln
ϑ
π
σ
π
σ
BF
K
F
K
yy
B
B
xx
F
F
=
−
+
=
(7)
being B
F
and B
θ
the frequency and orientation
bandwitch, in octaves and radians respectively. The
central frequency is affected by the value of σx, so
the central frequency must be calculated as in (8).
(
)
()()
()
1122
12
−++⋅
+
=
xx
B
B
x
M
KK
K
F
F
F
(8)
So, first of all, we must set the radial overlap
value and the frequency bandwitch, and then we
calculate de central frequency and smoothing
parameters.
To compute the transformed images we have
used the Convolution theorem, which says that the
Fourier transform of a convolution is the point-wise
product of Fourier transforms:
()
),(),(),(),(
1
vuGvuFyxgyxf
−
ℑ=⊗
(9)
VISAPP 2008 - International Conference on Computer Vision Theory and Applications
482
There are several features of the filter response
we could measure. We could use the real part, the
imaginary part, the magnitude or the phase. We have
chosen the magnitude because it contains more
information and it is more robust.
The detection method used is based on the
concept of distance, as a measure of closeness of
two points in the feature space. There several
methods to measure the distance. The type of
distance we adopted is called euclidean distance and
can be calculated as follows:
()
∑
=
−=
N
i
sirirs
xx
N
1
2
1
δ
(10)
x
r
and x
s
represent two generic points in the feature
space of dimension N.
2.3 Implementation
The main objective of defect detection is to
determinate if there is a defect inside an image. To
carry out this objective we have divide the images
into two groups: defected and non-defected images,
and evaluate the response of the filters.
The number of frequencies selected is eight and
the number of orientations is also eight, so the filter
bank is composed of 64 Gabor filters. We have
adopted the approach to design the filter such as the
half-peak magnitude iso-curves of adjacent filters
touch each other and these iso-curves reaches the
value 0,5 at the highest frequency. The size of then
filter is 256x256, so the images acquired must be
divided into pieces of the same size. The frequency
bandwidth selected is ½ octaves. The tests carried
out show us that these parameters reach the
compromise between selectivity and dispersion.
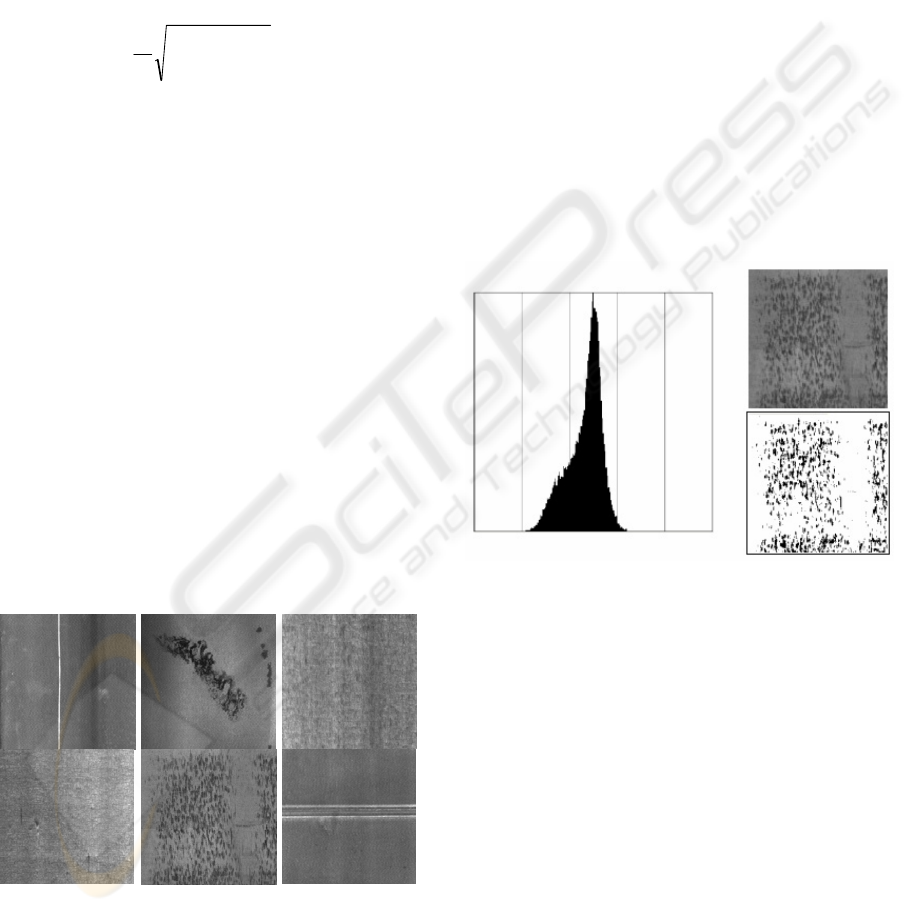
Figure 11: Defects types used in this paper.
In each image without defect we have calculated
the mean value response of each of the filters of the
bank. Then we have calculated the euclidean
distance between the mean value calculated and the
maximum value reached in every image use for
training. The defected images will have a higher
response to some filters in some part of the image
than the images without defects.
Establishing an appropriate limit between images
that contain defects and images with no defect we
can achieve our goal.
3 EXPERIMENTAL RESULTS
We have studied six types of the defects commonly
found in rolled steel: vertical scratch, rust, coat-less,
indents, settlement marks and weld (Fig. 11).
A total of 768 images were selected for training
and another 768 were used for testing. In both of the
groups half of the images contain a defect and in the
other half there was no defect. We have 64 images
of each type of defect resulting a total of 384 images
contain a defect in each group.
Figure 12: Segmentation based on the histogram for a
settlement mark defect.
The method used in segmentation of the images
is based in the idea that different objects or regions
in the image have significantly different grey levels.
Thresholds are usually determined from the grey-
level histogram of an image. We have search for two
thresholds, the upper and the lower, assuming that
the zone of the image with no defect has a medium
grey level. We have calculated the mean and
standard deviation of the number of pixel outside the
thresholds (Fig. 12).
SURFACE DEFECTS DETECTION ON ROLLED STEEL STRIPS BY GABOR FILTERS
483
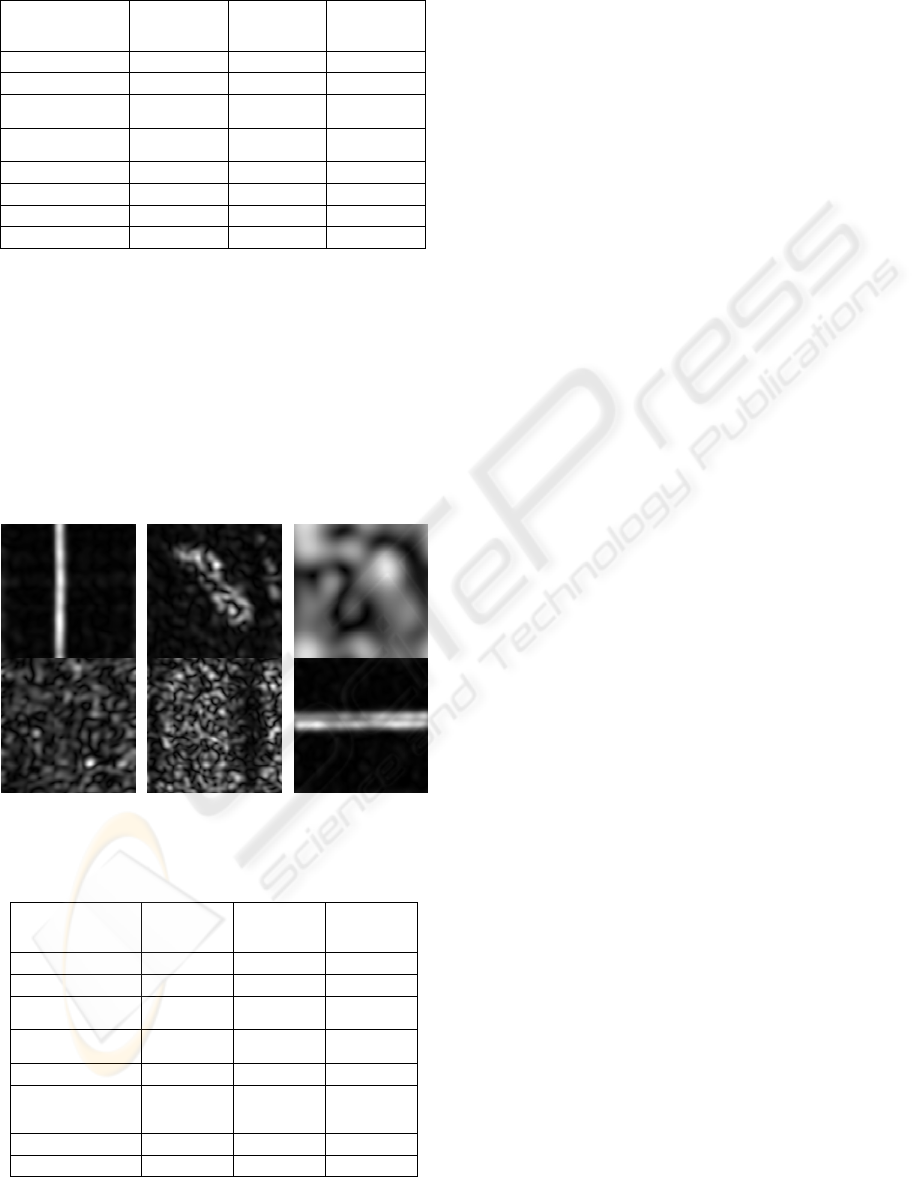
Table 1: Mean and standard deviation of the percentage of
pixel outside the thresholds.
Mean
Standard
Deviation
Percentage
of detection
N
o defec
t
0.195165 0.081513 95.3125
D
efec
t
3.131472 2.639977 91.9270
Vertical scratch
2.340807
0.174513 97.6562
Rust
5.254671
4,546847
98.8281
Coat-less 0.264038 0.091215 78.5156
Indents 0.484261 0.146349 91,4062
Settlement marks 8.31251 2.541135 86.3281
Weld 2.132541 0.419870 98.8281
As we can see in the chart above (Table 1), there
are a 4.69 rate of false positives, and the defects are
correctly detected in 91.93%.
To improve the results obtained with the grey-
level histogram we have developed the Gabor filter.
Observing the response of the these filters for
training images (Fig.13), we have established the
limit that separate the defect images and the no
defect images. The test images have been used to
determinate the goodness of the method.
Figure 13: Some transformed images used in this paper.
Table 2: Mean and standard deviation of the euclidean
distance.
Mean
Standard
Deviation
Percentage
of detection
N
o defec
t
0.158103 0.035414 99.21875
D
efec
t
0.375900 0.101831 96.61458
Vertical scratch
0.395899
0.076832 97.6562
Rust
0.353493
0.130730 85.9375
Coat-less 0.264038 0.010007 98.82812
Indents 0.374794 0.046349
99.21875
Settlement marks 0.407765 0.068066 98.82812
Weld 0.459415 0.075339 99.21875
The measure of the distance can be observed in
the next chart (Table 2). We can see in this chart the
mean value and the standard deviation of the
euclidean distance between the mean value, obtained
with the training images without defect, and the
maximum value of then transformed image. In the
third column we can see the percentage of defect
detection obtained with the testing images. The first
two rows show the results for no-defect and defect
images. The rest of the rows show the results for
each type of defect studied.
We can see that we detect 96,61% of the defects,
obtaining only a 0,78% of false positives. The defect
of rust is the one that reaches the worst results,
obtained almost 86% of right detection. The rest of
defects are detected around 99%.
4 CONCLUSIONS
Quality control is a key process in steel flat products
manufacturing and processing. Coil slitting and
cutting is a paradigmatic process: often 200 meters a
minute process speed is reached, so than human
visual inspection is dramatically restricted.
We have developed an automated cellular visual
inspection system of flat products in a
flat steel
cutting factory (GONVARRI Burgos, Spain).
Among the approaches that the system uses to detect
defects, we have included the traditional methods
and two-dimensional Gabor filters.
The traditional methods based on the study of the
grey-level histogram and shape analysis, have shown
quite good results, but there are not good enough to
achieve the level of success required. It has been
necessary the implementation of new methods. The
application of Gabor filters seem to be a good
alternative to the traditional methods.
The results obtained in the detection of six of the
most common defects that appear over the surface of
the steel have reached a rate of 96,61% of right
detection, obtaining only a 0,78% of false positives.
ACKNOWLEDGEMENTS
This research is partially funded by GONVARRI
Group, the Spanish FIT-020400-2006-125 research
project, and the Agencia de Inversiones y Servicios
(ADE) of Castilla y León (Spain).
VISAPP 2008 - International Conference on Computer Vision Theory and Applications
484

REFERENCES
Beck, J., Sutter, A. and Ivry, R., 1987. Spatial frequency
channels and perceptual grouping in texture
segregation . Computer Vision. Graphics and Image
Processing. pp. 299–325.
Chin, R.T., 1992. Automated visual inspection algorihms.
In: Computer Vision: Theory and Insdustrial
Applications, Springer Verlag, New York, pp. 377-404.
Daugman, J.G., 1985. Uncertainty relation for resolution
in space, spatial frequency, and orientation optimized
by two-dimensional visual cortical filters, J. Opt. Soc.
Am., vol. 2, pp. 1160-1169.
Daugman, J.G., 2002. Gabor wavelets and statistical
pattern recognition. The Handbook of Brain Theory
and Neural Networks. 2nd ed.. MIT Press (M. Arbib.
editor). pp. 457-463.
Gayubo, F., González, J.L., de la Fuente, E., Miguel, F.,
and Perán, J.R., 2006. On-line machine vision system
for detect split defects in sheet-metal forming
processes. Conference on Pattern Recognition. ICPR
2006. vol. 1, pp. 723-726.
Gayubo F., González L.M., Olmedo D., Medina R. Goméz
J., González J.L. 2006. Inspección visual en línea de
defectos en piezas de chapa embutida. Proc. XVI
Congreso de Máquinas-Herramienta y Tecnologías de
Fabricación. vol. 1. pp. 715-728.
Hubel, D.H. and Wiesel, T.N., 1962. Receptive fields,
binocular interaction, and functional architecture in the
cat's visual cortex J Physiol. (Lond.), vol. 160, pp.
106-154.
Kamarainen, J.K., 2003. Feature extraction using Gabor
filters. PhD thesis.
Obeso, F., Gonzalez, J.A., Dominguez, S., Campoy, P. and
Mochon, J., 1997. Intelligent on-line surface
inspection on a skinpass mill. Iron and Steel Engineer.
Parker, J.R., 1997. Algorithms for Image Processing and
Computer Vision. Wiley Computer Publishing.
Phan, D.T. and Alcock, R.J., 2003. Smart Inspection
Systems. Techniques and applications if Intelligent
Vision. Ed. Academic Press.
Porat, M. and Zeevi, Y.Y., 1988. The generalized Gabor
scheme of image representation in biological and
machine vision. IEEE Transactions on Pattern
Analysis Machine Intelligence. pp. 452–468.
Ramana, K.V. and Ramamoorthy, B., 1996. Statistical
methods to compare the texture features of machined
surfaces. In: Pattern Recognition. pp. 1447–1459.
Sahoo P.K., Soltani S., Wong, A.K.C. and Chen Y.C.,
1988. A Survey of Threshonding Techniques.
Computer Vision, Graphics and Image Processing.
Vol. 41, pp. 233-260.
Tsai, D.M. and Wu, S.K., 2000. Automated Surface
Inspection Using Gabor Filters Int J Adv Manuf
Technol. pp. 474–482.
Wechsler, H., 1980. Texture analysis: a survey. Signal
Processing
. pp. 271–282.
SURFACE DEFECTS DETECTION ON ROLLED STEEL STRIPS BY GABOR FILTERS
485
